

Key Insights
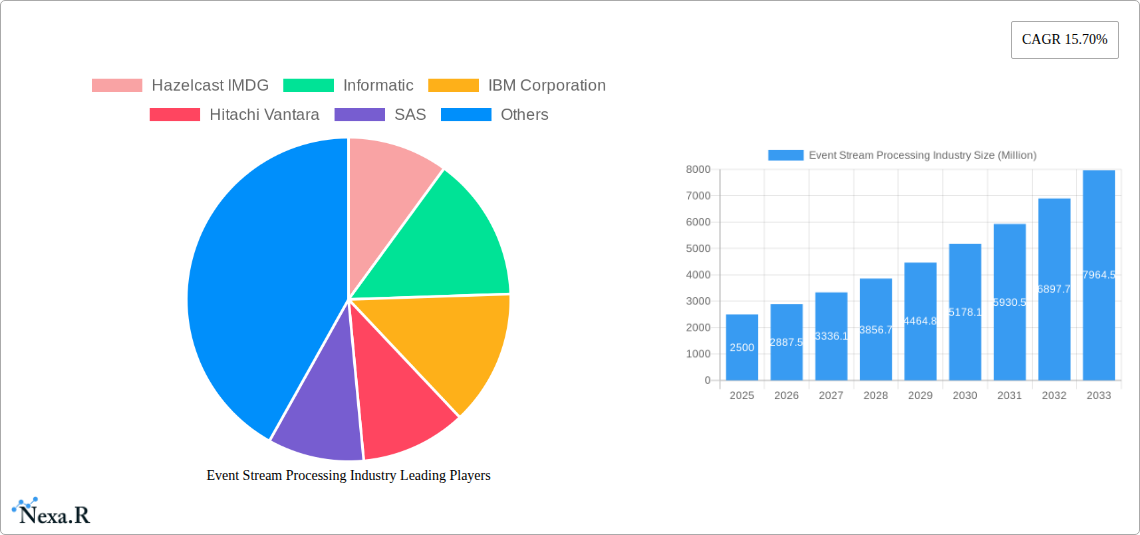
The Event Stream Processing (ESP) market is experiencing robust growth, driven by the increasing need for real-time data analysis across diverse sectors. The market, valued at approximately $XX million in 2025, is projected to expand at a Compound Annual Growth Rate (CAGR) of 15.70% from 2025 to 2033. This growth is fueled by several key drivers: the exponential rise in data volume from IoT devices and digital platforms, the need for immediate insights for improved decision-making, and the increasing adoption of cloud-based solutions for scalability and cost-effectiveness. Key trends include the integration of advanced analytics, such as machine learning and AI, into ESP platforms, enhancing predictive capabilities and automation. Furthermore, the market is witnessing a shift towards serverless architectures and edge computing, enabling faster processing and reduced latency. Despite these positive trends, market restraints include the complexity of implementing and managing ESP systems, the need for skilled professionals, and the security concerns associated with handling real-time data streams.
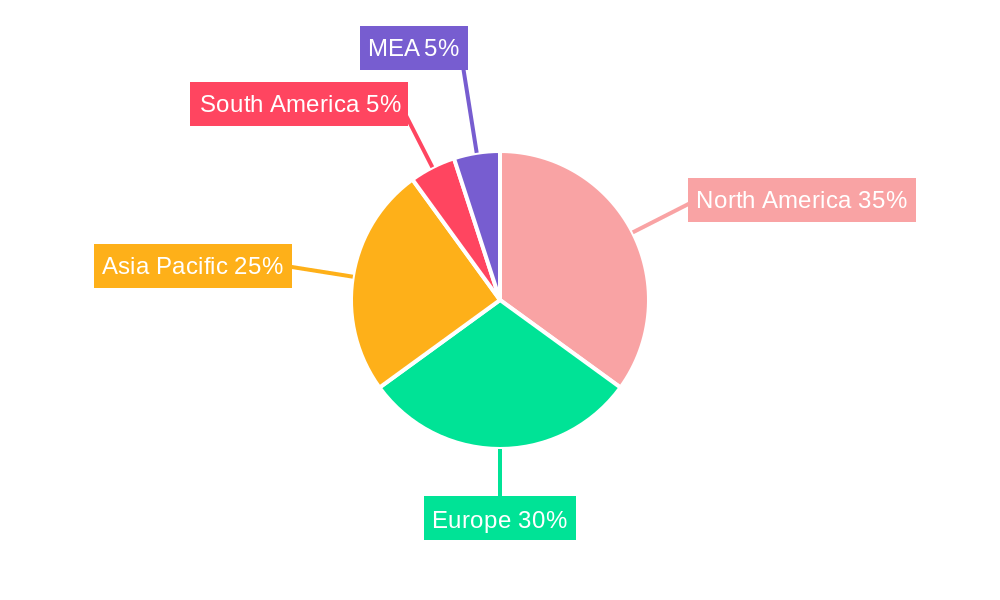
The segmentation analysis reveals that software and platform solutions dominate the component market, closely followed by services. Fraud detection, algorithmic trading, and process monitoring are leading applications, reflecting the diverse use cases across industries. The BFSI (Banking, Financial Services, and Insurance) and IT & Telecommunications sectors are currently the largest end-user verticals, though growth is expected across all sectors, especially in manufacturing and retail/e-commerce, as they increasingly leverage real-time data for operational efficiency and personalized customer experiences. Cloud deployment is rapidly gaining traction over on-premise solutions, driven by its inherent flexibility and scalability. Major market players such as IBM, Microsoft, Amazon Web Services, and others are actively investing in R&D and strategic partnerships to solidify their market positions and capitalize on emerging opportunities within the rapidly evolving ESP landscape. This competitive landscape ensures continuous innovation and drives down costs, benefiting end-users. The geographical distribution shows strong market presence in North America and Europe, but Asia-Pacific is expected to witness significant growth over the forecast period fueled by increased digitalization and technological advancements.
Event Stream Processing Industry Market Report: 2019-2033
This comprehensive report provides a detailed analysis of the Event Stream Processing industry, encompassing market dynamics, growth trends, regional dominance, product landscapes, and key players. The study period covers 2019-2033, with 2025 as the base and estimated year. The report forecasts market trends from 2025-2033, leveraging historical data from 2019-2024. The market is segmented by component (Solutions (Software & Platforms), Services), application (Fraud Detection, Algorithmic Trading, Process Monitoring, Predictive Maintenance, Sales and Marketing), end-user vertical (IT & Telecommunications, BFSI, Manufacturing, Retail & E-commerce, Energy & Utilities, Other End-user Verticals), and deployment type (Cloud, On-premise). Key players analyzed include Hazelcast IMDG, Informatica, IBM Corporation, Hitachi Vantara, SAS, Microsoft Corporation, Confluent Inc, Redhat, Amazon Web Services Inc, Oracle Corporation, Salesforce, TIBCO, Google Inc, and SAP SE.
Event Stream Processing Industry Market Dynamics & Structure
The Event Stream Processing market is characterized by a moderately concentrated landscape, with a few major players holding significant market share. The market's value in 2025 is estimated at xx Million. Technological innovation, particularly in areas like real-time analytics and AI/ML integration, is a key driver. Regulatory compliance, particularly around data privacy (e.g., GDPR, CCPA), significantly impacts market dynamics. The industry faces competition from traditional data processing methods, but the demand for real-time insights is fueling its growth. M&A activity remains moderate, with xx deals recorded in the last five years, primarily focused on enhancing capabilities and expanding market reach.
- Market Concentration: Moderately concentrated, with top 5 players holding approximately xx% market share in 2025.
- Technological Innovation: Driven by advancements in cloud computing, big data technologies, and AI/ML.
- Regulatory Frameworks: Compliance with data privacy regulations is crucial and impacts vendor selection.
- Competitive Substitutes: Traditional batch processing systems pose a competitive threat.
- End-user Demographics: Growth is driven by increasing adoption across diverse sectors like BFSI and Retail & E-commerce.
- M&A Trends: Strategic acquisitions to expand product portfolios and geographic reach.
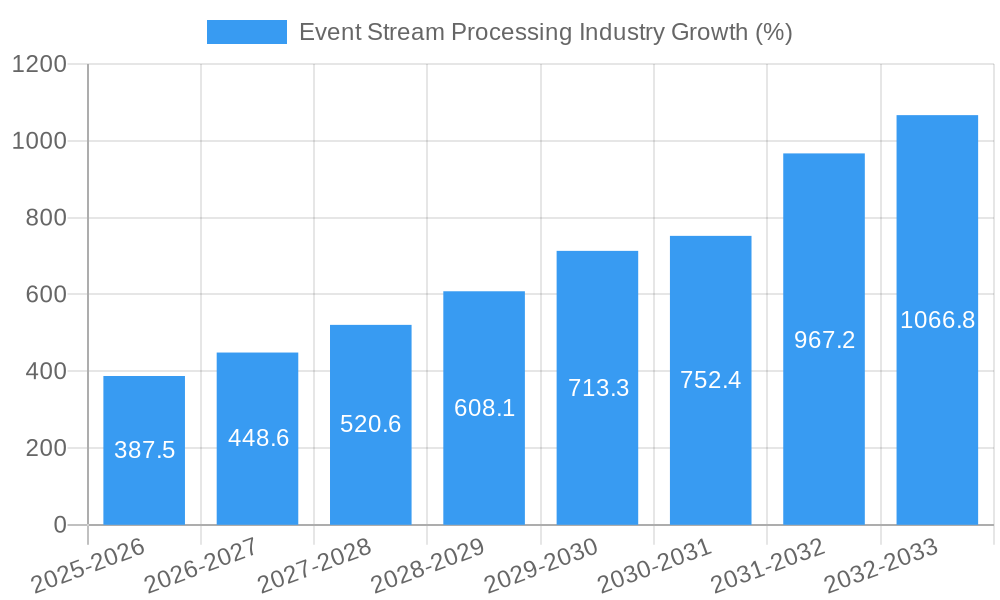
Event Stream Processing Industry Growth Trends & Insights
The Event Stream Processing market exhibits robust growth, fueled by the rising demand for real-time data analytics across various industries. The market size is projected to grow at a Compound Annual Growth Rate (CAGR) of xx% during the forecast period (2025-2033), reaching xx Million by 2033. Market penetration is increasing steadily, with wider adoption across diverse industry verticals. Technological disruptions, such as the emergence of serverless computing and edge computing, are reshaping the industry landscape. Consumer behavior shifts towards personalized experiences are driving the need for real-time data analysis. The cloud deployment model witnesses the fastest growth, driven by scalability and cost-effectiveness.
Dominant Regions, Countries, or Segments in Event Stream Processing Industry
North America currently dominates the Event Stream Processing market, holding a significant market share of xx% in 2025 due to early adoption of advanced technologies and a strong presence of key players. However, the Asia-Pacific region exhibits the highest growth potential, driven by rapid digital transformation and increasing investment in technological infrastructure. Within the segments, the Solutions (Software & Platforms) segment holds the largest share, followed by the Services segment. The Fraud Detection application segment is currently the largest revenue-generating application, showing significant potential growth.
- North America: High market maturity, strong technology adoption, and established player presence.
- Asia-Pacific: Highest growth potential, driven by increasing digitalization and infrastructure development.
- Europe: Significant market size, driven by strong regulatory frameworks and data privacy concerns.
- Solutions (Software & Platforms): Largest segment by revenue, offering comprehensive tools and platforms.
- Services: Growing segment, providing implementation, integration, and maintenance services.
- Fraud Detection: Largest application segment, driven by increasing financial crimes and regulatory requirements.
Event Stream Processing Industry Product Landscape
The Event Stream Processing product landscape is characterized by a wide range of solutions, encompassing real-time data ingestion platforms, stream processing engines, and advanced analytics tools. These solutions offer diverse functionalities, including data enrichment, transformation, and visualization. Key innovations include serverless architectures, AI-powered analytics, and enhanced security features. The focus is on providing scalable, cost-effective, and easy-to-use solutions to cater to diverse business needs.
Key Drivers, Barriers & Challenges in Event Stream Processing Industry
Key Drivers: The increasing volume and velocity of data, the need for real-time insights, and the growing adoption of cloud computing are key drivers for the Event Stream Processing market. Government initiatives promoting digital transformation and advancements in AI/ML also contribute to the market growth.
Challenges: Integration complexities, skills shortage, data security and privacy concerns, and vendor lock-in are some key challenges hindering market growth. Supply chain disruptions and the high cost of implementation can also affect market expansion. The total impact of these challenges is estimated to reduce the market growth by approximately xx% in 2025.
Emerging Opportunities in Event Stream Processing Industry
Emerging opportunities lie in the integration of Event Stream Processing with IoT devices, the development of low-code/no-code platforms, and the expansion into untapped markets, such as the healthcare and logistics sectors. The adoption of edge computing and the rise of real-time data analytics in the metaverse presents significant growth prospects.
Growth Accelerators in the Event Stream Processing Industry
Technological advancements like the development of faster and more efficient processing engines, coupled with the increasing adoption of cloud-based solutions and strategic partnerships between technology providers and industry verticals, are accelerating the growth of the Event Stream Processing market. Expanding into new applications and vertical markets further fuels this expansion.
Key Players Shaping the Event Stream Processing Industry Market
- Hazelcast IMDG
- Informatica
- IBM Corporation
- Hitachi Vantara
- SAS
- Microsoft Corporation
- Confluent Inc
- Redhat
- Amazon Web Services Inc
- Oracle Corporation
- Salesforce
- TIBCO
- Google Inc
- SAP SE
Notable Milestones in Event Stream Processing Industry Sector
- October 2022: Microsoft released the Azure Stream Analytics no-code editor, simplifying stream processing job design.
- August 2022: DataStax and Decodable partnered to offer streamlined real-time app development using Apache Cassandra, Pulsar, and Flink.
In-Depth Event Stream Processing Industry Market Outlook
The Event Stream Processing market is poised for significant growth, driven by technological advancements, increased adoption across various sectors, and the emergence of innovative applications. Strategic partnerships, expansions into untapped markets, and the continuous evolution of real-time analytics capabilities will shape the future of this dynamic industry. The market presents substantial opportunities for both established players and new entrants to capitalize on the increasing demand for real-time insights.
Event Stream Processing Industry Segmentation
-
1. Deployment Type
- 1.1. Cloud
- 1.2. On-premise
-
2. Component
- 2.1. Solutions (Software & Platforms)
- 2.2. Services
-
3. Application**
- 3.1. Fraud Detection
- 3.2. Algorithmic Trading
- 3.3. Process Monitoring
- 3.4. Predictive Maintenance
- 3.5. Sales and Marketing
-
4. End-user Vertical
- 4.1. IT & Telecommunications
- 4.2. BFSI
- 4.3. Manufacturing
- 4.4. Retail & E-commerce
- 4.5. Energy & Utilities
- 4.6. Other End-user Verticals
Event Stream Processing Industry Segmentation By Geography
- 1. North America
- 2. Europe
- 3. Asia Pacific
- 4. Latin America
- 5. Middle East and Africa
Event Stream Processing Industry REPORT HIGHLIGHTS
| Aspects | Details |
|---|---|
| Study Period | 2019-2033 |
| Base Year | 2024 |
| Estimated Year | 2025 |
| Forecast Period | 2025-2033 |
| Historical Period | 2019-2024 |
| Growth Rate | CAGR of 15.70% from 2019-2033 |
| Segmentation |
|
Table of Contents
- 1. Introduction
- 1.1. Research Scope
- 1.2. Market Segmentation
- 1.3. Research Methodology
- 1.4. Definitions and Assumptions
- 2. Executive Summary
- 2.1. Introduction
- 3. Market Dynamics
- 3.1. Introduction
- 3.2. Market Drivers
- 3.2.1. Increasing Adoption of the Internet of Things (IoT) and Smart Devices; Increasing Need to Analyze Large Volumes of Data From Diverse Sources
- 3.3. Market Restrains
- 3.3.1. Concerns Associated with Data Security and Privacy
- 3.4. Market Trends
- 3.4.1. Increasing Adoption of the Internet of Things (IoT) and Smart Devices
- 4. Market Factor Analysis
- 4.1. Porters Five Forces
- 4.2. Supply/Value Chain
- 4.3. PESTEL analysis
- 4.4. Market Entropy
- 4.5. Patent/Trademark Analysis
- 5. Global Event Stream Processing Industry Analysis, Insights and Forecast, 2019-2031
- 5.1. Market Analysis, Insights and Forecast - by Deployment Type
- 5.1.1. Cloud
- 5.1.2. On-premise
- 5.2. Market Analysis, Insights and Forecast - by Component
- 5.2.1. Solutions (Software & Platforms)
- 5.2.2. Services
- 5.3. Market Analysis, Insights and Forecast - by Application**
- 5.3.1. Fraud Detection
- 5.3.2. Algorithmic Trading
- 5.3.3. Process Monitoring
- 5.3.4. Predictive Maintenance
- 5.3.5. Sales and Marketing
- 5.4. Market Analysis, Insights and Forecast - by End-user Vertical
- 5.4.1. IT & Telecommunications
- 5.4.2. BFSI
- 5.4.3. Manufacturing
- 5.4.4. Retail & E-commerce
- 5.4.5. Energy & Utilities
- 5.4.6. Other End-user Verticals
- 5.5. Market Analysis, Insights and Forecast - by Region
- 5.5.1. North America
- 5.5.2. Europe
- 5.5.3. Asia Pacific
- 5.5.4. Latin America
- 5.5.5. Middle East and Africa
- 5.1. Market Analysis, Insights and Forecast - by Deployment Type
- 6. North America Event Stream Processing Industry Analysis, Insights and Forecast, 2019-2031
- 6.1. Market Analysis, Insights and Forecast - by Deployment Type
- 6.1.1. Cloud
- 6.1.2. On-premise
- 6.2. Market Analysis, Insights and Forecast - by Component
- 6.2.1. Solutions (Software & Platforms)
- 6.2.2. Services
- 6.3. Market Analysis, Insights and Forecast - by Application**
- 6.3.1. Fraud Detection
- 6.3.2. Algorithmic Trading
- 6.3.3. Process Monitoring
- 6.3.4. Predictive Maintenance
- 6.3.5. Sales and Marketing
- 6.4. Market Analysis, Insights and Forecast - by End-user Vertical
- 6.4.1. IT & Telecommunications
- 6.4.2. BFSI
- 6.4.3. Manufacturing
- 6.4.4. Retail & E-commerce
- 6.4.5. Energy & Utilities
- 6.4.6. Other End-user Verticals
- 6.1. Market Analysis, Insights and Forecast - by Deployment Type
- 7. Europe Event Stream Processing Industry Analysis, Insights and Forecast, 2019-2031
- 7.1. Market Analysis, Insights and Forecast - by Deployment Type
- 7.1.1. Cloud
- 7.1.2. On-premise
- 7.2. Market Analysis, Insights and Forecast - by Component
- 7.2.1. Solutions (Software & Platforms)
- 7.2.2. Services
- 7.3. Market Analysis, Insights and Forecast - by Application**
- 7.3.1. Fraud Detection
- 7.3.2. Algorithmic Trading
- 7.3.3. Process Monitoring
- 7.3.4. Predictive Maintenance
- 7.3.5. Sales and Marketing
- 7.4. Market Analysis, Insights and Forecast - by End-user Vertical
- 7.4.1. IT & Telecommunications
- 7.4.2. BFSI
- 7.4.3. Manufacturing
- 7.4.4. Retail & E-commerce
- 7.4.5. Energy & Utilities
- 7.4.6. Other End-user Verticals
- 7.1. Market Analysis, Insights and Forecast - by Deployment Type
- 8. Asia Pacific Event Stream Processing Industry Analysis, Insights and Forecast, 2019-2031
- 8.1. Market Analysis, Insights and Forecast - by Deployment Type
- 8.1.1. Cloud
- 8.1.2. On-premise
- 8.2. Market Analysis, Insights and Forecast - by Component
- 8.2.1. Solutions (Software & Platforms)
- 8.2.2. Services
- 8.3. Market Analysis, Insights and Forecast - by Application**
- 8.3.1. Fraud Detection
- 8.3.2. Algorithmic Trading
- 8.3.3. Process Monitoring
- 8.3.4. Predictive Maintenance
- 8.3.5. Sales and Marketing
- 8.4. Market Analysis, Insights and Forecast - by End-user Vertical
- 8.4.1. IT & Telecommunications
- 8.4.2. BFSI
- 8.4.3. Manufacturing
- 8.4.4. Retail & E-commerce
- 8.4.5. Energy & Utilities
- 8.4.6. Other End-user Verticals
- 8.1. Market Analysis, Insights and Forecast - by Deployment Type
- 9. Latin America Event Stream Processing Industry Analysis, Insights and Forecast, 2019-2031
- 9.1. Market Analysis, Insights and Forecast - by Deployment Type
- 9.1.1. Cloud
- 9.1.2. On-premise
- 9.2. Market Analysis, Insights and Forecast - by Component
- 9.2.1. Solutions (Software & Platforms)
- 9.2.2. Services
- 9.3. Market Analysis, Insights and Forecast - by Application**
- 9.3.1. Fraud Detection
- 9.3.2. Algorithmic Trading
- 9.3.3. Process Monitoring
- 9.3.4. Predictive Maintenance
- 9.3.5. Sales and Marketing
- 9.4. Market Analysis, Insights and Forecast - by End-user Vertical
- 9.4.1. IT & Telecommunications
- 9.4.2. BFSI
- 9.4.3. Manufacturing
- 9.4.4. Retail & E-commerce
- 9.4.5. Energy & Utilities
- 9.4.6. Other End-user Verticals
- 9.1. Market Analysis, Insights and Forecast - by Deployment Type
- 10. Middle East and Africa Event Stream Processing Industry Analysis, Insights and Forecast, 2019-2031
- 10.1. Market Analysis, Insights and Forecast - by Deployment Type
- 10.1.1. Cloud
- 10.1.2. On-premise
- 10.2. Market Analysis, Insights and Forecast - by Component
- 10.2.1. Solutions (Software & Platforms)
- 10.2.2. Services
- 10.3. Market Analysis, Insights and Forecast - by Application**
- 10.3.1. Fraud Detection
- 10.3.2. Algorithmic Trading
- 10.3.3. Process Monitoring
- 10.3.4. Predictive Maintenance
- 10.3.5. Sales and Marketing
- 10.4. Market Analysis, Insights and Forecast - by End-user Vertical
- 10.4.1. IT & Telecommunications
- 10.4.2. BFSI
- 10.4.3. Manufacturing
- 10.4.4. Retail & E-commerce
- 10.4.5. Energy & Utilities
- 10.4.6. Other End-user Verticals
- 10.1. Market Analysis, Insights and Forecast - by Deployment Type
- 11. North America Event Stream Processing Industry Analysis, Insights and Forecast, 2019-2031
- 11.1. Market Analysis, Insights and Forecast - By Country/Sub-region
- 11.1.1 United States
- 11.1.2 Canada
- 11.1.3 Mexico
- 12. Europe Event Stream Processing Industry Analysis, Insights and Forecast, 2019-2031
- 12.1. Market Analysis, Insights and Forecast - By Country/Sub-region
- 12.1.1 Germany
- 12.1.2 United Kingdom
- 12.1.3 France
- 12.1.4 Spain
- 12.1.5 Italy
- 12.1.6 Spain
- 12.1.7 Belgium
- 12.1.8 Netherland
- 12.1.9 Nordics
- 12.1.10 Rest of Europe
- 13. Asia Pacific Event Stream Processing Industry Analysis, Insights and Forecast, 2019-2031
- 13.1. Market Analysis, Insights and Forecast - By Country/Sub-region
- 13.1.1 China
- 13.1.2 Japan
- 13.1.3 India
- 13.1.4 South Korea
- 13.1.5 Southeast Asia
- 13.1.6 Australia
- 13.1.7 Indonesia
- 13.1.8 Phillipes
- 13.1.9 Singapore
- 13.1.10 Thailandc
- 13.1.11 Rest of Asia Pacific
- 14. South America Event Stream Processing Industry Analysis, Insights and Forecast, 2019-2031
- 14.1. Market Analysis, Insights and Forecast - By Country/Sub-region
- 14.1.1 Brazil
- 14.1.2 Argentina
- 14.1.3 Peru
- 14.1.4 Chile
- 14.1.5 Colombia
- 14.1.6 Ecuador
- 14.1.7 Venezuela
- 14.1.8 Rest of South America
- 15. North America Event Stream Processing Industry Analysis, Insights and Forecast, 2019-2031
- 15.1. Market Analysis, Insights and Forecast - By Country/Sub-region
- 15.1.1 United States
- 15.1.2 Canada
- 15.1.3 Mexico
- 16. MEA Event Stream Processing Industry Analysis, Insights and Forecast, 2019-2031
- 16.1. Market Analysis, Insights and Forecast - By Country/Sub-region
- 16.1.1 United Arab Emirates
- 16.1.2 Saudi Arabia
- 16.1.3 South Africa
- 16.1.4 Rest of Middle East and Africa
- 17. Competitive Analysis
- 17.1. Global Market Share Analysis 2024
- 17.2. Company Profiles
- 17.2.1 Hazelcast IMDG
- 17.2.1.1. Overview
- 17.2.1.2. Products
- 17.2.1.3. SWOT Analysis
- 17.2.1.4. Recent Developments
- 17.2.1.5. Financials (Based on Availability)
- 17.2.2 Informatic
- 17.2.2.1. Overview
- 17.2.2.2. Products
- 17.2.2.3. SWOT Analysis
- 17.2.2.4. Recent Developments
- 17.2.2.5. Financials (Based on Availability)
- 17.2.3 IBM Corporation
- 17.2.3.1. Overview
- 17.2.3.2. Products
- 17.2.3.3. SWOT Analysis
- 17.2.3.4. Recent Developments
- 17.2.3.5. Financials (Based on Availability)
- 17.2.4 Hitachi Vantara
- 17.2.4.1. Overview
- 17.2.4.2. Products
- 17.2.4.3. SWOT Analysis
- 17.2.4.4. Recent Developments
- 17.2.4.5. Financials (Based on Availability)
- 17.2.5 SAS
- 17.2.5.1. Overview
- 17.2.5.2. Products
- 17.2.5.3. SWOT Analysis
- 17.2.5.4. Recent Developments
- 17.2.5.5. Financials (Based on Availability)
- 17.2.6 Microsoft Corporation
- 17.2.6.1. Overview
- 17.2.6.2. Products
- 17.2.6.3. SWOT Analysis
- 17.2.6.4. Recent Developments
- 17.2.6.5. Financials (Based on Availability)
- 17.2.7 Confluent Inc
- 17.2.7.1. Overview
- 17.2.7.2. Products
- 17.2.7.3. SWOT Analysis
- 17.2.7.4. Recent Developments
- 17.2.7.5. Financials (Based on Availability)
- 17.2.8 Redhat
- 17.2.8.1. Overview
- 17.2.8.2. Products
- 17.2.8.3. SWOT Analysis
- 17.2.8.4. Recent Developments
- 17.2.8.5. Financials (Based on Availability)
- 17.2.9 Amazon Web Services Inc
- 17.2.9.1. Overview
- 17.2.9.2. Products
- 17.2.9.3. SWOT Analysis
- 17.2.9.4. Recent Developments
- 17.2.9.5. Financials (Based on Availability)
- 17.2.10 Oracle Corporation
- 17.2.10.1. Overview
- 17.2.10.2. Products
- 17.2.10.3. SWOT Analysis
- 17.2.10.4. Recent Developments
- 17.2.10.5. Financials (Based on Availability)
- 17.2.11 Salesforce
- 17.2.11.1. Overview
- 17.2.11.2. Products
- 17.2.11.3. SWOT Analysis
- 17.2.11.4. Recent Developments
- 17.2.11.5. Financials (Based on Availability)
- 17.2.12 TIBCO
- 17.2.12.1. Overview
- 17.2.12.2. Products
- 17.2.12.3. SWOT Analysis
- 17.2.12.4. Recent Developments
- 17.2.12.5. Financials (Based on Availability)
- 17.2.13 Google Inc
- 17.2.13.1. Overview
- 17.2.13.2. Products
- 17.2.13.3. SWOT Analysis
- 17.2.13.4. Recent Developments
- 17.2.13.5. Financials (Based on Availability)
- 17.2.14 SAP SE
- 17.2.14.1. Overview
- 17.2.14.2. Products
- 17.2.14.3. SWOT Analysis
- 17.2.14.4. Recent Developments
- 17.2.14.5. Financials (Based on Availability)
- 17.2.1 Hazelcast IMDG
List of Figures
- Figure 1: Global Event Stream Processing Industry Revenue Breakdown (Million, %) by Region 2024 & 2032
- Figure 2: North America Event Stream Processing Industry Revenue (Million), by Country 2024 & 2032
- Figure 3: North America Event Stream Processing Industry Revenue Share (%), by Country 2024 & 2032
- Figure 4: Europe Event Stream Processing Industry Revenue (Million), by Country 2024 & 2032
- Figure 5: Europe Event Stream Processing Industry Revenue Share (%), by Country 2024 & 2032
- Figure 6: Asia Pacific Event Stream Processing Industry Revenue (Million), by Country 2024 & 2032
- Figure 7: Asia Pacific Event Stream Processing Industry Revenue Share (%), by Country 2024 & 2032
- Figure 8: South America Event Stream Processing Industry Revenue (Million), by Country 2024 & 2032
- Figure 9: South America Event Stream Processing Industry Revenue Share (%), by Country 2024 & 2032
- Figure 10: North America Event Stream Processing Industry Revenue (Million), by Country 2024 & 2032
- Figure 11: North America Event Stream Processing Industry Revenue Share (%), by Country 2024 & 2032
- Figure 12: MEA Event Stream Processing Industry Revenue (Million), by Country 2024 & 2032
- Figure 13: MEA Event Stream Processing Industry Revenue Share (%), by Country 2024 & 2032
- Figure 14: North America Event Stream Processing Industry Revenue (Million), by Deployment Type 2024 & 2032
- Figure 15: North America Event Stream Processing Industry Revenue Share (%), by Deployment Type 2024 & 2032
- Figure 16: North America Event Stream Processing Industry Revenue (Million), by Component 2024 & 2032
- Figure 17: North America Event Stream Processing Industry Revenue Share (%), by Component 2024 & 2032
- Figure 18: North America Event Stream Processing Industry Revenue (Million), by Application** 2024 & 2032
- Figure 19: North America Event Stream Processing Industry Revenue Share (%), by Application** 2024 & 2032
- Figure 20: North America Event Stream Processing Industry Revenue (Million), by End-user Vertical 2024 & 2032
- Figure 21: North America Event Stream Processing Industry Revenue Share (%), by End-user Vertical 2024 & 2032
- Figure 22: North America Event Stream Processing Industry Revenue (Million), by Country 2024 & 2032
- Figure 23: North America Event Stream Processing Industry Revenue Share (%), by Country 2024 & 2032
- Figure 24: Europe Event Stream Processing Industry Revenue (Million), by Deployment Type 2024 & 2032
- Figure 25: Europe Event Stream Processing Industry Revenue Share (%), by Deployment Type 2024 & 2032
- Figure 26: Europe Event Stream Processing Industry Revenue (Million), by Component 2024 & 2032
- Figure 27: Europe Event Stream Processing Industry Revenue Share (%), by Component 2024 & 2032
- Figure 28: Europe Event Stream Processing Industry Revenue (Million), by Application** 2024 & 2032
- Figure 29: Europe Event Stream Processing Industry Revenue Share (%), by Application** 2024 & 2032
- Figure 30: Europe Event Stream Processing Industry Revenue (Million), by End-user Vertical 2024 & 2032
- Figure 31: Europe Event Stream Processing Industry Revenue Share (%), by End-user Vertical 2024 & 2032
- Figure 32: Europe Event Stream Processing Industry Revenue (Million), by Country 2024 & 2032
- Figure 33: Europe Event Stream Processing Industry Revenue Share (%), by Country 2024 & 2032
- Figure 34: Asia Pacific Event Stream Processing Industry Revenue (Million), by Deployment Type 2024 & 2032
- Figure 35: Asia Pacific Event Stream Processing Industry Revenue Share (%), by Deployment Type 2024 & 2032
- Figure 36: Asia Pacific Event Stream Processing Industry Revenue (Million), by Component 2024 & 2032
- Figure 37: Asia Pacific Event Stream Processing Industry Revenue Share (%), by Component 2024 & 2032
- Figure 38: Asia Pacific Event Stream Processing Industry Revenue (Million), by Application** 2024 & 2032
- Figure 39: Asia Pacific Event Stream Processing Industry Revenue Share (%), by Application** 2024 & 2032
- Figure 40: Asia Pacific Event Stream Processing Industry Revenue (Million), by End-user Vertical 2024 & 2032
- Figure 41: Asia Pacific Event Stream Processing Industry Revenue Share (%), by End-user Vertical 2024 & 2032
- Figure 42: Asia Pacific Event Stream Processing Industry Revenue (Million), by Country 2024 & 2032
- Figure 43: Asia Pacific Event Stream Processing Industry Revenue Share (%), by Country 2024 & 2032
- Figure 44: Latin America Event Stream Processing Industry Revenue (Million), by Deployment Type 2024 & 2032
- Figure 45: Latin America Event Stream Processing Industry Revenue Share (%), by Deployment Type 2024 & 2032
- Figure 46: Latin America Event Stream Processing Industry Revenue (Million), by Component 2024 & 2032
- Figure 47: Latin America Event Stream Processing Industry Revenue Share (%), by Component 2024 & 2032
- Figure 48: Latin America Event Stream Processing Industry Revenue (Million), by Application** 2024 & 2032
- Figure 49: Latin America Event Stream Processing Industry Revenue Share (%), by Application** 2024 & 2032
- Figure 50: Latin America Event Stream Processing Industry Revenue (Million), by End-user Vertical 2024 & 2032
- Figure 51: Latin America Event Stream Processing Industry Revenue Share (%), by End-user Vertical 2024 & 2032
- Figure 52: Latin America Event Stream Processing Industry Revenue (Million), by Country 2024 & 2032
- Figure 53: Latin America Event Stream Processing Industry Revenue Share (%), by Country 2024 & 2032
- Figure 54: Middle East and Africa Event Stream Processing Industry Revenue (Million), by Deployment Type 2024 & 2032
- Figure 55: Middle East and Africa Event Stream Processing Industry Revenue Share (%), by Deployment Type 2024 & 2032
- Figure 56: Middle East and Africa Event Stream Processing Industry Revenue (Million), by Component 2024 & 2032
- Figure 57: Middle East and Africa Event Stream Processing Industry Revenue Share (%), by Component 2024 & 2032
- Figure 58: Middle East and Africa Event Stream Processing Industry Revenue (Million), by Application** 2024 & 2032
- Figure 59: Middle East and Africa Event Stream Processing Industry Revenue Share (%), by Application** 2024 & 2032
- Figure 60: Middle East and Africa Event Stream Processing Industry Revenue (Million), by End-user Vertical 2024 & 2032
- Figure 61: Middle East and Africa Event Stream Processing Industry Revenue Share (%), by End-user Vertical 2024 & 2032
- Figure 62: Middle East and Africa Event Stream Processing Industry Revenue (Million), by Country 2024 & 2032
- Figure 63: Middle East and Africa Event Stream Processing Industry Revenue Share (%), by Country 2024 & 2032
List of Tables
- Table 1: Global Event Stream Processing Industry Revenue Million Forecast, by Region 2019 & 2032
- Table 2: Global Event Stream Processing Industry Revenue Million Forecast, by Deployment Type 2019 & 2032
- Table 3: Global Event Stream Processing Industry Revenue Million Forecast, by Component 2019 & 2032
- Table 4: Global Event Stream Processing Industry Revenue Million Forecast, by Application** 2019 & 2032
- Table 5: Global Event Stream Processing Industry Revenue Million Forecast, by End-user Vertical 2019 & 2032
- Table 6: Global Event Stream Processing Industry Revenue Million Forecast, by Region 2019 & 2032
- Table 7: Global Event Stream Processing Industry Revenue Million Forecast, by Country 2019 & 2032
- Table 8: United States Event Stream Processing Industry Revenue (Million) Forecast, by Application 2019 & 2032
- Table 9: Canada Event Stream Processing Industry Revenue (Million) Forecast, by Application 2019 & 2032
- Table 10: Mexico Event Stream Processing Industry Revenue (Million) Forecast, by Application 2019 & 2032
- Table 11: Global Event Stream Processing Industry Revenue Million Forecast, by Country 2019 & 2032
- Table 12: Germany Event Stream Processing Industry Revenue (Million) Forecast, by Application 2019 & 2032
- Table 13: United Kingdom Event Stream Processing Industry Revenue (Million) Forecast, by Application 2019 & 2032
- Table 14: France Event Stream Processing Industry Revenue (Million) Forecast, by Application 2019 & 2032
- Table 15: Spain Event Stream Processing Industry Revenue (Million) Forecast, by Application 2019 & 2032
- Table 16: Italy Event Stream Processing Industry Revenue (Million) Forecast, by Application 2019 & 2032
- Table 17: Spain Event Stream Processing Industry Revenue (Million) Forecast, by Application 2019 & 2032
- Table 18: Belgium Event Stream Processing Industry Revenue (Million) Forecast, by Application 2019 & 2032
- Table 19: Netherland Event Stream Processing Industry Revenue (Million) Forecast, by Application 2019 & 2032
- Table 20: Nordics Event Stream Processing Industry Revenue (Million) Forecast, by Application 2019 & 2032
- Table 21: Rest of Europe Event Stream Processing Industry Revenue (Million) Forecast, by Application 2019 & 2032
- Table 22: Global Event Stream Processing Industry Revenue Million Forecast, by Country 2019 & 2032
- Table 23: China Event Stream Processing Industry Revenue (Million) Forecast, by Application 2019 & 2032
- Table 24: Japan Event Stream Processing Industry Revenue (Million) Forecast, by Application 2019 & 2032
- Table 25: India Event Stream Processing Industry Revenue (Million) Forecast, by Application 2019 & 2032
- Table 26: South Korea Event Stream Processing Industry Revenue (Million) Forecast, by Application 2019 & 2032
- Table 27: Southeast Asia Event Stream Processing Industry Revenue (Million) Forecast, by Application 2019 & 2032
- Table 28: Australia Event Stream Processing Industry Revenue (Million) Forecast, by Application 2019 & 2032
- Table 29: Indonesia Event Stream Processing Industry Revenue (Million) Forecast, by Application 2019 & 2032
- Table 30: Phillipes Event Stream Processing Industry Revenue (Million) Forecast, by Application 2019 & 2032
- Table 31: Singapore Event Stream Processing Industry Revenue (Million) Forecast, by Application 2019 & 2032
- Table 32: Thailandc Event Stream Processing Industry Revenue (Million) Forecast, by Application 2019 & 2032
- Table 33: Rest of Asia Pacific Event Stream Processing Industry Revenue (Million) Forecast, by Application 2019 & 2032
- Table 34: Global Event Stream Processing Industry Revenue Million Forecast, by Country 2019 & 2032
- Table 35: Brazil Event Stream Processing Industry Revenue (Million) Forecast, by Application 2019 & 2032
- Table 36: Argentina Event Stream Processing Industry Revenue (Million) Forecast, by Application 2019 & 2032
- Table 37: Peru Event Stream Processing Industry Revenue (Million) Forecast, by Application 2019 & 2032
- Table 38: Chile Event Stream Processing Industry Revenue (Million) Forecast, by Application 2019 & 2032
- Table 39: Colombia Event Stream Processing Industry Revenue (Million) Forecast, by Application 2019 & 2032
- Table 40: Ecuador Event Stream Processing Industry Revenue (Million) Forecast, by Application 2019 & 2032
- Table 41: Venezuela Event Stream Processing Industry Revenue (Million) Forecast, by Application 2019 & 2032
- Table 42: Rest of South America Event Stream Processing Industry Revenue (Million) Forecast, by Application 2019 & 2032
- Table 43: Global Event Stream Processing Industry Revenue Million Forecast, by Country 2019 & 2032
- Table 44: United States Event Stream Processing Industry Revenue (Million) Forecast, by Application 2019 & 2032
- Table 45: Canada Event Stream Processing Industry Revenue (Million) Forecast, by Application 2019 & 2032
- Table 46: Mexico Event Stream Processing Industry Revenue (Million) Forecast, by Application 2019 & 2032
- Table 47: Global Event Stream Processing Industry Revenue Million Forecast, by Country 2019 & 2032
- Table 48: United Arab Emirates Event Stream Processing Industry Revenue (Million) Forecast, by Application 2019 & 2032
- Table 49: Saudi Arabia Event Stream Processing Industry Revenue (Million) Forecast, by Application 2019 & 2032
- Table 50: South Africa Event Stream Processing Industry Revenue (Million) Forecast, by Application 2019 & 2032
- Table 51: Rest of Middle East and Africa Event Stream Processing Industry Revenue (Million) Forecast, by Application 2019 & 2032
- Table 52: Global Event Stream Processing Industry Revenue Million Forecast, by Deployment Type 2019 & 2032
- Table 53: Global Event Stream Processing Industry Revenue Million Forecast, by Component 2019 & 2032
- Table 54: Global Event Stream Processing Industry Revenue Million Forecast, by Application** 2019 & 2032
- Table 55: Global Event Stream Processing Industry Revenue Million Forecast, by End-user Vertical 2019 & 2032
- Table 56: Global Event Stream Processing Industry Revenue Million Forecast, by Country 2019 & 2032
- Table 57: Global Event Stream Processing Industry Revenue Million Forecast, by Deployment Type 2019 & 2032
- Table 58: Global Event Stream Processing Industry Revenue Million Forecast, by Component 2019 & 2032
- Table 59: Global Event Stream Processing Industry Revenue Million Forecast, by Application** 2019 & 2032
- Table 60: Global Event Stream Processing Industry Revenue Million Forecast, by End-user Vertical 2019 & 2032
- Table 61: Global Event Stream Processing Industry Revenue Million Forecast, by Country 2019 & 2032
- Table 62: Global Event Stream Processing Industry Revenue Million Forecast, by Deployment Type 2019 & 2032
- Table 63: Global Event Stream Processing Industry Revenue Million Forecast, by Component 2019 & 2032
- Table 64: Global Event Stream Processing Industry Revenue Million Forecast, by Application** 2019 & 2032
- Table 65: Global Event Stream Processing Industry Revenue Million Forecast, by End-user Vertical 2019 & 2032
- Table 66: Global Event Stream Processing Industry Revenue Million Forecast, by Country 2019 & 2032
- Table 67: Global Event Stream Processing Industry Revenue Million Forecast, by Deployment Type 2019 & 2032
- Table 68: Global Event Stream Processing Industry Revenue Million Forecast, by Component 2019 & 2032
- Table 69: Global Event Stream Processing Industry Revenue Million Forecast, by Application** 2019 & 2032
- Table 70: Global Event Stream Processing Industry Revenue Million Forecast, by End-user Vertical 2019 & 2032
- Table 71: Global Event Stream Processing Industry Revenue Million Forecast, by Country 2019 & 2032
- Table 72: Global Event Stream Processing Industry Revenue Million Forecast, by Deployment Type 2019 & 2032
- Table 73: Global Event Stream Processing Industry Revenue Million Forecast, by Component 2019 & 2032
- Table 74: Global Event Stream Processing Industry Revenue Million Forecast, by Application** 2019 & 2032
- Table 75: Global Event Stream Processing Industry Revenue Million Forecast, by End-user Vertical 2019 & 2032
- Table 76: Global Event Stream Processing Industry Revenue Million Forecast, by Country 2019 & 2032
Frequently Asked Questions
1. What is the projected Compound Annual Growth Rate (CAGR) of the Event Stream Processing Industry?
The projected CAGR is approximately 15.70%.
2. Which companies are prominent players in the Event Stream Processing Industry?
Key companies in the market include Hazelcast IMDG, Informatic, IBM Corporation, Hitachi Vantara, SAS, Microsoft Corporation, Confluent Inc, Redhat, Amazon Web Services Inc, Oracle Corporation, Salesforce, TIBCO, Google Inc, SAP SE.
3. What are the main segments of the Event Stream Processing Industry?
The market segments include Deployment Type, Component, Application**, End-user Vertical.
4. Can you provide details about the market size?
The market size is estimated to be USD XX Million as of 2022.
5. What are some drivers contributing to market growth?
Increasing Adoption of the Internet of Things (IoT) and Smart Devices; Increasing Need to Analyze Large Volumes of Data From Diverse Sources.
6. What are the notable trends driving market growth?
Increasing Adoption of the Internet of Things (IoT) and Smart Devices.
7. Are there any restraints impacting market growth?
Concerns Associated with Data Security and Privacy.
8. Can you provide examples of recent developments in the market?
October 2022: Microsoft has released the Azure Stream Analytics no-code editor, a drag-and-drop canvas for designing jobs for stream processing scenarios such as streaming ETL, ingestion, and data materialization, to general availability. The no-code editor is hosted by Azure Event Hubs, the company's big-data streaming platform and event ingestion service. Azure Stream Analytics is a service for managed real-time analytics. Its no-code editor allows users to develop a Stream Analytics job without writing a single line of code.
9. What pricing options are available for accessing the report?
Pricing options include single-user, multi-user, and enterprise licenses priced at USD 4750, USD 5250, and USD 8750 respectively.
10. Is the market size provided in terms of value or volume?
The market size is provided in terms of value, measured in Million.
11. Are there any specific market keywords associated with the report?
Yes, the market keyword associated with the report is "Event Stream Processing Industry," which aids in identifying and referencing the specific market segment covered.
12. How do I determine which pricing option suits my needs best?
The pricing options vary based on user requirements and access needs. Individual users may opt for single-user licenses, while businesses requiring broader access may choose multi-user or enterprise licenses for cost-effective access to the report.
13. Are there any additional resources or data provided in the Event Stream Processing Industry report?
While the report offers comprehensive insights, it's advisable to review the specific contents or supplementary materials provided to ascertain if additional resources or data are available.
14. How can I stay updated on further developments or reports in the Event Stream Processing Industry?
To stay informed about further developments, trends, and reports in the Event Stream Processing Industry, consider subscribing to industry newsletters, following relevant companies and organizations, or regularly checking reputable industry news sources and publications.
Methodology
Step 1 - Identification of Relevant Samples Size from Population Database


Step 2 - Approaches for Defining Global Market Size (Value, Volume* & Price*)

Note*: In applicable scenarios
Step 3 - Data Sources
Primary Research
- Web Analytics
- Survey Reports
- Research Institute
- Latest Research Reports
- Opinion Leaders
Secondary Research
- Annual Reports
- White Paper
- Latest Press Release
- Industry Association
- Paid Database
- Investor Presentations

Step 4 - Data Triangulation
Involves using different sources of information in order to increase the validity of a study
These sources are likely to be stakeholders in a program - participants, other researchers, program staff, other community members, and so on.
Then we put all data in single framework & apply various statistical tools to find out the dynamic on the market.
During the analysis stage, feedback from the stakeholder groups would be compared to determine areas of agreement as well as areas of divergence
