

Key Insights
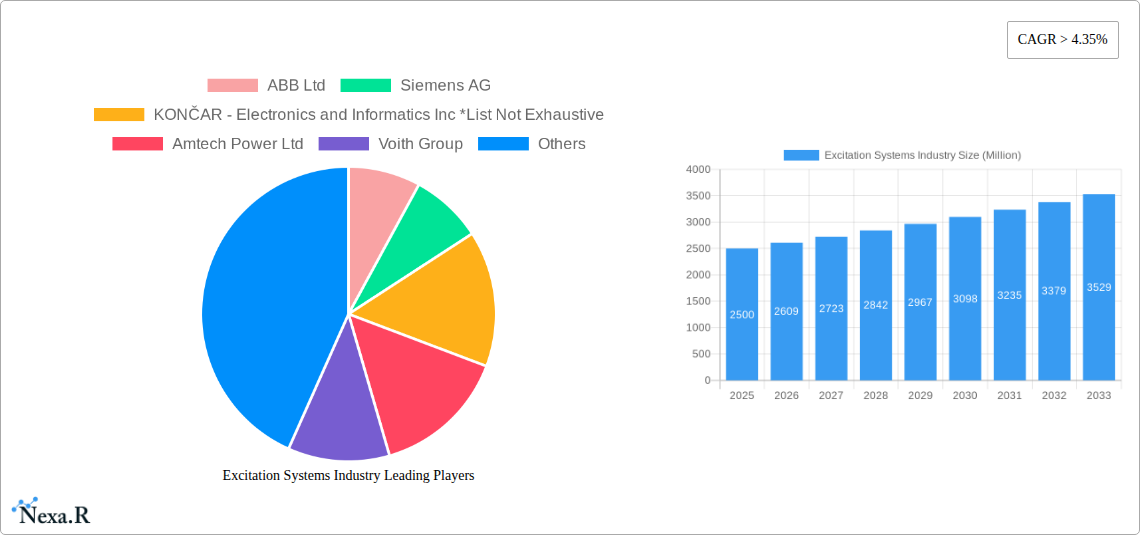
The global excitation systems market, valued at approximately $2.5 billion in 2025, is experiencing robust growth, projected to maintain a Compound Annual Growth Rate (CAGR) exceeding 4.35% through 2033. This expansion is fueled by several key drivers. The increasing demand for reliable and efficient power generation, particularly from renewable energy sources like wind and solar, necessitates sophisticated excitation systems to ensure grid stability and optimal performance. Furthermore, the growing adoption of smart grids and advanced power management systems necessitates higher-precision and responsive excitation control, stimulating market growth. Technological advancements, such as the development of more compact and energy-efficient brushless excitation systems, are also contributing to market expansion. The market segmentation reveals a significant share held by synchronous generators within the application segment, with static excitation systems dominating by type. Leading players, including ABB, Siemens, and General Electric, are actively investing in research and development, fostering innovation and competition within the sector. Regional growth is largely driven by robust infrastructure development in Asia Pacific and North America, while the European market continues to witness steady expansion driven by grid modernization efforts.
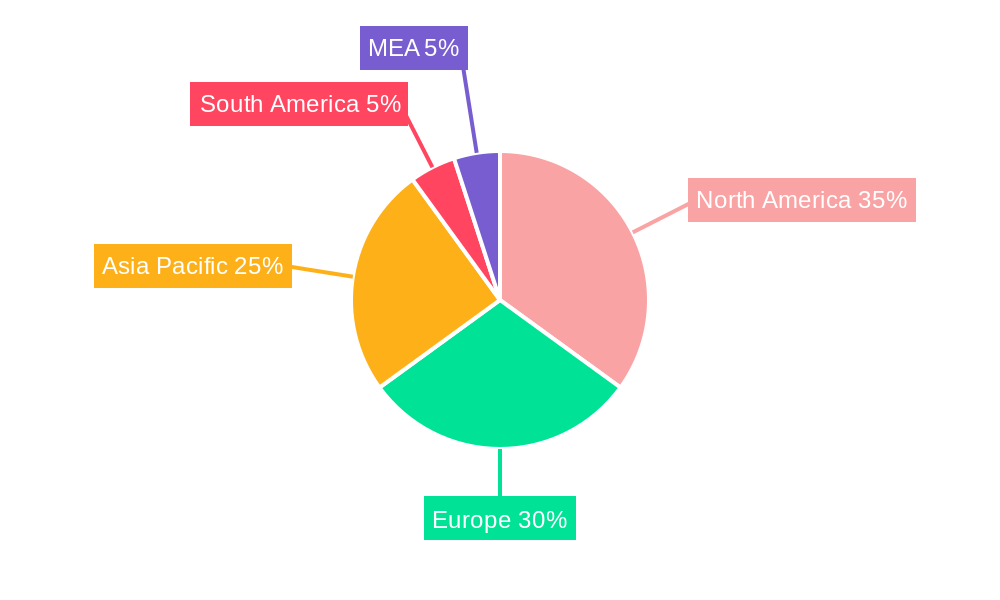
Growth in the excitation systems market is projected to be somewhat uneven across regions. While North America and Asia Pacific are expected to exhibit stronger growth due to investments in renewable energy infrastructure and grid modernization, Europe and other regions will see a more moderate pace of expansion. However, even in regions with slower growth, the increasing adoption of advanced technologies, such as digital control systems and predictive maintenance solutions, is expected to contribute positively to the market value. Despite these positive trends, challenges such as fluctuating raw material prices and the complexity of integrating excitation systems with increasingly sophisticated power generation and grid management systems could moderate market growth in the coming years. The competitive landscape is characterized by both established industry giants and specialized niche players, creating opportunities for differentiation through technological advancements and strategic partnerships.
Excitation Systems Industry Market Report: 2019-2033
This comprehensive report provides a detailed analysis of the global excitation systems market, encompassing historical data (2019-2024), current market estimations (2025), and future projections (2025-2033). We delve into market dynamics, growth trends, regional performance, and key players, offering invaluable insights for industry professionals, investors, and strategic decision-makers. The parent market is the power generation industry, while the child market is excitation systems within that sector. The market size is projected to be xx Million units in 2025.
Excitation Systems Industry Market Dynamics & Structure
This section analyzes the market concentration, technological innovation, regulatory landscape, competitive dynamics, and end-user demographics within the excitation systems industry. The market is moderately consolidated, with several key players holding significant market share. Technological innovation, particularly in digitalization and predictive maintenance, is a crucial driver. Stringent regulatory frameworks concerning grid stability and efficiency influence market growth. The competitive landscape includes established players and emerging companies, with M&A activity contributing to market consolidation.
- Market Concentration: Moderately consolidated, with top 5 players holding approximately xx% market share in 2025.
- Technological Innovation: Focus on digitalization, predictive maintenance, and improved efficiency driving growth.
- Regulatory Frameworks: Stringent regulations on grid stability and emission standards impacting market dynamics.
- Competitive Substitutes: Limited direct substitutes, but advancements in alternative energy sources pose indirect competition.
- End-User Demographics: Primarily power generation companies (hydropower, thermal, wind), industrial facilities, and grid operators.
- M&A Trends: Consolidation expected to continue with xx number of M&A deals anticipated over the forecast period.
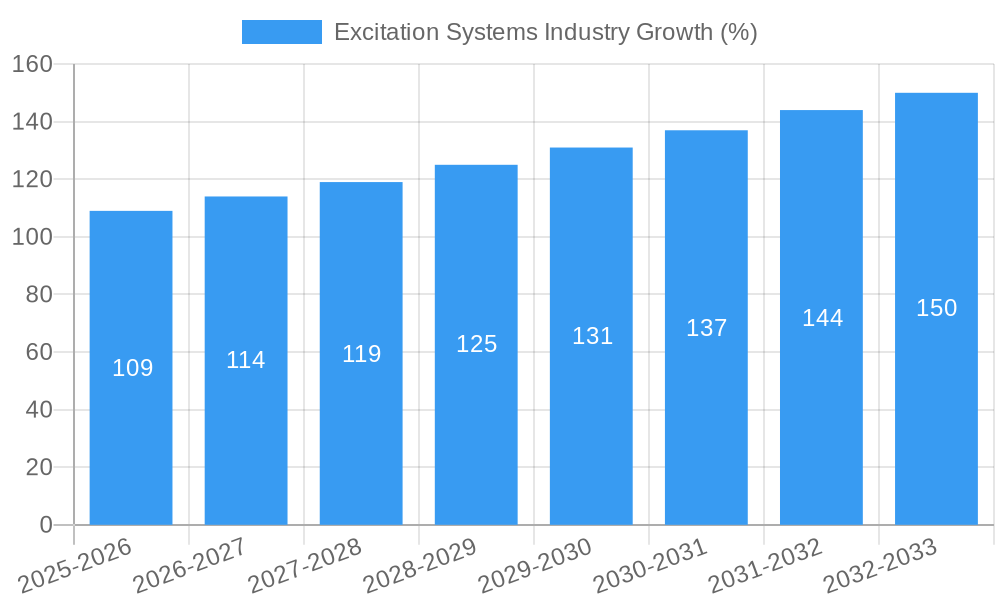
Excitation Systems Industry Growth Trends & Insights
The global excitation systems market is experiencing steady growth, driven by increasing demand for reliable and efficient power generation. The adoption of advanced technologies, including digital excitation systems, is accelerating market expansion. Consumer behavior shifts toward sustainable energy sources further contribute to market growth. The market is poised for significant expansion, with a projected CAGR of xx% during the forecast period (2025-2033). This growth is influenced by factors including rising energy demand globally, increased investment in renewable energy infrastructure, and the need for enhanced grid stability. Technological disruptions, such as the integration of smart grids and the adoption of AI-powered predictive maintenance systems, are further accelerating market growth. Market penetration of advanced excitation systems is expected to reach xx% by 2033.
Dominant Regions, Countries, or Segments in Excitation Systems Industry
The North American and European regions currently dominate the excitation systems market, driven by strong investments in renewable energy and well-established power grids. Within applications, synchronous generators represent a larger market segment compared to synchronous motors. Static excitation systems hold the largest market share due to their reliability and ease of maintenance. Key drivers include robust government support for renewable energy projects, and the increasing demand for reliable power supplies in industrialized nations.
- Key Drivers: Strong government policies supporting renewable energy, aging infrastructure upgrades, and demand for improved grid reliability.
- Dominant Regions: North America and Europe.
- Leading Segments: Synchronous Generators (xx Million units in 2025), Static Excitation Systems (xx Million units in 2025).
Excitation Systems Industry Product Landscape
The excitation systems market offers a diverse range of products, including static, brushless, and rotating systems, catering to various power generation applications. Recent innovations focus on enhanced efficiency, improved reliability, and advanced monitoring capabilities. Key selling propositions include reduced maintenance requirements, improved grid stability, and enhanced power quality. The integration of advanced control algorithms and digital communication protocols further enhances the performance of these systems.
Key Drivers, Barriers & Challenges in Excitation Systems Industry
Key Drivers:
- Increasing demand for reliable and efficient power generation.
- Growing adoption of renewable energy sources.
- Need for grid modernization and stabilization.
- Technological advancements in digital excitation systems.
Challenges and Restraints:
- High initial investment costs for advanced systems.
- Complexity of installation and integration.
- Potential supply chain disruptions impacting raw material availability.
- Stringent regulatory compliance requirements potentially increasing development costs. This could slow down market penetration by approximately xx% by 2030.
Emerging Opportunities in Excitation Systems Industry
- Growing demand for microgrids and distributed generation systems.
- Increasing adoption of smart grid technologies.
- Integration of renewable energy sources into power grids.
- Development of advanced control and monitoring systems.
Growth Accelerators in the Excitation Systems Industry
Technological breakthroughs in power electronics and digital control systems are driving significant growth. Strategic partnerships between excitation system manufacturers and power generation companies facilitate market expansion. Government incentives and policies promoting renewable energy investments are further accelerating market growth.
Key Players Shaping the Excitation Systems Industry Market
- ABB Ltd
- Siemens AG
- KONČAR - Electronics and Informatics Inc
- Amtech Power Ltd
- Voith Group
- VEO Oy
- Basler Electric Co
- General Electric Company
- TENEL SRO
- Andritz AG
Notable Milestones in Excitation Systems Industry Sector
- November 2020: ABB wins contract for excitation systems at Governador José Richa hydropower plant, showcasing predictive diagnostics capabilities.
- May 2020: ANDRITZ secures contract for modernization and digitalization of Sobradinho hydropower plant, including excitation system upgrades.
In-Depth Excitation Systems Industry Market Outlook
The future of the excitation systems market looks promising, driven by ongoing technological advancements, increasing demand for renewable energy, and the need for grid modernization. Strategic partnerships and market expansion initiatives will further contribute to market growth, creating significant opportunities for established players and new entrants alike. The market is anticipated to exhibit robust growth over the forecast period, presenting substantial prospects for investors and businesses operating within this dynamic sector.
Excitation Systems Industry Segmentation
-
1. Type
- 1.1. Static
- 1.2. Brushless
-
2. Application
- 2.1. Synchronous Generators
- 2.2. Synchronous Motors
Excitation Systems Industry Segmentation By Geography
- 1. North America
- 2. Asia Pacific
- 3. Europe
- 4. South America
- 5. Middle East and Africa
Excitation Systems Industry REPORT HIGHLIGHTS
| Aspects | Details |
|---|---|
| Study Period | 2019-2033 |
| Base Year | 2024 |
| Estimated Year | 2025 |
| Forecast Period | 2025-2033 |
| Historical Period | 2019-2024 |
| Growth Rate | CAGR of > 4.35% from 2019-2033 |
| Segmentation |
|
Table of Contents
- 1. Introduction
- 1.1. Research Scope
- 1.2. Market Segmentation
- 1.3. Research Methodology
- 1.4. Definitions and Assumptions
- 2. Executive Summary
- 2.1. Introduction
- 3. Market Dynamics
- 3.1. Introduction
- 3.2. Market Drivers
- 3.2.1. 4.; Growth of Utility-Scale Renewable Energy Plants4.; Rural Electrification Plans Worlwide
- 3.3. Market Restrains
- 3.3.1. 4.; Increasing Share of Distributed and Off-Grid Power Generation
- 3.4. Market Trends
- 3.4.1. The Brushless Type Segment is Expected to Record a Faster Growth Rate
- 4. Market Factor Analysis
- 4.1. Porters Five Forces
- 4.2. Supply/Value Chain
- 4.3. PESTEL analysis
- 4.4. Market Entropy
- 4.5. Patent/Trademark Analysis
- 5. Global Excitation Systems Industry Analysis, Insights and Forecast, 2019-2031
- 5.1. Market Analysis, Insights and Forecast - by Type
- 5.1.1. Static
- 5.1.2. Brushless
- 5.2. Market Analysis, Insights and Forecast - by Application
- 5.2.1. Synchronous Generators
- 5.2.2. Synchronous Motors
- 5.3. Market Analysis, Insights and Forecast - by Region
- 5.3.1. North America
- 5.3.2. Asia Pacific
- 5.3.3. Europe
- 5.3.4. South America
- 5.3.5. Middle East and Africa
- 5.1. Market Analysis, Insights and Forecast - by Type
- 6. North America Excitation Systems Industry Analysis, Insights and Forecast, 2019-2031
- 6.1. Market Analysis, Insights and Forecast - by Type
- 6.1.1. Static
- 6.1.2. Brushless
- 6.2. Market Analysis, Insights and Forecast - by Application
- 6.2.1. Synchronous Generators
- 6.2.2. Synchronous Motors
- 6.1. Market Analysis, Insights and Forecast - by Type
- 7. Asia Pacific Excitation Systems Industry Analysis, Insights and Forecast, 2019-2031
- 7.1. Market Analysis, Insights and Forecast - by Type
- 7.1.1. Static
- 7.1.2. Brushless
- 7.2. Market Analysis, Insights and Forecast - by Application
- 7.2.1. Synchronous Generators
- 7.2.2. Synchronous Motors
- 7.1. Market Analysis, Insights and Forecast - by Type
- 8. Europe Excitation Systems Industry Analysis, Insights and Forecast, 2019-2031
- 8.1. Market Analysis, Insights and Forecast - by Type
- 8.1.1. Static
- 8.1.2. Brushless
- 8.2. Market Analysis, Insights and Forecast - by Application
- 8.2.1. Synchronous Generators
- 8.2.2. Synchronous Motors
- 8.1. Market Analysis, Insights and Forecast - by Type
- 9. South America Excitation Systems Industry Analysis, Insights and Forecast, 2019-2031
- 9.1. Market Analysis, Insights and Forecast - by Type
- 9.1.1. Static
- 9.1.2. Brushless
- 9.2. Market Analysis, Insights and Forecast - by Application
- 9.2.1. Synchronous Generators
- 9.2.2. Synchronous Motors
- 9.1. Market Analysis, Insights and Forecast - by Type
- 10. Middle East and Africa Excitation Systems Industry Analysis, Insights and Forecast, 2019-2031
- 10.1. Market Analysis, Insights and Forecast - by Type
- 10.1.1. Static
- 10.1.2. Brushless
- 10.2. Market Analysis, Insights and Forecast - by Application
- 10.2.1. Synchronous Generators
- 10.2.2. Synchronous Motors
- 10.1. Market Analysis, Insights and Forecast - by Type
- 11. North America Excitation Systems Industry Analysis, Insights and Forecast, 2019-2031
- 11.1. Market Analysis, Insights and Forecast - By Country/Sub-region
- 11.1.1 United States
- 11.1.2 Canada
- 11.1.3 Mexico
- 12. Europe Excitation Systems Industry Analysis, Insights and Forecast, 2019-2031
- 12.1. Market Analysis, Insights and Forecast - By Country/Sub-region
- 12.1.1 Germany
- 12.1.2 United Kingdom
- 12.1.3 France
- 12.1.4 Spain
- 12.1.5 Italy
- 12.1.6 Spain
- 12.1.7 Belgium
- 12.1.8 Netherland
- 12.1.9 Nordics
- 12.1.10 Rest of Europe
- 13. Asia Pacific Excitation Systems Industry Analysis, Insights and Forecast, 2019-2031
- 13.1. Market Analysis, Insights and Forecast - By Country/Sub-region
- 13.1.1 China
- 13.1.2 Japan
- 13.1.3 India
- 13.1.4 South Korea
- 13.1.5 Southeast Asia
- 13.1.6 Australia
- 13.1.7 Indonesia
- 13.1.8 Phillipes
- 13.1.9 Singapore
- 13.1.10 Thailandc
- 13.1.11 Rest of Asia Pacific
- 14. South America Excitation Systems Industry Analysis, Insights and Forecast, 2019-2031
- 14.1. Market Analysis, Insights and Forecast - By Country/Sub-region
- 14.1.1 Brazil
- 14.1.2 Argentina
- 14.1.3 Peru
- 14.1.4 Chile
- 14.1.5 Colombia
- 14.1.6 Ecuador
- 14.1.7 Venezuela
- 14.1.8 Rest of South America
- 15. North America Excitation Systems Industry Analysis, Insights and Forecast, 2019-2031
- 15.1. Market Analysis, Insights and Forecast - By Country/Sub-region
- 15.1.1 United States
- 15.1.2 Canada
- 15.1.3 Mexico
- 16. MEA Excitation Systems Industry Analysis, Insights and Forecast, 2019-2031
- 16.1. Market Analysis, Insights and Forecast - By Country/Sub-region
- 16.1.1 United Arab Emirates
- 16.1.2 Saudi Arabia
- 16.1.3 South Africa
- 16.1.4 Rest of Middle East and Africa
- 17. Competitive Analysis
- 17.1. Global Market Share Analysis 2024
- 17.2. Company Profiles
- 17.2.1 ABB Ltd
- 17.2.1.1. Overview
- 17.2.1.2. Products
- 17.2.1.3. SWOT Analysis
- 17.2.1.4. Recent Developments
- 17.2.1.5. Financials (Based on Availability)
- 17.2.2 Siemens AG
- 17.2.2.1. Overview
- 17.2.2.2. Products
- 17.2.2.3. SWOT Analysis
- 17.2.2.4. Recent Developments
- 17.2.2.5. Financials (Based on Availability)
- 17.2.3 KONČAR - Electronics and Informatics Inc *List Not Exhaustive
- 17.2.3.1. Overview
- 17.2.3.2. Products
- 17.2.3.3. SWOT Analysis
- 17.2.3.4. Recent Developments
- 17.2.3.5. Financials (Based on Availability)
- 17.2.4 Amtech Power Ltd
- 17.2.4.1. Overview
- 17.2.4.2. Products
- 17.2.4.3. SWOT Analysis
- 17.2.4.4. Recent Developments
- 17.2.4.5. Financials (Based on Availability)
- 17.2.5 Voith Group
- 17.2.5.1. Overview
- 17.2.5.2. Products
- 17.2.5.3. SWOT Analysis
- 17.2.5.4. Recent Developments
- 17.2.5.5. Financials (Based on Availability)
- 17.2.6 VEO Oy
- 17.2.6.1. Overview
- 17.2.6.2. Products
- 17.2.6.3. SWOT Analysis
- 17.2.6.4. Recent Developments
- 17.2.6.5. Financials (Based on Availability)
- 17.2.7 Basler Electric Co
- 17.2.7.1. Overview
- 17.2.7.2. Products
- 17.2.7.3. SWOT Analysis
- 17.2.7.4. Recent Developments
- 17.2.7.5. Financials (Based on Availability)
- 17.2.8 General Electric Company
- 17.2.8.1. Overview
- 17.2.8.2. Products
- 17.2.8.3. SWOT Analysis
- 17.2.8.4. Recent Developments
- 17.2.8.5. Financials (Based on Availability)
- 17.2.9 TENEL SRO
- 17.2.9.1. Overview
- 17.2.9.2. Products
- 17.2.9.3. SWOT Analysis
- 17.2.9.4. Recent Developments
- 17.2.9.5. Financials (Based on Availability)
- 17.2.10 Andritz AG
- 17.2.10.1. Overview
- 17.2.10.2. Products
- 17.2.10.3. SWOT Analysis
- 17.2.10.4. Recent Developments
- 17.2.10.5. Financials (Based on Availability)
- 17.2.1 ABB Ltd
List of Figures
- Figure 1: Global Excitation Systems Industry Revenue Breakdown (Million, %) by Region 2024 & 2032
- Figure 2: North America Excitation Systems Industry Revenue (Million), by Country 2024 & 2032
- Figure 3: North America Excitation Systems Industry Revenue Share (%), by Country 2024 & 2032
- Figure 4: Europe Excitation Systems Industry Revenue (Million), by Country 2024 & 2032
- Figure 5: Europe Excitation Systems Industry Revenue Share (%), by Country 2024 & 2032
- Figure 6: Asia Pacific Excitation Systems Industry Revenue (Million), by Country 2024 & 2032
- Figure 7: Asia Pacific Excitation Systems Industry Revenue Share (%), by Country 2024 & 2032
- Figure 8: South America Excitation Systems Industry Revenue (Million), by Country 2024 & 2032
- Figure 9: South America Excitation Systems Industry Revenue Share (%), by Country 2024 & 2032
- Figure 10: North America Excitation Systems Industry Revenue (Million), by Country 2024 & 2032
- Figure 11: North America Excitation Systems Industry Revenue Share (%), by Country 2024 & 2032
- Figure 12: MEA Excitation Systems Industry Revenue (Million), by Country 2024 & 2032
- Figure 13: MEA Excitation Systems Industry Revenue Share (%), by Country 2024 & 2032
- Figure 14: North America Excitation Systems Industry Revenue (Million), by Type 2024 & 2032
- Figure 15: North America Excitation Systems Industry Revenue Share (%), by Type 2024 & 2032
- Figure 16: North America Excitation Systems Industry Revenue (Million), by Application 2024 & 2032
- Figure 17: North America Excitation Systems Industry Revenue Share (%), by Application 2024 & 2032
- Figure 18: North America Excitation Systems Industry Revenue (Million), by Country 2024 & 2032
- Figure 19: North America Excitation Systems Industry Revenue Share (%), by Country 2024 & 2032
- Figure 20: Asia Pacific Excitation Systems Industry Revenue (Million), by Type 2024 & 2032
- Figure 21: Asia Pacific Excitation Systems Industry Revenue Share (%), by Type 2024 & 2032
- Figure 22: Asia Pacific Excitation Systems Industry Revenue (Million), by Application 2024 & 2032
- Figure 23: Asia Pacific Excitation Systems Industry Revenue Share (%), by Application 2024 & 2032
- Figure 24: Asia Pacific Excitation Systems Industry Revenue (Million), by Country 2024 & 2032
- Figure 25: Asia Pacific Excitation Systems Industry Revenue Share (%), by Country 2024 & 2032
- Figure 26: Europe Excitation Systems Industry Revenue (Million), by Type 2024 & 2032
- Figure 27: Europe Excitation Systems Industry Revenue Share (%), by Type 2024 & 2032
- Figure 28: Europe Excitation Systems Industry Revenue (Million), by Application 2024 & 2032
- Figure 29: Europe Excitation Systems Industry Revenue Share (%), by Application 2024 & 2032
- Figure 30: Europe Excitation Systems Industry Revenue (Million), by Country 2024 & 2032
- Figure 31: Europe Excitation Systems Industry Revenue Share (%), by Country 2024 & 2032
- Figure 32: South America Excitation Systems Industry Revenue (Million), by Type 2024 & 2032
- Figure 33: South America Excitation Systems Industry Revenue Share (%), by Type 2024 & 2032
- Figure 34: South America Excitation Systems Industry Revenue (Million), by Application 2024 & 2032
- Figure 35: South America Excitation Systems Industry Revenue Share (%), by Application 2024 & 2032
- Figure 36: South America Excitation Systems Industry Revenue (Million), by Country 2024 & 2032
- Figure 37: South America Excitation Systems Industry Revenue Share (%), by Country 2024 & 2032
- Figure 38: Middle East and Africa Excitation Systems Industry Revenue (Million), by Type 2024 & 2032
- Figure 39: Middle East and Africa Excitation Systems Industry Revenue Share (%), by Type 2024 & 2032
- Figure 40: Middle East and Africa Excitation Systems Industry Revenue (Million), by Application 2024 & 2032
- Figure 41: Middle East and Africa Excitation Systems Industry Revenue Share (%), by Application 2024 & 2032
- Figure 42: Middle East and Africa Excitation Systems Industry Revenue (Million), by Country 2024 & 2032
- Figure 43: Middle East and Africa Excitation Systems Industry Revenue Share (%), by Country 2024 & 2032
List of Tables
- Table 1: Global Excitation Systems Industry Revenue Million Forecast, by Region 2019 & 2032
- Table 2: Global Excitation Systems Industry Revenue Million Forecast, by Type 2019 & 2032
- Table 3: Global Excitation Systems Industry Revenue Million Forecast, by Application 2019 & 2032
- Table 4: Global Excitation Systems Industry Revenue Million Forecast, by Region 2019 & 2032
- Table 5: Global Excitation Systems Industry Revenue Million Forecast, by Country 2019 & 2032
- Table 6: United States Excitation Systems Industry Revenue (Million) Forecast, by Application 2019 & 2032
- Table 7: Canada Excitation Systems Industry Revenue (Million) Forecast, by Application 2019 & 2032
- Table 8: Mexico Excitation Systems Industry Revenue (Million) Forecast, by Application 2019 & 2032
- Table 9: Global Excitation Systems Industry Revenue Million Forecast, by Country 2019 & 2032
- Table 10: Germany Excitation Systems Industry Revenue (Million) Forecast, by Application 2019 & 2032
- Table 11: United Kingdom Excitation Systems Industry Revenue (Million) Forecast, by Application 2019 & 2032
- Table 12: France Excitation Systems Industry Revenue (Million) Forecast, by Application 2019 & 2032
- Table 13: Spain Excitation Systems Industry Revenue (Million) Forecast, by Application 2019 & 2032
- Table 14: Italy Excitation Systems Industry Revenue (Million) Forecast, by Application 2019 & 2032
- Table 15: Spain Excitation Systems Industry Revenue (Million) Forecast, by Application 2019 & 2032
- Table 16: Belgium Excitation Systems Industry Revenue (Million) Forecast, by Application 2019 & 2032
- Table 17: Netherland Excitation Systems Industry Revenue (Million) Forecast, by Application 2019 & 2032
- Table 18: Nordics Excitation Systems Industry Revenue (Million) Forecast, by Application 2019 & 2032
- Table 19: Rest of Europe Excitation Systems Industry Revenue (Million) Forecast, by Application 2019 & 2032
- Table 20: Global Excitation Systems Industry Revenue Million Forecast, by Country 2019 & 2032
- Table 21: China Excitation Systems Industry Revenue (Million) Forecast, by Application 2019 & 2032
- Table 22: Japan Excitation Systems Industry Revenue (Million) Forecast, by Application 2019 & 2032
- Table 23: India Excitation Systems Industry Revenue (Million) Forecast, by Application 2019 & 2032
- Table 24: South Korea Excitation Systems Industry Revenue (Million) Forecast, by Application 2019 & 2032
- Table 25: Southeast Asia Excitation Systems Industry Revenue (Million) Forecast, by Application 2019 & 2032
- Table 26: Australia Excitation Systems Industry Revenue (Million) Forecast, by Application 2019 & 2032
- Table 27: Indonesia Excitation Systems Industry Revenue (Million) Forecast, by Application 2019 & 2032
- Table 28: Phillipes Excitation Systems Industry Revenue (Million) Forecast, by Application 2019 & 2032
- Table 29: Singapore Excitation Systems Industry Revenue (Million) Forecast, by Application 2019 & 2032
- Table 30: Thailandc Excitation Systems Industry Revenue (Million) Forecast, by Application 2019 & 2032
- Table 31: Rest of Asia Pacific Excitation Systems Industry Revenue (Million) Forecast, by Application 2019 & 2032
- Table 32: Global Excitation Systems Industry Revenue Million Forecast, by Country 2019 & 2032
- Table 33: Brazil Excitation Systems Industry Revenue (Million) Forecast, by Application 2019 & 2032
- Table 34: Argentina Excitation Systems Industry Revenue (Million) Forecast, by Application 2019 & 2032
- Table 35: Peru Excitation Systems Industry Revenue (Million) Forecast, by Application 2019 & 2032
- Table 36: Chile Excitation Systems Industry Revenue (Million) Forecast, by Application 2019 & 2032
- Table 37: Colombia Excitation Systems Industry Revenue (Million) Forecast, by Application 2019 & 2032
- Table 38: Ecuador Excitation Systems Industry Revenue (Million) Forecast, by Application 2019 & 2032
- Table 39: Venezuela Excitation Systems Industry Revenue (Million) Forecast, by Application 2019 & 2032
- Table 40: Rest of South America Excitation Systems Industry Revenue (Million) Forecast, by Application 2019 & 2032
- Table 41: Global Excitation Systems Industry Revenue Million Forecast, by Country 2019 & 2032
- Table 42: United States Excitation Systems Industry Revenue (Million) Forecast, by Application 2019 & 2032
- Table 43: Canada Excitation Systems Industry Revenue (Million) Forecast, by Application 2019 & 2032
- Table 44: Mexico Excitation Systems Industry Revenue (Million) Forecast, by Application 2019 & 2032
- Table 45: Global Excitation Systems Industry Revenue Million Forecast, by Country 2019 & 2032
- Table 46: United Arab Emirates Excitation Systems Industry Revenue (Million) Forecast, by Application 2019 & 2032
- Table 47: Saudi Arabia Excitation Systems Industry Revenue (Million) Forecast, by Application 2019 & 2032
- Table 48: South Africa Excitation Systems Industry Revenue (Million) Forecast, by Application 2019 & 2032
- Table 49: Rest of Middle East and Africa Excitation Systems Industry Revenue (Million) Forecast, by Application 2019 & 2032
- Table 50: Global Excitation Systems Industry Revenue Million Forecast, by Type 2019 & 2032
- Table 51: Global Excitation Systems Industry Revenue Million Forecast, by Application 2019 & 2032
- Table 52: Global Excitation Systems Industry Revenue Million Forecast, by Country 2019 & 2032
- Table 53: Global Excitation Systems Industry Revenue Million Forecast, by Type 2019 & 2032
- Table 54: Global Excitation Systems Industry Revenue Million Forecast, by Application 2019 & 2032
- Table 55: Global Excitation Systems Industry Revenue Million Forecast, by Country 2019 & 2032
- Table 56: Global Excitation Systems Industry Revenue Million Forecast, by Type 2019 & 2032
- Table 57: Global Excitation Systems Industry Revenue Million Forecast, by Application 2019 & 2032
- Table 58: Global Excitation Systems Industry Revenue Million Forecast, by Country 2019 & 2032
- Table 59: Global Excitation Systems Industry Revenue Million Forecast, by Type 2019 & 2032
- Table 60: Global Excitation Systems Industry Revenue Million Forecast, by Application 2019 & 2032
- Table 61: Global Excitation Systems Industry Revenue Million Forecast, by Country 2019 & 2032
- Table 62: Global Excitation Systems Industry Revenue Million Forecast, by Type 2019 & 2032
- Table 63: Global Excitation Systems Industry Revenue Million Forecast, by Application 2019 & 2032
- Table 64: Global Excitation Systems Industry Revenue Million Forecast, by Country 2019 & 2032
Frequently Asked Questions
1. What is the projected Compound Annual Growth Rate (CAGR) of the Excitation Systems Industry?
The projected CAGR is approximately > 4.35%.
2. Which companies are prominent players in the Excitation Systems Industry?
Key companies in the market include ABB Ltd, Siemens AG, KONČAR - Electronics and Informatics Inc *List Not Exhaustive, Amtech Power Ltd, Voith Group, VEO Oy, Basler Electric Co, General Electric Company, TENEL SRO, Andritz AG.
3. What are the main segments of the Excitation Systems Industry?
The market segments include Type, Application.
4. Can you provide details about the market size?
The market size is estimated to be USD XX Million as of 2022.
5. What are some drivers contributing to market growth?
4.; Growth of Utility-Scale Renewable Energy Plants4.; Rural Electrification Plans Worlwide.
6. What are the notable trends driving market growth?
The Brushless Type Segment is Expected to Record a Faster Growth Rate.
7. Are there any restraints impacting market growth?
4.; Increasing Share of Distributed and Off-Grid Power Generation.
8. Can you provide examples of recent developments in the market?
In November 2020, ABB won a contract to provide excitation systems and speed regulation for four generator units at the Governador José Richa hydropower plant on the Iguazu River. The solution helped Copel (Companhia Paranaense de Energia) enhance the visibility of its operational data using predictive diagnostics.
9. What pricing options are available for accessing the report?
Pricing options include single-user, multi-user, and enterprise licenses priced at USD 4750, USD 5250, and USD 8750 respectively.
10. Is the market size provided in terms of value or volume?
The market size is provided in terms of value, measured in Million.
11. Are there any specific market keywords associated with the report?
Yes, the market keyword associated with the report is "Excitation Systems Industry," which aids in identifying and referencing the specific market segment covered.
12. How do I determine which pricing option suits my needs best?
The pricing options vary based on user requirements and access needs. Individual users may opt for single-user licenses, while businesses requiring broader access may choose multi-user or enterprise licenses for cost-effective access to the report.
13. Are there any additional resources or data provided in the Excitation Systems Industry report?
While the report offers comprehensive insights, it's advisable to review the specific contents or supplementary materials provided to ascertain if additional resources or data are available.
14. How can I stay updated on further developments or reports in the Excitation Systems Industry?
To stay informed about further developments, trends, and reports in the Excitation Systems Industry, consider subscribing to industry newsletters, following relevant companies and organizations, or regularly checking reputable industry news sources and publications.
Methodology
Step 1 - Identification of Relevant Samples Size from Population Database


Step 2 - Approaches for Defining Global Market Size (Value, Volume* & Price*)

Note*: In applicable scenarios
Step 3 - Data Sources
Primary Research
- Web Analytics
- Survey Reports
- Research Institute
- Latest Research Reports
- Opinion Leaders
Secondary Research
- Annual Reports
- White Paper
- Latest Press Release
- Industry Association
- Paid Database
- Investor Presentations

Step 4 - Data Triangulation
Involves using different sources of information in order to increase the validity of a study
These sources are likely to be stakeholders in a program - participants, other researchers, program staff, other community members, and so on.
Then we put all data in single framework & apply various statistical tools to find out the dynamic on the market.
During the analysis stage, feedback from the stakeholder groups would be compared to determine areas of agreement as well as areas of divergence
