

Key Insights
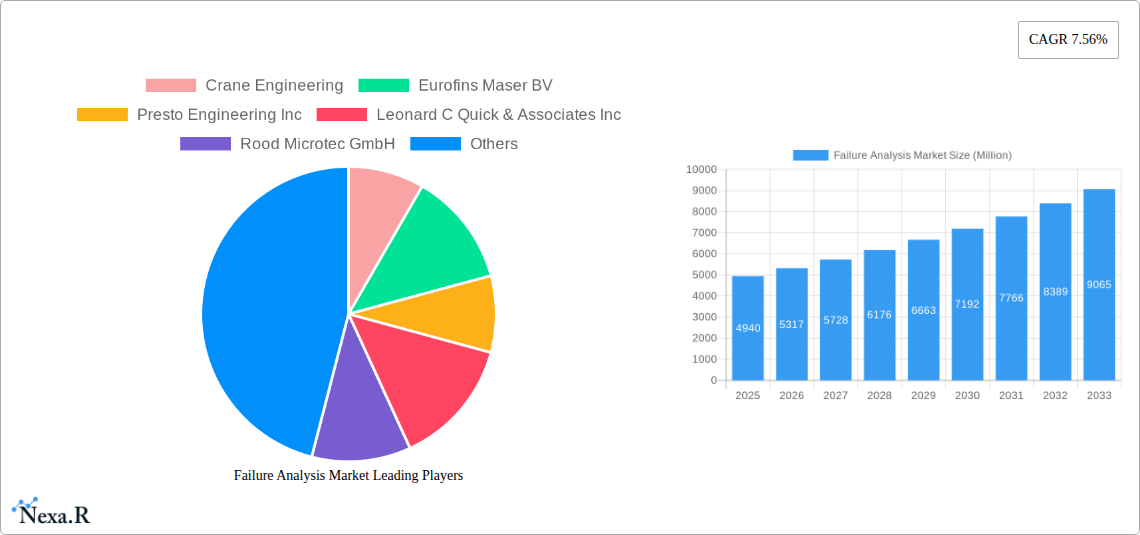
The Failure Analysis market, valued at $4.94 billion in 2025, is projected to experience robust growth, driven by the increasing complexity of advanced materials and components across various industries. The market's Compound Annual Growth Rate (CAGR) of 7.56% from 2025 to 2033 indicates a significant expansion, propelled by factors such as the rising demand for higher product reliability, stringent quality control measures, and the need for accelerated product development cycles. Key growth drivers include the burgeoning automotive and electronics sectors, which require sophisticated failure analysis techniques to ensure product safety and performance. The increasing adoption of advanced analytical technologies like Scanning Electron Microscopy (SEM), Focused Ion Beam (FIB), and Transmission Electron Microscopy (TEM) further fuels market expansion. While potential restraints include high equipment costs and the specialized skill sets required for operation and interpretation, the overall market outlook remains positive due to continuous technological advancements and the growing need for effective failure prevention and mitigation strategies.
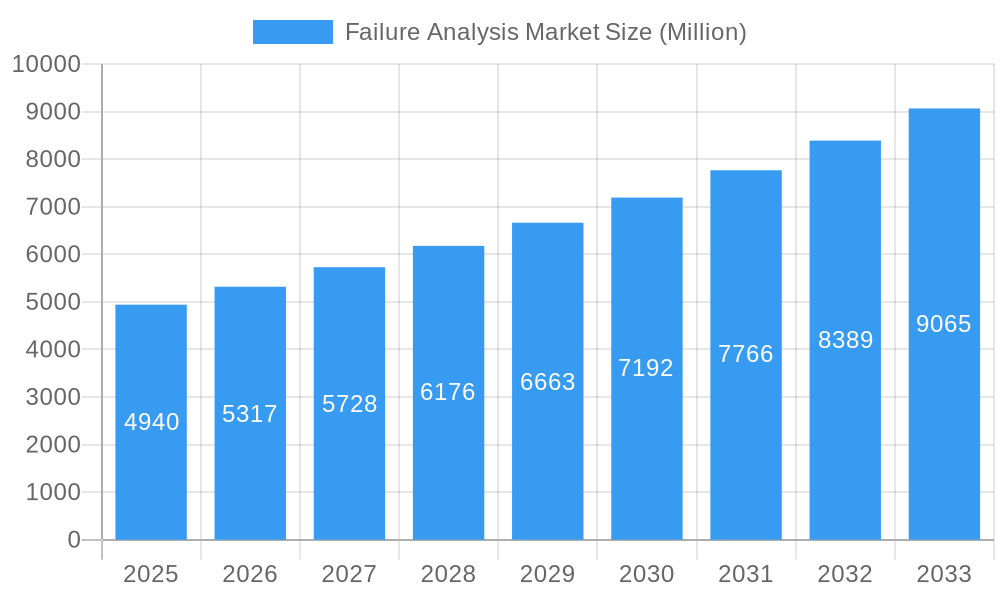
Failure Analysis Market Market Size (In Billion)
Specific segments within the market are also demonstrating strong growth trajectories. The SEM segment is expected to maintain its dominance due to its versatility and relatively lower cost compared to other techniques. However, the FIB and Dual Beam systems are anticipated to show higher growth rates, owing to their ability to perform advanced analyses, including three-dimensional imaging and material modification. Among end-user verticals, the electronics and semiconductor industries are driving the most significant demand, followed closely by the automotive sector, where ensuring vehicle safety and reliability is paramount. The ongoing integration of advanced materials in construction and defense applications is also expected to positively impact market growth, albeit at a slower pace. Geographic expansion is likely to be diverse, with North America and Europe maintaining a significant market share initially, while Asia is expected to witness substantial growth in the coming years, driven by rapid industrialization and technological advancements in the region.
Failure Analysis Market Company Market Share
This comprehensive report provides a detailed analysis of the Failure Analysis Market, encompassing market dynamics, growth trends, regional dominance, product landscape, key players, and future outlook. The study period covers 2019-2033, with 2025 as the base and estimated year. The report segments the market by equipment (Scanning Electron Microscope (SEM), Focused Ion Beam (FIB) System, Transmission Electron Microscope (TEM), Dual Beam System, Other Equipment), end-user vertical (Automotive, Oil and Gas, Defense, Construction, Manufacturing, Electronics and Semiconductors, Other End-user Verticals), and technology (Secondary ION Mass Spectrometry (SIMS), Energy Dispersive X-ray Spectroscopy (EDX), Chemical Mechanical Planarization (CMP), Scanning Probe Microscopy, Focused Ion Beam (FIB), Relative Ion Etching (RIE), Other Technologies).
Failure Analysis Market Market Dynamics & Structure
The Failure Analysis market, valued at xx million in 2025, is characterized by a moderately concentrated landscape. A few large players control a significant market share, while numerous smaller companies cater to niche segments. Technological innovation, particularly advancements in microscopy and spectroscopy, is a key driver. Stringent regulatory frameworks, especially concerning safety and environmental compliance, influence market growth. Competitive product substitutes, such as non-destructive testing methods, exert pressure on market penetration. End-user demographics, particularly the growth in the electronics and semiconductor industries, positively impact market demand. Mergers and acquisitions (M&A) activity is moderate, with a few notable deals shaping the competitive landscape in recent years. The total value of M&A deals in the last five years is estimated at xx million.
- Market Concentration: Moderately concentrated, with top 5 players holding approximately xx% market share.
- Technological Innovation: Advancements in SEM, FIB, and spectroscopy technologies are driving market growth.
- Regulatory Framework: Compliance regulations impact market dynamics and drive demand for high-quality analysis services.
- Competitive Substitutes: Non-destructive testing methods present competitive challenges.
- End-User Demographics: Growth in electronics and automotive sectors fuels demand.
- M&A Trends: Moderate M&A activity, consolidating market share and driving innovation.
Failure Analysis Market Growth Trends & Insights
The Failure Analysis market exhibits robust growth, driven by increasing demand across diverse sectors. The market size is projected to reach xx million by 2033, exhibiting a Compound Annual Growth Rate (CAGR) of xx% during the forecast period (2025-2033). This growth is fueled by factors such as the rising complexity of products, the increasing need for quality control and assurance, and the growing adoption of advanced materials in various industries. The market penetration rate for failure analysis services is increasing steadily, especially in emerging economies. Technological disruptions, including the development of high-throughput failure analysis techniques and automation, further accelerate market expansion. Consumer behavior shifts toward enhanced product reliability and durability also drive demand.
Dominant Regions, Countries, or Segments in Failure Analysis Market
The North American market holds a dominant position, accounting for xx% of the global market share in 2025, primarily due to the presence of major players, robust R&D activities, and high adoption rates across diverse sectors. Within North America, the United States is the leading country. Europe follows closely behind with xx% market share. Asia-Pacific presents significant growth potential due to rapid industrialization and increasing demand from the electronics and automotive sectors.
- By Equipment: The Scanning Electron Microscope (SEM) segment dominates due to its versatility and widespread use.
- By End-user Vertical: The Electronics and Semiconductor segment exhibits the highest growth, driven by the miniaturization of electronic components and stringent quality standards.
- By Technology: EDX and SIMS technologies are widely adopted, reflecting their effectiveness in material characterization.
- Key Drivers: Stringent quality control standards, increasing product complexity, and advancements in materials science.
Failure Analysis Market Product Landscape
The failure analysis market offers a diverse range of services and equipment. Advancements focus on higher resolution imaging, faster analysis times, and automation to improve efficiency and reduce costs. Unique selling propositions include specialized expertise in specific materials or industries, and the provision of comprehensive reporting and consulting services. Technological advancements continually improve the accuracy, precision, and speed of failure analysis, enabling companies to improve product quality and reduce time to market.
Key Drivers, Barriers & Challenges in Failure Analysis Market
Key Drivers:
- The increasing complexity of products across various industries necessitates advanced failure analysis techniques.
- Stringent quality and safety standards push for comprehensive failure analysis to improve product reliability.
- Rapid technological advancements in materials and manufacturing processes continually necessitate improved failure analysis methods.
Challenges and Restraints:
- High equipment costs and specialized expertise limit market accessibility for smaller companies. This barrier represents approximately xx% of the total market restraint.
- The complex nature of failure analysis often leads to longer turnaround times, hindering quick responses to product failures.
- Competition from alternative testing methods and the presence of a few dominant players can create pricing pressures.
Emerging Opportunities in Failure Analysis Market
- Untapped markets in developing economies present significant growth potential as industrialization accelerates.
- The rising demand for green technologies creates opportunities for failure analysis of renewable energy components.
- Increasing focus on data analytics allows for predictive maintenance and improved failure analysis workflows, thereby creating new business models.
Growth Accelerators in the Failure Analysis Market Industry
Strategic partnerships between equipment manufacturers and service providers enhance market penetration. Technological breakthroughs, particularly in AI-powered image analysis and automation, will streamline processes and accelerate analysis. Market expansion into developing economies, supported by favorable government policies and increasing investments in infrastructure, represents a significant growth opportunity.
Key Players Shaping the Failure Analysis Market Market
- Crane Engineering
- Eurofins Maser BV
- Presto Engineering Inc
- Leonard C Quick & Associates Inc
- Rood Microtec GmbH
- McDowell Owens Engineering Inc
- NanoScope Services Ltd
- Exponent Inc
- CoreTest Technologies
- Eurofins EAG Laboratories
- Materials Testing
- TUV SUD
Notable Milestones in Failure Analysis Market Sector
- June 2024: The Atlanta water main break highlights the critical need for robust infrastructure failure analysis and preventative maintenance. This event spurred significant investment in the field.
- April 2024: The 14ACMOS project showcases the crucial role of high-precision failure analysis in advancing semiconductor technology. This illustrates the growing need for sub-nanometer level analysis capabilities.
In-Depth Failure Analysis Market Market Outlook
The Failure Analysis market is poised for continued growth, driven by technological advancements, increasing product complexity, and stringent quality control requirements. Strategic opportunities exist in expanding into emerging markets, developing innovative analysis techniques, and leveraging data analytics to improve efficiency and decision-making. The market's future potential is significant, promising substantial returns for companies that invest in advanced technologies and specialized expertise.
Failure Analysis Market Segmentation
-
1. Technology
- 1.1. Secondary ION Mass Spectrometry (SIMS)
- 1.2. Energy Dispersive X-ray Spectroscopy (EDX)
- 1.3. Chemical Mechanical Planarization (CMP)
- 1.4. Scanning Probe Microscopy
- 1.5. Focused Ion Beam (FIB)
- 1.6. Relative Ion Etching (RIE)
- 1.7. Other Technologies
-
2. Equipment
- 2.1. Scanning Electron Microscope (SEM)
- 2.2. Focused Ion Beam (FIB) System
- 2.3. Transmission Electron Microscope (TEM)
- 2.4. Dual Beam System
- 2.5. Other Equipment
-
3. End-user Vertical
- 3.1. Automotive
- 3.2. Oil and Gas
- 3.3. Defense
- 3.4. Construction
- 3.5. Manufacturing
- 3.6. Electronics and Semiconductors
- 3.7. Other End-user Verticals
Failure Analysis Market Segmentation By Geography
- 1. North America
- 2. Europe
- 3. Asia
- 4. Australia and New Zealand
- 5. Latin America
- 6. Middle East and Africa
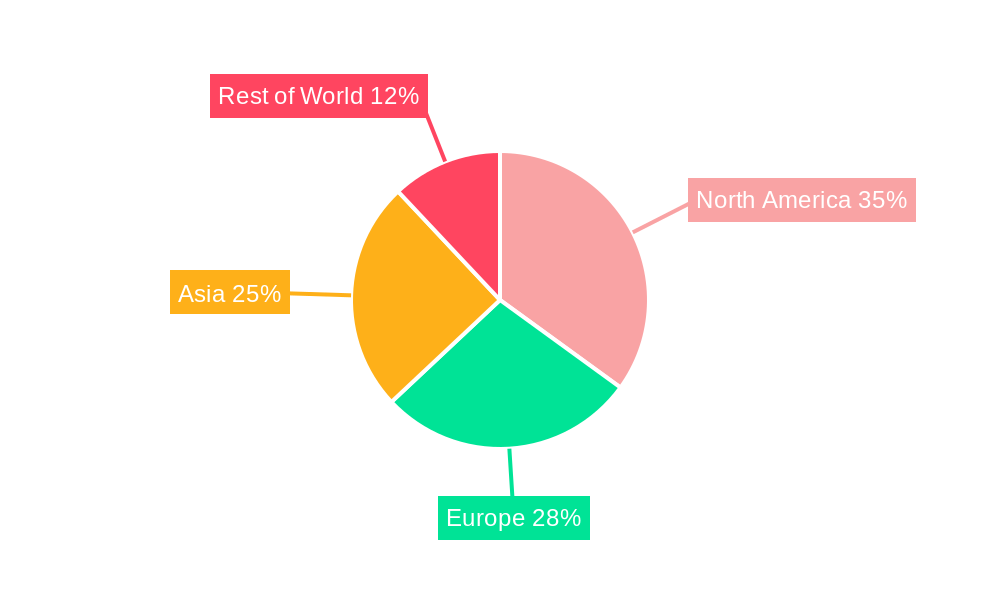
Failure Analysis Market Regional Market Share
Geographic Coverage of Failure Analysis Market
Failure Analysis Market REPORT HIGHLIGHTS
| Aspects | Details |
|---|---|
| Study Period | 2020-2034 |
| Base Year | 2025 |
| Estimated Year | 2026 |
| Forecast Period | 2026-2034 |
| Historical Period | 2020-2025 |
| Growth Rate | CAGR of 7.56% from 2020-2034 |
| Segmentation |
|
Table of Contents
- 1. Introduction
- 1.1. Research Scope
- 1.2. Market Segmentation
- 1.3. Research Objective
- 1.4. Definitions and Assumptions
- 2. Executive Summary
- 2.1. Market Snapshot
- 3. Market Dynamics
- 3.1. Market Drivers
- 3.2. Market Restrains
- 3.3. Market Trends
- 3.4. Market Opportunities
- 4. Market Factor Analysis
- 4.1. Porters Five Forces
- 4.1.1. Bargaining Power of Suppliers
- 4.1.2. Bargaining Power of Buyers
- 4.1.3. Threat of New Entrants
- 4.1.4. Threat of Substitutes
- 4.1.5. Competitive Rivalry
- 4.2. PESTEL analysis
- 4.3. BCG Analysis
- 4.3.1. Stars (High Growth, High Market Share)
- 4.3.2. Cash Cows (Low Growth, High Market Share)
- 4.3.3. Question Mark (High Growth, Low Market Share)
- 4.3.4. Dogs (Low Growth, Low Market Share)
- 4.4. Ansoff Matrix Analysis
- 4.5. Supply Chain Analysis
- 4.6. Regulatory Landscape
- 4.7. Current Market Potential and Opportunity Assessment (TAM–SAM–SOM Framework)
- 4.8. NRP Analyst Note
- 4.1. Porters Five Forces
- 5. Market Analysis, Insights and Forecast 2021-2033
- 5.1. Market Analysis, Insights and Forecast - by Technology
- 5.1.1. Secondary ION Mass Spectrometry (SIMS)
- 5.1.2. Energy Dispersive X-ray Spectroscopy (EDX)
- 5.1.3. Chemical Mechanical Planarization (CMP)
- 5.1.4. Scanning Probe Microscopy
- 5.1.5. Focused Ion Beam (FIB)
- 5.1.6. Relative Ion Etching (RIE)
- 5.1.7. Other Technologies
- 5.2. Market Analysis, Insights and Forecast - by Equipment
- 5.2.1. Scanning Electron Microscope (SEM)
- 5.2.2. Focused Ion Beam (FIB) System
- 5.2.3. Transmission Electron Microscope (TEM)
- 5.2.4. Dual Beam System
- 5.2.5. Other Equipment
- 5.3. Market Analysis, Insights and Forecast - by End-user Vertical
- 5.3.1. Automotive
- 5.3.2. Oil and Gas
- 5.3.3. Defense
- 5.3.4. Construction
- 5.3.5. Manufacturing
- 5.3.6. Electronics and Semiconductors
- 5.3.7. Other End-user Verticals
- 5.4. Market Analysis, Insights and Forecast - by Region
- 5.4.1. North America
- 5.4.2. Europe
- 5.4.3. Asia
- 5.4.4. Australia and New Zealand
- 5.4.5. Latin America
- 5.4.6. Middle East and Africa
- 5.1. Market Analysis, Insights and Forecast - by Technology
- 6. Global Failure Analysis Market Analysis, Insights and Forecast, 2021-2033
- 6.1. Market Analysis, Insights and Forecast - by Technology
- 6.1.1. Secondary ION Mass Spectrometry (SIMS)
- 6.1.2. Energy Dispersive X-ray Spectroscopy (EDX)
- 6.1.3. Chemical Mechanical Planarization (CMP)
- 6.1.4. Scanning Probe Microscopy
- 6.1.5. Focused Ion Beam (FIB)
- 6.1.6. Relative Ion Etching (RIE)
- 6.1.7. Other Technologies
- 6.2. Market Analysis, Insights and Forecast - by Equipment
- 6.2.1. Scanning Electron Microscope (SEM)
- 6.2.2. Focused Ion Beam (FIB) System
- 6.2.3. Transmission Electron Microscope (TEM)
- 6.2.4. Dual Beam System
- 6.2.5. Other Equipment
- 6.3. Market Analysis, Insights and Forecast - by End-user Vertical
- 6.3.1. Automotive
- 6.3.2. Oil and Gas
- 6.3.3. Defense
- 6.3.4. Construction
- 6.3.5. Manufacturing
- 6.3.6. Electronics and Semiconductors
- 6.3.7. Other End-user Verticals
- 6.1. Market Analysis, Insights and Forecast - by Technology
- 7. North America Failure Analysis Market Analysis, Insights and Forecast, 2020-2032
- 7.1. Market Analysis, Insights and Forecast - by Technology
- 7.1.1. Secondary ION Mass Spectrometry (SIMS)
- 7.1.2. Energy Dispersive X-ray Spectroscopy (EDX)
- 7.1.3. Chemical Mechanical Planarization (CMP)
- 7.1.4. Scanning Probe Microscopy
- 7.1.5. Focused Ion Beam (FIB)
- 7.1.6. Relative Ion Etching (RIE)
- 7.1.7. Other Technologies
- 7.2. Market Analysis, Insights and Forecast - by Equipment
- 7.2.1. Scanning Electron Microscope (SEM)
- 7.2.2. Focused Ion Beam (FIB) System
- 7.2.3. Transmission Electron Microscope (TEM)
- 7.2.4. Dual Beam System
- 7.2.5. Other Equipment
- 7.3. Market Analysis, Insights and Forecast - by End-user Vertical
- 7.3.1. Automotive
- 7.3.2. Oil and Gas
- 7.3.3. Defense
- 7.3.4. Construction
- 7.3.5. Manufacturing
- 7.3.6. Electronics and Semiconductors
- 7.3.7. Other End-user Verticals
- 7.1. Market Analysis, Insights and Forecast - by Technology
- 8. Europe Failure Analysis Market Analysis, Insights and Forecast, 2020-2032
- 8.1. Market Analysis, Insights and Forecast - by Technology
- 8.1.1. Secondary ION Mass Spectrometry (SIMS)
- 8.1.2. Energy Dispersive X-ray Spectroscopy (EDX)
- 8.1.3. Chemical Mechanical Planarization (CMP)
- 8.1.4. Scanning Probe Microscopy
- 8.1.5. Focused Ion Beam (FIB)
- 8.1.6. Relative Ion Etching (RIE)
- 8.1.7. Other Technologies
- 8.2. Market Analysis, Insights and Forecast - by Equipment
- 8.2.1. Scanning Electron Microscope (SEM)
- 8.2.2. Focused Ion Beam (FIB) System
- 8.2.3. Transmission Electron Microscope (TEM)
- 8.2.4. Dual Beam System
- 8.2.5. Other Equipment
- 8.3. Market Analysis, Insights and Forecast - by End-user Vertical
- 8.3.1. Automotive
- 8.3.2. Oil and Gas
- 8.3.3. Defense
- 8.3.4. Construction
- 8.3.5. Manufacturing
- 8.3.6. Electronics and Semiconductors
- 8.3.7. Other End-user Verticals
- 8.1. Market Analysis, Insights and Forecast - by Technology
- 9. Asia Failure Analysis Market Analysis, Insights and Forecast, 2020-2032
- 9.1. Market Analysis, Insights and Forecast - by Technology
- 9.1.1. Secondary ION Mass Spectrometry (SIMS)
- 9.1.2. Energy Dispersive X-ray Spectroscopy (EDX)
- 9.1.3. Chemical Mechanical Planarization (CMP)
- 9.1.4. Scanning Probe Microscopy
- 9.1.5. Focused Ion Beam (FIB)
- 9.1.6. Relative Ion Etching (RIE)
- 9.1.7. Other Technologies
- 9.2. Market Analysis, Insights and Forecast - by Equipment
- 9.2.1. Scanning Electron Microscope (SEM)
- 9.2.2. Focused Ion Beam (FIB) System
- 9.2.3. Transmission Electron Microscope (TEM)
- 9.2.4. Dual Beam System
- 9.2.5. Other Equipment
- 9.3. Market Analysis, Insights and Forecast - by End-user Vertical
- 9.3.1. Automotive
- 9.3.2. Oil and Gas
- 9.3.3. Defense
- 9.3.4. Construction
- 9.3.5. Manufacturing
- 9.3.6. Electronics and Semiconductors
- 9.3.7. Other End-user Verticals
- 9.1. Market Analysis, Insights and Forecast - by Technology
- 10. Australia and New Zealand Failure Analysis Market Analysis, Insights and Forecast, 2020-2032
- 10.1. Market Analysis, Insights and Forecast - by Technology
- 10.1.1. Secondary ION Mass Spectrometry (SIMS)
- 10.1.2. Energy Dispersive X-ray Spectroscopy (EDX)
- 10.1.3. Chemical Mechanical Planarization (CMP)
- 10.1.4. Scanning Probe Microscopy
- 10.1.5. Focused Ion Beam (FIB)
- 10.1.6. Relative Ion Etching (RIE)
- 10.1.7. Other Technologies
- 10.2. Market Analysis, Insights and Forecast - by Equipment
- 10.2.1. Scanning Electron Microscope (SEM)
- 10.2.2. Focused Ion Beam (FIB) System
- 10.2.3. Transmission Electron Microscope (TEM)
- 10.2.4. Dual Beam System
- 10.2.5. Other Equipment
- 10.3. Market Analysis, Insights and Forecast - by End-user Vertical
- 10.3.1. Automotive
- 10.3.2. Oil and Gas
- 10.3.3. Defense
- 10.3.4. Construction
- 10.3.5. Manufacturing
- 10.3.6. Electronics and Semiconductors
- 10.3.7. Other End-user Verticals
- 10.1. Market Analysis, Insights and Forecast - by Technology
- 11. Latin America Failure Analysis Market Analysis, Insights and Forecast, 2020-2032
- 11.1. Market Analysis, Insights and Forecast - by Technology
- 11.1.1. Secondary ION Mass Spectrometry (SIMS)
- 11.1.2. Energy Dispersive X-ray Spectroscopy (EDX)
- 11.1.3. Chemical Mechanical Planarization (CMP)
- 11.1.4. Scanning Probe Microscopy
- 11.1.5. Focused Ion Beam (FIB)
- 11.1.6. Relative Ion Etching (RIE)
- 11.1.7. Other Technologies
- 11.2. Market Analysis, Insights and Forecast - by Equipment
- 11.2.1. Scanning Electron Microscope (SEM)
- 11.2.2. Focused Ion Beam (FIB) System
- 11.2.3. Transmission Electron Microscope (TEM)
- 11.2.4. Dual Beam System
- 11.2.5. Other Equipment
- 11.3. Market Analysis, Insights and Forecast - by End-user Vertical
- 11.3.1. Automotive
- 11.3.2. Oil and Gas
- 11.3.3. Defense
- 11.3.4. Construction
- 11.3.5. Manufacturing
- 11.3.6. Electronics and Semiconductors
- 11.3.7. Other End-user Verticals
- 11.1. Market Analysis, Insights and Forecast - by Technology
- 12. Middle East and Africa Failure Analysis Market Analysis, Insights and Forecast, 2020-2032
- 12.1. Market Analysis, Insights and Forecast - by Technology
- 12.1.1. Secondary ION Mass Spectrometry (SIMS)
- 12.1.2. Energy Dispersive X-ray Spectroscopy (EDX)
- 12.1.3. Chemical Mechanical Planarization (CMP)
- 12.1.4. Scanning Probe Microscopy
- 12.1.5. Focused Ion Beam (FIB)
- 12.1.6. Relative Ion Etching (RIE)
- 12.1.7. Other Technologies
- 12.2. Market Analysis, Insights and Forecast - by Equipment
- 12.2.1. Scanning Electron Microscope (SEM)
- 12.2.2. Focused Ion Beam (FIB) System
- 12.2.3. Transmission Electron Microscope (TEM)
- 12.2.4. Dual Beam System
- 12.2.5. Other Equipment
- 12.3. Market Analysis, Insights and Forecast - by End-user Vertical
- 12.3.1. Automotive
- 12.3.2. Oil and Gas
- 12.3.3. Defense
- 12.3.4. Construction
- 12.3.5. Manufacturing
- 12.3.6. Electronics and Semiconductors
- 12.3.7. Other End-user Verticals
- 12.1. Market Analysis, Insights and Forecast - by Technology
- 13. Competitive Analysis
- 13.1. Company Profiles
- 13.1.1 Crane Engineering
- 13.1.1.1. Company Overview
- 13.1.1.2. Products
- 13.1.1.3. Company Financials
- 13.1.1.4. SWOT Analysis
- 13.1.2 Eurofins Maser BV
- 13.1.2.1. Company Overview
- 13.1.2.2. Products
- 13.1.2.3. Company Financials
- 13.1.2.4. SWOT Analysis
- 13.1.3 Presto Engineering Inc
- 13.1.3.1. Company Overview
- 13.1.3.2. Products
- 13.1.3.3. Company Financials
- 13.1.3.4. SWOT Analysis
- 13.1.4 Leonard C Quick & Associates Inc
- 13.1.4.1. Company Overview
- 13.1.4.2. Products
- 13.1.4.3. Company Financials
- 13.1.4.4. SWOT Analysis
- 13.1.5 Rood Microtec GmbH
- 13.1.5.1. Company Overview
- 13.1.5.2. Products
- 13.1.5.3. Company Financials
- 13.1.5.4. SWOT Analysis
- 13.1.6 McDowell Owens Engineering Inc
- 13.1.6.1. Company Overview
- 13.1.6.2. Products
- 13.1.6.3. Company Financials
- 13.1.6.4. SWOT Analysis
- 13.1.7 NanoScope Services Ltd
- 13.1.7.1. Company Overview
- 13.1.7.2. Products
- 13.1.7.3. Company Financials
- 13.1.7.4. SWOT Analysis
- 13.1.8 Exponent Inc
- 13.1.8.1. Company Overview
- 13.1.8.2. Products
- 13.1.8.3. Company Financials
- 13.1.8.4. SWOT Analysis
- 13.1.9 CoreTest Technologies
- 13.1.9.1. Company Overview
- 13.1.9.2. Products
- 13.1.9.3. Company Financials
- 13.1.9.4. SWOT Analysis
- 13.1.10 Eurofins EAG Laboratories
- 13.1.10.1. Company Overview
- 13.1.10.2. Products
- 13.1.10.3. Company Financials
- 13.1.10.4. SWOT Analysis
- 13.1.11 Materials Testing
- 13.1.11.1. Company Overview
- 13.1.11.2. Products
- 13.1.11.3. Company Financials
- 13.1.11.4. SWOT Analysis
- 13.1.12 TUV SUD
- 13.1.12.1. Company Overview
- 13.1.12.2. Products
- 13.1.12.3. Company Financials
- 13.1.12.4. SWOT Analysis
- 13.1.1 Crane Engineering
- 13.2. Market Entropy
- 13.2.1 Company's Key Areas Served
- 13.2.2 Recent Developments
- 13.3. Company Market Share Analysis 2025
- 13.3.1 Top 5 Companies Market Share Analysis
- 13.3.2 Top 3 Companies Market Share Analysis
- 13.4. List of Potential Customers
- 14. Research Methodology
List of Figures
- Figure 1: Global Failure Analysis Market Revenue Breakdown (Million, %) by Region 2025 & 2033
- Figure 2: North America Failure Analysis Market Revenue (Million), by Technology 2025 & 2033
- Figure 3: North America Failure Analysis Market Revenue Share (%), by Technology 2025 & 2033
- Figure 4: North America Failure Analysis Market Revenue (Million), by Equipment 2025 & 2033
- Figure 5: North America Failure Analysis Market Revenue Share (%), by Equipment 2025 & 2033
- Figure 6: North America Failure Analysis Market Revenue (Million), by End-user Vertical 2025 & 2033
- Figure 7: North America Failure Analysis Market Revenue Share (%), by End-user Vertical 2025 & 2033
- Figure 8: North America Failure Analysis Market Revenue (Million), by Country 2025 & 2033
- Figure 9: North America Failure Analysis Market Revenue Share (%), by Country 2025 & 2033
- Figure 10: Europe Failure Analysis Market Revenue (Million), by Technology 2025 & 2033
- Figure 11: Europe Failure Analysis Market Revenue Share (%), by Technology 2025 & 2033
- Figure 12: Europe Failure Analysis Market Revenue (Million), by Equipment 2025 & 2033
- Figure 13: Europe Failure Analysis Market Revenue Share (%), by Equipment 2025 & 2033
- Figure 14: Europe Failure Analysis Market Revenue (Million), by End-user Vertical 2025 & 2033
- Figure 15: Europe Failure Analysis Market Revenue Share (%), by End-user Vertical 2025 & 2033
- Figure 16: Europe Failure Analysis Market Revenue (Million), by Country 2025 & 2033
- Figure 17: Europe Failure Analysis Market Revenue Share (%), by Country 2025 & 2033
- Figure 18: Asia Failure Analysis Market Revenue (Million), by Technology 2025 & 2033
- Figure 19: Asia Failure Analysis Market Revenue Share (%), by Technology 2025 & 2033
- Figure 20: Asia Failure Analysis Market Revenue (Million), by Equipment 2025 & 2033
- Figure 21: Asia Failure Analysis Market Revenue Share (%), by Equipment 2025 & 2033
- Figure 22: Asia Failure Analysis Market Revenue (Million), by End-user Vertical 2025 & 2033
- Figure 23: Asia Failure Analysis Market Revenue Share (%), by End-user Vertical 2025 & 2033
- Figure 24: Asia Failure Analysis Market Revenue (Million), by Country 2025 & 2033
- Figure 25: Asia Failure Analysis Market Revenue Share (%), by Country 2025 & 2033
- Figure 26: Australia and New Zealand Failure Analysis Market Revenue (Million), by Technology 2025 & 2033
- Figure 27: Australia and New Zealand Failure Analysis Market Revenue Share (%), by Technology 2025 & 2033
- Figure 28: Australia and New Zealand Failure Analysis Market Revenue (Million), by Equipment 2025 & 2033
- Figure 29: Australia and New Zealand Failure Analysis Market Revenue Share (%), by Equipment 2025 & 2033
- Figure 30: Australia and New Zealand Failure Analysis Market Revenue (Million), by End-user Vertical 2025 & 2033
- Figure 31: Australia and New Zealand Failure Analysis Market Revenue Share (%), by End-user Vertical 2025 & 2033
- Figure 32: Australia and New Zealand Failure Analysis Market Revenue (Million), by Country 2025 & 2033
- Figure 33: Australia and New Zealand Failure Analysis Market Revenue Share (%), by Country 2025 & 2033
- Figure 34: Latin America Failure Analysis Market Revenue (Million), by Technology 2025 & 2033
- Figure 35: Latin America Failure Analysis Market Revenue Share (%), by Technology 2025 & 2033
- Figure 36: Latin America Failure Analysis Market Revenue (Million), by Equipment 2025 & 2033
- Figure 37: Latin America Failure Analysis Market Revenue Share (%), by Equipment 2025 & 2033
- Figure 38: Latin America Failure Analysis Market Revenue (Million), by End-user Vertical 2025 & 2033
- Figure 39: Latin America Failure Analysis Market Revenue Share (%), by End-user Vertical 2025 & 2033
- Figure 40: Latin America Failure Analysis Market Revenue (Million), by Country 2025 & 2033
- Figure 41: Latin America Failure Analysis Market Revenue Share (%), by Country 2025 & 2033
- Figure 42: Middle East and Africa Failure Analysis Market Revenue (Million), by Technology 2025 & 2033
- Figure 43: Middle East and Africa Failure Analysis Market Revenue Share (%), by Technology 2025 & 2033
- Figure 44: Middle East and Africa Failure Analysis Market Revenue (Million), by Equipment 2025 & 2033
- Figure 45: Middle East and Africa Failure Analysis Market Revenue Share (%), by Equipment 2025 & 2033
- Figure 46: Middle East and Africa Failure Analysis Market Revenue (Million), by End-user Vertical 2025 & 2033
- Figure 47: Middle East and Africa Failure Analysis Market Revenue Share (%), by End-user Vertical 2025 & 2033
- Figure 48: Middle East and Africa Failure Analysis Market Revenue (Million), by Country 2025 & 2033
- Figure 49: Middle East and Africa Failure Analysis Market Revenue Share (%), by Country 2025 & 2033
List of Tables
- Table 1: Global Failure Analysis Market Revenue Million Forecast, by Technology 2020 & 2033
- Table 2: Global Failure Analysis Market Revenue Million Forecast, by Equipment 2020 & 2033
- Table 3: Global Failure Analysis Market Revenue Million Forecast, by End-user Vertical 2020 & 2033
- Table 4: Global Failure Analysis Market Revenue Million Forecast, by Region 2020 & 2033
- Table 5: Global Failure Analysis Market Revenue Million Forecast, by Technology 2020 & 2033
- Table 6: Global Failure Analysis Market Revenue Million Forecast, by Equipment 2020 & 2033
- Table 7: Global Failure Analysis Market Revenue Million Forecast, by End-user Vertical 2020 & 2033
- Table 8: Global Failure Analysis Market Revenue Million Forecast, by Country 2020 & 2033
- Table 9: Global Failure Analysis Market Revenue Million Forecast, by Technology 2020 & 2033
- Table 10: Global Failure Analysis Market Revenue Million Forecast, by Equipment 2020 & 2033
- Table 11: Global Failure Analysis Market Revenue Million Forecast, by End-user Vertical 2020 & 2033
- Table 12: Global Failure Analysis Market Revenue Million Forecast, by Country 2020 & 2033
- Table 13: Global Failure Analysis Market Revenue Million Forecast, by Technology 2020 & 2033
- Table 14: Global Failure Analysis Market Revenue Million Forecast, by Equipment 2020 & 2033
- Table 15: Global Failure Analysis Market Revenue Million Forecast, by End-user Vertical 2020 & 2033
- Table 16: Global Failure Analysis Market Revenue Million Forecast, by Country 2020 & 2033
- Table 17: Global Failure Analysis Market Revenue Million Forecast, by Technology 2020 & 2033
- Table 18: Global Failure Analysis Market Revenue Million Forecast, by Equipment 2020 & 2033
- Table 19: Global Failure Analysis Market Revenue Million Forecast, by End-user Vertical 2020 & 2033
- Table 20: Global Failure Analysis Market Revenue Million Forecast, by Country 2020 & 2033
- Table 21: Global Failure Analysis Market Revenue Million Forecast, by Technology 2020 & 2033
- Table 22: Global Failure Analysis Market Revenue Million Forecast, by Equipment 2020 & 2033
- Table 23: Global Failure Analysis Market Revenue Million Forecast, by End-user Vertical 2020 & 2033
- Table 24: Global Failure Analysis Market Revenue Million Forecast, by Country 2020 & 2033
- Table 25: Global Failure Analysis Market Revenue Million Forecast, by Technology 2020 & 2033
- Table 26: Global Failure Analysis Market Revenue Million Forecast, by Equipment 2020 & 2033
- Table 27: Global Failure Analysis Market Revenue Million Forecast, by End-user Vertical 2020 & 2033
- Table 28: Global Failure Analysis Market Revenue Million Forecast, by Country 2020 & 2033
Frequently Asked Questions
1. What is the projected Compound Annual Growth Rate (CAGR) of the Failure Analysis Market?
The projected CAGR is approximately 7.56%.
2. Which companies are prominent players in the Failure Analysis Market?
Key companies in the market include Crane Engineering, Eurofins Maser BV, Presto Engineering Inc, Leonard C Quick & Associates Inc, Rood Microtec GmbH, McDowell Owens Engineering Inc, NanoScope Services Ltd, Exponent Inc, CoreTest Technologies, Eurofins EAG Laboratories, Materials Testing, TUV SUD.
3. What are the main segments of the Failure Analysis Market?
The market segments include Technology, Equipment, End-user Vertical.
4. Can you provide details about the market size?
The market size is estimated to be USD 4.94 Million as of 2022.
5. What are some drivers contributing to market growth?
Ageing Infrastructure and Increasing Need for Maintenance; Technological Advancements Drive the Market Growth; Innovation in Materials. Design. and Production Methods.
6. What are the notable trends driving market growth?
Growth in the Construction Sector Boosting the Demand for Furniture Products.
7. Are there any restraints impacting market growth?
High Equipment Cost Challenge the Market.
8. Can you provide examples of recent developments in the market?
June 2024 - The Atlanta government announced a State of Emergency due to a water main break affecting businesses, schools, and hospitals in the midtown and downtown areas. This incident highlights the broader issue of aging infrastructure across North America. With over 2,600 miles of pipes, some of which are more than 100 years old, Atlanta faces major challenges in maintaining and upgrading its water network.
9. What pricing options are available for accessing the report?
Pricing options include single-user, multi-user, and enterprise licenses priced at USD 4750, USD 5250, and USD 8750 respectively.
10. Is the market size provided in terms of value or volume?
The market size is provided in terms of value, measured in Million.
11. Are there any specific market keywords associated with the report?
Yes, the market keyword associated with the report is "Failure Analysis Market," which aids in identifying and referencing the specific market segment covered.
12. How do I determine which pricing option suits my needs best?
The pricing options vary based on user requirements and access needs. Individual users may opt for single-user licenses, while businesses requiring broader access may choose multi-user or enterprise licenses for cost-effective access to the report.
13. Are there any additional resources or data provided in the Failure Analysis Market report?
While the report offers comprehensive insights, it's advisable to review the specific contents or supplementary materials provided to ascertain if additional resources or data are available.
14. How can I stay updated on further developments or reports in the Failure Analysis Market?
To stay informed about further developments, trends, and reports in the Failure Analysis Market, consider subscribing to industry newsletters, following relevant companies and organizations, or regularly checking reputable industry news sources and publications.
Methodology
Step 1 - Identification of Relevant Samples Size from Population Database


Step 2 - Approaches for Defining Global Market Size (Value, Volume* & Price*)

Note*: In applicable scenarios
Step 3 - Data Sources
Primary Research
- Web Analytics
- Survey Reports
- Research Institute
- Latest Research Reports
- Opinion Leaders
Secondary Research
- Annual Reports
- White Paper
- Latest Press Release
- Industry Association
- Paid Database
- Investor Presentations

Step 4 - Data Triangulation
Involves using different sources of information in order to increase the validity of a study
These sources are likely to be stakeholders in a program - participants, other researchers, program staff, other community members, and so on.
Then we put all data in single framework & apply various statistical tools to find out the dynamic on the market.
During the analysis stage, feedback from the stakeholder groups would be compared to determine areas of agreement as well as areas of divergence