

Key Insights
The fiber optic pressure sensor market is experiencing robust growth, driven by the increasing demand for accurate and reliable pressure measurement across diverse industries. The market's 9.92% CAGR from 2019-2024 indicates a significant upward trajectory, projected to continue into the forecast period (2025-2033). Key drivers include the inherent advantages of fiber optic technology, such as high accuracy, resistance to electromagnetic interference, and suitability for harsh environments. The automotive sector, particularly in advanced driver-assistance systems (ADAS) and electric vehicles, is a major growth engine, along with the burgeoning healthcare sector (e.g., minimally invasive surgical tools and medical implants) and the oil and gas industry (e.g., downhole pressure monitoring). Technological advancements, like the development of more compact and cost-effective sensors based on Fabry-Perot and Fiber Bragg Grating technologies, are further fueling market expansion. Wireless fiber optic pressure sensors are gaining traction due to their ease of installation and maintenance in remote or hazardous locations. However, the relatively high initial cost of fiber optic sensors compared to traditional technologies remains a restraint, though this is likely to diminish with technological advancements and economies of scale. The market is segmented by type (wired, wireless), technology (Fabry-Perot, Fiber Bragg Grating, intensity-based, others), and application (automotive, consumer electronics, healthcare, industrial, oil & gas, petrochemicals, others), providing various opportunities for specialized sensor development and deployment. Regional growth is expected to be diverse, with North America and Asia-Pacific anticipated to lead the market due to significant investments in infrastructure and technological advancements in these regions.
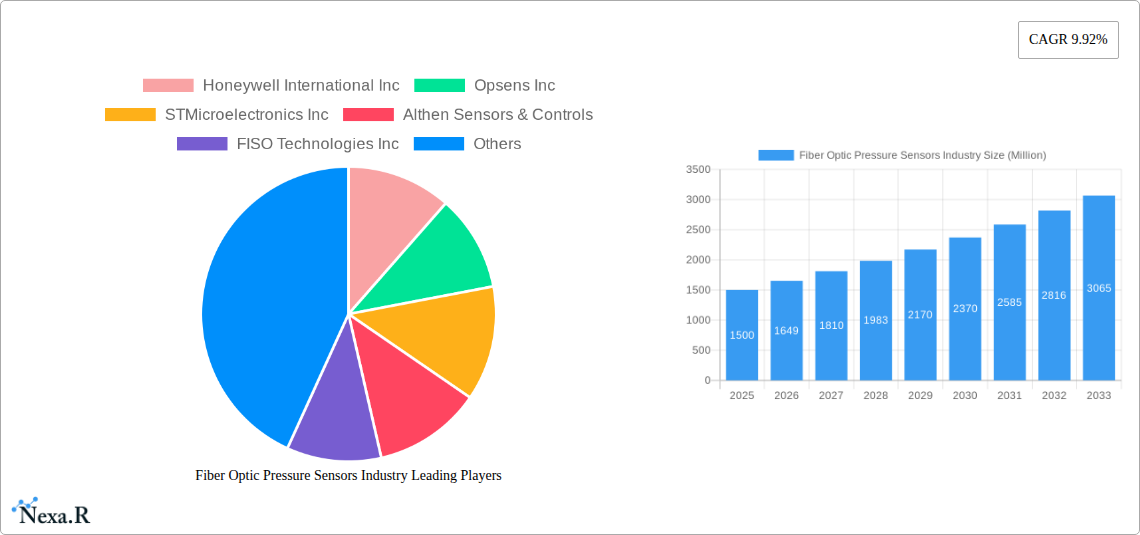
The competitive landscape is dynamic, with established players like Honeywell, STMicroelectronics, and Bosch alongside specialized sensor manufacturers like FISO Technologies and Opsens. The strategic partnerships and acquisitions among these companies, coupled with ongoing research and development efforts, are shaping future market trends. The continued adoption of Industry 4.0 principles and the increasing demand for precise pressure sensing in diverse industrial applications will further fuel market growth in the coming years. The shift towards more efficient and reliable pressure measurement systems across various industries is creating a significant demand for high-performance fiber optic pressure sensors. The ability of these sensors to operate reliably in challenging environments makes them attractive to sectors such as oil and gas exploration and industrial automation, accelerating the market's expansion.
Fiber Optic Pressure Sensors Industry Market Report: 2019-2033
This comprehensive report provides an in-depth analysis of the Fiber Optic Pressure Sensors industry, encompassing market dynamics, growth trends, regional analysis, competitive landscape, and future outlook. The study period spans from 2019 to 2033, with 2025 serving as the base and estimated year. The report is crucial for industry professionals, investors, and strategic decision-makers seeking a clear understanding of this rapidly evolving market. The total market size in 2025 is estimated at xx Million units.
Fiber Optic Pressure Sensors Industry Market Dynamics & Structure
The Fiber Optic Pressure Sensors market is characterized by moderate concentration, with key players like Honeywell International Inc, Honeywell International Inc, Opsens Inc, STMicroelectronics Inc, and others holding significant market share. Technological innovation, particularly in Fabry-Perot and Fiber Bragg Grating technologies, is a primary growth driver. Stringent safety regulations in industries like oil and gas influence market dynamics. Competitive substitutes, such as traditional pressure sensors, pose a challenge, but the inherent advantages of fiber optic sensors (e.g., high accuracy, durability) continue to fuel market expansion. The market witnessed xx M&A deals during the historical period (2019-2024), signaling consolidation and strategic expansion. End-user demographics show a strong preference for fiber optic sensors across diverse industries due to their superior performance and reliability.
- Market Concentration: Moderately Concentrated (xx% market share held by top 5 players in 2025)
- Technological Innovation Drivers: Fabry-Perot, Fiber Bragg Grating advancements.
- Regulatory Frameworks: Stringent safety standards in Oil & Gas, Healthcare impacting adoption.
- Competitive Product Substitutes: Traditional pressure sensors (impact quantified as xx% market share loss annually).
- End-User Demographics: Growing demand across diverse sectors (Automotive, Industrial, Healthcare).
- M&A Trends: xx M&A deals during 2019-2024, indicating consolidation and strategic growth.
Fiber Optic Pressure Sensors Industry Growth Trends & Insights
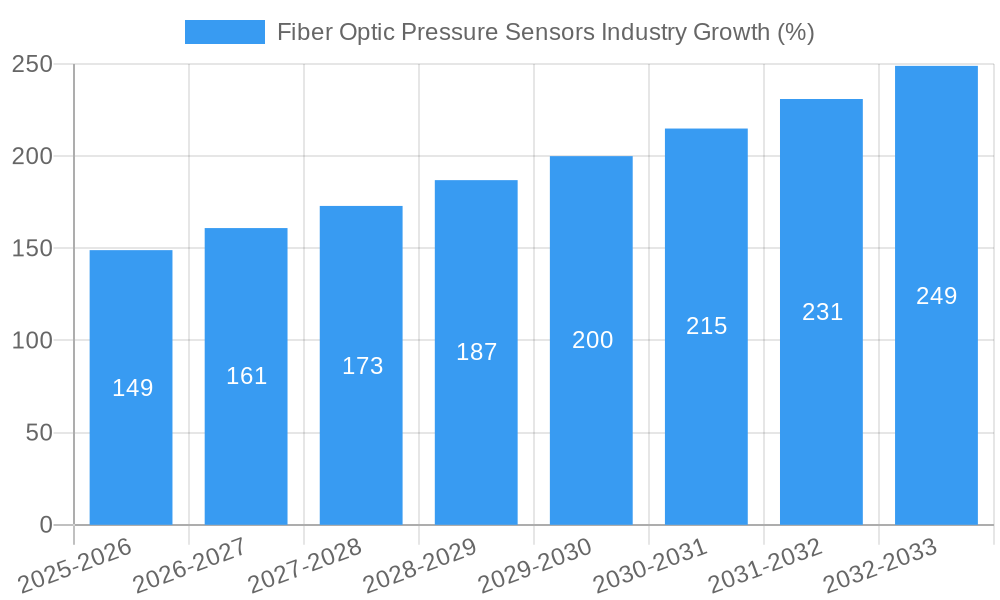
The Fiber Optic Pressure Sensors market exhibited a CAGR of xx% during the historical period (2019-2024) and is projected to maintain a CAGR of xx% during the forecast period (2025-2033), reaching xx Million units by 2033. This growth is driven by increasing demand from automotive, healthcare, and industrial sectors. The adoption rate of fiber optic pressure sensors is accelerating due to their enhanced performance and reliability. Technological advancements, such as miniaturization and improved sensor integration, are further stimulating market expansion. Consumer behavior shifts toward higher precision and safety in various applications fuel market growth. The market penetration of Fiber Bragg Grating (FBG) sensors is expected to increase significantly due to their versatility and superior performance in harsh environments.
Dominant Regions, Countries, or Segments in Fiber Optic Pressure Sensors Industry
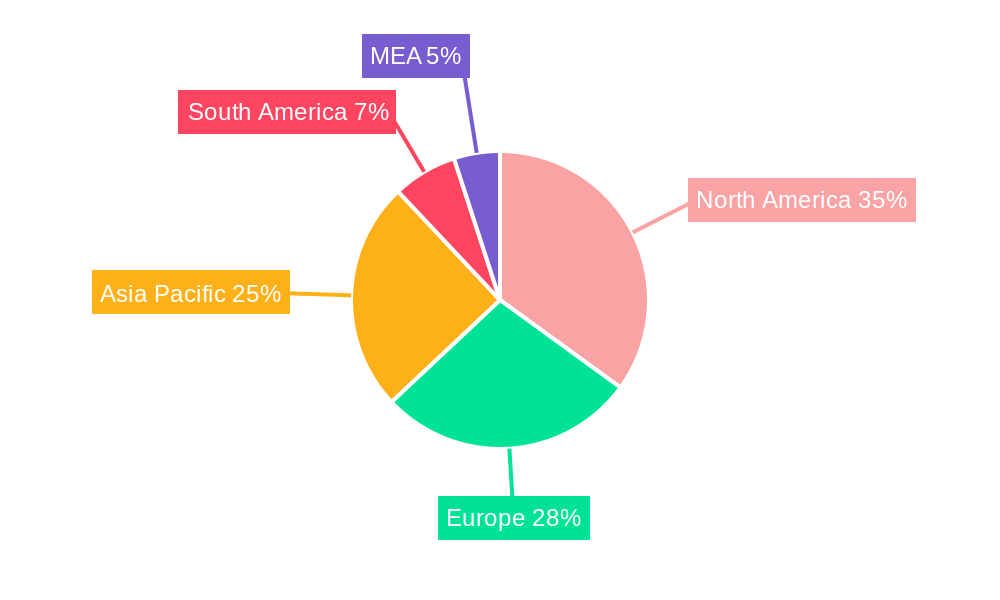
North America currently holds the largest market share, driven by strong technological advancements and high adoption rates in the automotive and industrial sectors. Europe follows closely, with significant contributions from Germany and France. Asia Pacific exhibits the highest growth potential, fueled by expanding industrialization and increasing investments in infrastructure.
By Type: The Wired segment dominates the market in 2025 (xx% market share), owing to its reliability and established infrastructure, but the Wireless segment is projected to witness faster growth (xx% CAGR) driven by the increasing demand for remote monitoring and data acquisition.
By Technology: Fiber Bragg Grating (FBG) technology holds the largest share, showcasing its superior performance and versatility (xx% market share in 2025). Fabry-Perot sensors are expected to witness significant growth due to their cost-effectiveness in specific applications.
By Application: The Automotive sector currently leads the application segment, driven by increased demand for advanced driver-assistance systems (ADAS) and improved vehicle safety features (xx% market share in 2025). The Healthcare and Industrial sectors are also significant contributors, displaying considerable growth potential.
- Key Drivers (North America): Strong technological innovation, high industrial adoption rates, favorable regulatory environment.
- Key Drivers (Europe): Well-established industrial base, stringent safety regulations driving adoption.
- Key Drivers (Asia Pacific): Rapid industrialization, infrastructure development, increasing investments.
Fiber Optic Pressure Sensors Industry Product Landscape
Fiber optic pressure sensors are increasingly characterized by miniaturization, enhanced accuracy, improved durability, and wider operating temperature ranges. Product innovations focus on integrating advanced signal processing capabilities and incorporating wireless communication protocols. The unique selling propositions emphasize superior accuracy, long-term reliability, and resistance to electromagnetic interference. These advancements address the growing need for precise and reliable pressure measurements across various applications.
Key Drivers, Barriers & Challenges in Fiber Optic Pressure Sensors Industry
Key Drivers: Increasing demand from diverse industries (Automotive, Healthcare, Industrial), advancements in fiber optic technology (miniaturization, improved sensitivity), stringent safety regulations driving adoption in critical applications.
Key Challenges: High initial investment costs, limited availability of skilled workforce, competition from established pressure sensor technologies, supply chain disruptions leading to production delays (quantified impact: xx% production shortfall in 2024).
Emerging Opportunities in Fiber Optic Pressure Sensors Industry
Untapped markets in developing economies, especially in the infrastructure and industrial automation sectors, present significant growth opportunities. Innovative applications in smart cities, wearable healthcare devices, and environmental monitoring are gaining traction. Evolving consumer preferences for improved safety and enhanced performance in various applications further drive market expansion.
Growth Accelerators in the Fiber Optic Pressure Sensors Industry Industry
Technological breakthroughs in miniaturization and sensor integration are critical growth catalysts. Strategic partnerships between sensor manufacturers and system integrators facilitate broader market penetration. Expansion into high-growth sectors such as renewable energy, aerospace, and oil and gas will propel future growth.
Key Players Shaping the Fiber Optic Pressure Sensors Industry Market
- Honeywell International Inc
- Opsens Inc
- STMicroelectronics Inc
- Althen Sensors & Controls
- FISO Technologies Inc
- NXP Semiconductors
- Omron Corporation
- Robert Bosch GmbH
- Infineon Technologies Inc
- Panasonic Corporation
Notable Milestones in Fiber Optic Pressure Sensors Industry Sector
- 2020: Honeywell launched a new series of high-accuracy fiber optic pressure sensors for automotive applications.
- 2022: STMicroelectronics partnered with a major automotive OEM to develop a customized fiber optic pressure sensor solution for ADAS systems.
- 2023: A significant merger between two key players in the FBG sensor technology sector (Further details unavailable - xx).
In-Depth Fiber Optic Pressure Sensors Industry Market Outlook
The Fiber Optic Pressure Sensors market is poised for sustained growth over the forecast period, driven by technological advancements, expanding applications, and increasing demand from various sectors. Strategic partnerships and investments in research and development will further propel market expansion. The focus on miniaturization, improved sensor integration, and wireless communication capabilities presents significant opportunities for players to capitalize on this growing market. The shift toward smart and connected systems will create further demand for high-precision and reliable pressure sensing solutions.
Fiber Optic Pressure Sensors Industry Segmentation
-
1. Type
- 1.1. Wired
- 1.2. Wireless
-
2. Technology
- 2.1. Fabry-Perot
- 2.2. Fiber Bragg Grating
- 2.3. Intensity-based
- 2.4. Other Technologies
-
3. Application
- 3.1. Automotive
- 3.2. Consumer Electronics
- 3.3. Healthcare
- 3.4. Industrial
- 3.5. Oil and Gas
- 3.6. Petrochemical
- 3.7. Other Applications
Fiber Optic Pressure Sensors Industry Segmentation By Geography
-
1. North America
- 1.1. United States
- 1.2. Canada
-
2. Europe
- 2.1. United Kingdom
- 2.2. Germany
- 2.3. France
- 2.4. Russia
- 2.5. Rest of Europe
-
3. Asia Pacific
- 3.1. China
- 3.2. India
- 3.3. Japan
- 3.4. Rest of Asia Pacific
-
4. Rest of the World
- 4.1. Latin America
- 4.2. Middle East
Fiber Optic Pressure Sensors Industry REPORT HIGHLIGHTS
| Aspects | Details |
|---|---|
| Study Period | 2019-2033 |
| Base Year | 2024 |
| Estimated Year | 2025 |
| Forecast Period | 2025-2033 |
| Historical Period | 2019-2024 |
| Growth Rate | CAGR of 9.92% from 2019-2033 |
| Segmentation |
|
Table of Contents
- 1. Introduction
- 1.1. Research Scope
- 1.2. Market Segmentation
- 1.3. Research Methodology
- 1.4. Definitions and Assumptions
- 2. Executive Summary
- 2.1. Introduction
- 3. Market Dynamics
- 3.1. Introduction
- 3.2. Market Drivers
- 3.2.1. ; Rapid Technological Advancements; Easy Deployment with High Stability
- 3.3. Market Restrains
- 3.3.1. ; High Cost of Product in Biomedical Applications
- 3.4. Market Trends
- 3.4.1. Oil and Gas Expected to Drive the Market Growth
- 4. Market Factor Analysis
- 4.1. Porters Five Forces
- 4.2. Supply/Value Chain
- 4.3. PESTEL analysis
- 4.4. Market Entropy
- 4.5. Patent/Trademark Analysis
- 5. Global Fiber Optic Pressure Sensors Industry Analysis, Insights and Forecast, 2019-2031
- 5.1. Market Analysis, Insights and Forecast - by Type
- 5.1.1. Wired
- 5.1.2. Wireless
- 5.2. Market Analysis, Insights and Forecast - by Technology
- 5.2.1. Fabry-Perot
- 5.2.2. Fiber Bragg Grating
- 5.2.3. Intensity-based
- 5.2.4. Other Technologies
- 5.3. Market Analysis, Insights and Forecast - by Application
- 5.3.1. Automotive
- 5.3.2. Consumer Electronics
- 5.3.3. Healthcare
- 5.3.4. Industrial
- 5.3.5. Oil and Gas
- 5.3.6. Petrochemical
- 5.3.7. Other Applications
- 5.4. Market Analysis, Insights and Forecast - by Region
- 5.4.1. North America
- 5.4.2. Europe
- 5.4.3. Asia Pacific
- 5.4.4. Rest of the World
- 5.1. Market Analysis, Insights and Forecast - by Type
- 6. North America Fiber Optic Pressure Sensors Industry Analysis, Insights and Forecast, 2019-2031
- 6.1. Market Analysis, Insights and Forecast - by Type
- 6.1.1. Wired
- 6.1.2. Wireless
- 6.2. Market Analysis, Insights and Forecast - by Technology
- 6.2.1. Fabry-Perot
- 6.2.2. Fiber Bragg Grating
- 6.2.3. Intensity-based
- 6.2.4. Other Technologies
- 6.3. Market Analysis, Insights and Forecast - by Application
- 6.3.1. Automotive
- 6.3.2. Consumer Electronics
- 6.3.3. Healthcare
- 6.3.4. Industrial
- 6.3.5. Oil and Gas
- 6.3.6. Petrochemical
- 6.3.7. Other Applications
- 6.1. Market Analysis, Insights and Forecast - by Type
- 7. Europe Fiber Optic Pressure Sensors Industry Analysis, Insights and Forecast, 2019-2031
- 7.1. Market Analysis, Insights and Forecast - by Type
- 7.1.1. Wired
- 7.1.2. Wireless
- 7.2. Market Analysis, Insights and Forecast - by Technology
- 7.2.1. Fabry-Perot
- 7.2.2. Fiber Bragg Grating
- 7.2.3. Intensity-based
- 7.2.4. Other Technologies
- 7.3. Market Analysis, Insights and Forecast - by Application
- 7.3.1. Automotive
- 7.3.2. Consumer Electronics
- 7.3.3. Healthcare
- 7.3.4. Industrial
- 7.3.5. Oil and Gas
- 7.3.6. Petrochemical
- 7.3.7. Other Applications
- 7.1. Market Analysis, Insights and Forecast - by Type
- 8. Asia Pacific Fiber Optic Pressure Sensors Industry Analysis, Insights and Forecast, 2019-2031
- 8.1. Market Analysis, Insights and Forecast - by Type
- 8.1.1. Wired
- 8.1.2. Wireless
- 8.2. Market Analysis, Insights and Forecast - by Technology
- 8.2.1. Fabry-Perot
- 8.2.2. Fiber Bragg Grating
- 8.2.3. Intensity-based
- 8.2.4. Other Technologies
- 8.3. Market Analysis, Insights and Forecast - by Application
- 8.3.1. Automotive
- 8.3.2. Consumer Electronics
- 8.3.3. Healthcare
- 8.3.4. Industrial
- 8.3.5. Oil and Gas
- 8.3.6. Petrochemical
- 8.3.7. Other Applications
- 8.1. Market Analysis, Insights and Forecast - by Type
- 9. Rest of the World Fiber Optic Pressure Sensors Industry Analysis, Insights and Forecast, 2019-2031
- 9.1. Market Analysis, Insights and Forecast - by Type
- 9.1.1. Wired
- 9.1.2. Wireless
- 9.2. Market Analysis, Insights and Forecast - by Technology
- 9.2.1. Fabry-Perot
- 9.2.2. Fiber Bragg Grating
- 9.2.3. Intensity-based
- 9.2.4. Other Technologies
- 9.3. Market Analysis, Insights and Forecast - by Application
- 9.3.1. Automotive
- 9.3.2. Consumer Electronics
- 9.3.3. Healthcare
- 9.3.4. Industrial
- 9.3.5. Oil and Gas
- 9.3.6. Petrochemical
- 9.3.7. Other Applications
- 9.1. Market Analysis, Insights and Forecast - by Type
- 10. North America Fiber Optic Pressure Sensors Industry Analysis, Insights and Forecast, 2019-2031
- 10.1. Market Analysis, Insights and Forecast - By Country/Sub-region
- 10.1.1 United States
- 10.1.2 Canada
- 10.1.3 Mexico
- 11. Europe Fiber Optic Pressure Sensors Industry Analysis, Insights and Forecast, 2019-2031
- 11.1. Market Analysis, Insights and Forecast - By Country/Sub-region
- 11.1.1 Germany
- 11.1.2 United Kingdom
- 11.1.3 France
- 11.1.4 Spain
- 11.1.5 Italy
- 11.1.6 Spain
- 11.1.7 Belgium
- 11.1.8 Netherland
- 11.1.9 Nordics
- 11.1.10 Rest of Europe
- 12. Asia Pacific Fiber Optic Pressure Sensors Industry Analysis, Insights and Forecast, 2019-2031
- 12.1. Market Analysis, Insights and Forecast - By Country/Sub-region
- 12.1.1 China
- 12.1.2 Japan
- 12.1.3 India
- 12.1.4 South Korea
- 12.1.5 Southeast Asia
- 12.1.6 Australia
- 12.1.7 Indonesia
- 12.1.8 Phillipes
- 12.1.9 Singapore
- 12.1.10 Thailandc
- 12.1.11 Rest of Asia Pacific
- 13. South America Fiber Optic Pressure Sensors Industry Analysis, Insights and Forecast, 2019-2031
- 13.1. Market Analysis, Insights and Forecast - By Country/Sub-region
- 13.1.1 Brazil
- 13.1.2 Argentina
- 13.1.3 Peru
- 13.1.4 Chile
- 13.1.5 Colombia
- 13.1.6 Ecuador
- 13.1.7 Venezuela
- 13.1.8 Rest of South America
- 14. North America Fiber Optic Pressure Sensors Industry Analysis, Insights and Forecast, 2019-2031
- 14.1. Market Analysis, Insights and Forecast - By Country/Sub-region
- 14.1.1 United States
- 14.1.2 Canada
- 14.1.3 Mexico
- 15. MEA Fiber Optic Pressure Sensors Industry Analysis, Insights and Forecast, 2019-2031
- 15.1. Market Analysis, Insights and Forecast - By Country/Sub-region
- 15.1.1 United Arab Emirates
- 15.1.2 Saudi Arabia
- 15.1.3 South Africa
- 15.1.4 Rest of Middle East and Africa
- 16. Competitive Analysis
- 16.1. Global Market Share Analysis 2024
- 16.2. Company Profiles
- 16.2.1 Honeywell International Inc
- 16.2.1.1. Overview
- 16.2.1.2. Products
- 16.2.1.3. SWOT Analysis
- 16.2.1.4. Recent Developments
- 16.2.1.5. Financials (Based on Availability)
- 16.2.2 Opsens Inc
- 16.2.2.1. Overview
- 16.2.2.2. Products
- 16.2.2.3. SWOT Analysis
- 16.2.2.4. Recent Developments
- 16.2.2.5. Financials (Based on Availability)
- 16.2.3 STMicroelectronics Inc
- 16.2.3.1. Overview
- 16.2.3.2. Products
- 16.2.3.3. SWOT Analysis
- 16.2.3.4. Recent Developments
- 16.2.3.5. Financials (Based on Availability)
- 16.2.4 Althen Sensors & Controls
- 16.2.4.1. Overview
- 16.2.4.2. Products
- 16.2.4.3. SWOT Analysis
- 16.2.4.4. Recent Developments
- 16.2.4.5. Financials (Based on Availability)
- 16.2.5 FISO Technologies Inc
- 16.2.5.1. Overview
- 16.2.5.2. Products
- 16.2.5.3. SWOT Analysis
- 16.2.5.4. Recent Developments
- 16.2.5.5. Financials (Based on Availability)
- 16.2.6 NXP Semiconductors
- 16.2.6.1. Overview
- 16.2.6.2. Products
- 16.2.6.3. SWOT Analysis
- 16.2.6.4. Recent Developments
- 16.2.6.5. Financials (Based on Availability)
- 16.2.7 Omron Corporation
- 16.2.7.1. Overview
- 16.2.7.2. Products
- 16.2.7.3. SWOT Analysis
- 16.2.7.4. Recent Developments
- 16.2.7.5. Financials (Based on Availability)
- 16.2.8 Robert Bosch GmbH
- 16.2.8.1. Overview
- 16.2.8.2. Products
- 16.2.8.3. SWOT Analysis
- 16.2.8.4. Recent Developments
- 16.2.8.5. Financials (Based on Availability)
- 16.2.9 Infineon Technologies Inc
- 16.2.9.1. Overview
- 16.2.9.2. Products
- 16.2.9.3. SWOT Analysis
- 16.2.9.4. Recent Developments
- 16.2.9.5. Financials (Based on Availability)
- 16.2.10 Panasonic Corporation
- 16.2.10.1. Overview
- 16.2.10.2. Products
- 16.2.10.3. SWOT Analysis
- 16.2.10.4. Recent Developments
- 16.2.10.5. Financials (Based on Availability)
- 16.2.1 Honeywell International Inc
List of Figures
- Figure 1: Global Fiber Optic Pressure Sensors Industry Revenue Breakdown (Million, %) by Region 2024 & 2032
- Figure 2: Global Fiber Optic Pressure Sensors Industry Volume Breakdown (K Unit, %) by Region 2024 & 2032
- Figure 3: North America Fiber Optic Pressure Sensors Industry Revenue (Million), by Country 2024 & 2032
- Figure 4: North America Fiber Optic Pressure Sensors Industry Volume (K Unit), by Country 2024 & 2032
- Figure 5: North America Fiber Optic Pressure Sensors Industry Revenue Share (%), by Country 2024 & 2032
- Figure 6: North America Fiber Optic Pressure Sensors Industry Volume Share (%), by Country 2024 & 2032
- Figure 7: Europe Fiber Optic Pressure Sensors Industry Revenue (Million), by Country 2024 & 2032
- Figure 8: Europe Fiber Optic Pressure Sensors Industry Volume (K Unit), by Country 2024 & 2032
- Figure 9: Europe Fiber Optic Pressure Sensors Industry Revenue Share (%), by Country 2024 & 2032
- Figure 10: Europe Fiber Optic Pressure Sensors Industry Volume Share (%), by Country 2024 & 2032
- Figure 11: Asia Pacific Fiber Optic Pressure Sensors Industry Revenue (Million), by Country 2024 & 2032
- Figure 12: Asia Pacific Fiber Optic Pressure Sensors Industry Volume (K Unit), by Country 2024 & 2032
- Figure 13: Asia Pacific Fiber Optic Pressure Sensors Industry Revenue Share (%), by Country 2024 & 2032
- Figure 14: Asia Pacific Fiber Optic Pressure Sensors Industry Volume Share (%), by Country 2024 & 2032
- Figure 15: South America Fiber Optic Pressure Sensors Industry Revenue (Million), by Country 2024 & 2032
- Figure 16: South America Fiber Optic Pressure Sensors Industry Volume (K Unit), by Country 2024 & 2032
- Figure 17: South America Fiber Optic Pressure Sensors Industry Revenue Share (%), by Country 2024 & 2032
- Figure 18: South America Fiber Optic Pressure Sensors Industry Volume Share (%), by Country 2024 & 2032
- Figure 19: North America Fiber Optic Pressure Sensors Industry Revenue (Million), by Country 2024 & 2032
- Figure 20: North America Fiber Optic Pressure Sensors Industry Volume (K Unit), by Country 2024 & 2032
- Figure 21: North America Fiber Optic Pressure Sensors Industry Revenue Share (%), by Country 2024 & 2032
- Figure 22: North America Fiber Optic Pressure Sensors Industry Volume Share (%), by Country 2024 & 2032
- Figure 23: MEA Fiber Optic Pressure Sensors Industry Revenue (Million), by Country 2024 & 2032
- Figure 24: MEA Fiber Optic Pressure Sensors Industry Volume (K Unit), by Country 2024 & 2032
- Figure 25: MEA Fiber Optic Pressure Sensors Industry Revenue Share (%), by Country 2024 & 2032
- Figure 26: MEA Fiber Optic Pressure Sensors Industry Volume Share (%), by Country 2024 & 2032
- Figure 27: North America Fiber Optic Pressure Sensors Industry Revenue (Million), by Type 2024 & 2032
- Figure 28: North America Fiber Optic Pressure Sensors Industry Volume (K Unit), by Type 2024 & 2032
- Figure 29: North America Fiber Optic Pressure Sensors Industry Revenue Share (%), by Type 2024 & 2032
- Figure 30: North America Fiber Optic Pressure Sensors Industry Volume Share (%), by Type 2024 & 2032
- Figure 31: North America Fiber Optic Pressure Sensors Industry Revenue (Million), by Technology 2024 & 2032
- Figure 32: North America Fiber Optic Pressure Sensors Industry Volume (K Unit), by Technology 2024 & 2032
- Figure 33: North America Fiber Optic Pressure Sensors Industry Revenue Share (%), by Technology 2024 & 2032
- Figure 34: North America Fiber Optic Pressure Sensors Industry Volume Share (%), by Technology 2024 & 2032
- Figure 35: North America Fiber Optic Pressure Sensors Industry Revenue (Million), by Application 2024 & 2032
- Figure 36: North America Fiber Optic Pressure Sensors Industry Volume (K Unit), by Application 2024 & 2032
- Figure 37: North America Fiber Optic Pressure Sensors Industry Revenue Share (%), by Application 2024 & 2032
- Figure 38: North America Fiber Optic Pressure Sensors Industry Volume Share (%), by Application 2024 & 2032
- Figure 39: North America Fiber Optic Pressure Sensors Industry Revenue (Million), by Country 2024 & 2032
- Figure 40: North America Fiber Optic Pressure Sensors Industry Volume (K Unit), by Country 2024 & 2032
- Figure 41: North America Fiber Optic Pressure Sensors Industry Revenue Share (%), by Country 2024 & 2032
- Figure 42: North America Fiber Optic Pressure Sensors Industry Volume Share (%), by Country 2024 & 2032
- Figure 43: Europe Fiber Optic Pressure Sensors Industry Revenue (Million), by Type 2024 & 2032
- Figure 44: Europe Fiber Optic Pressure Sensors Industry Volume (K Unit), by Type 2024 & 2032
- Figure 45: Europe Fiber Optic Pressure Sensors Industry Revenue Share (%), by Type 2024 & 2032
- Figure 46: Europe Fiber Optic Pressure Sensors Industry Volume Share (%), by Type 2024 & 2032
- Figure 47: Europe Fiber Optic Pressure Sensors Industry Revenue (Million), by Technology 2024 & 2032
- Figure 48: Europe Fiber Optic Pressure Sensors Industry Volume (K Unit), by Technology 2024 & 2032
- Figure 49: Europe Fiber Optic Pressure Sensors Industry Revenue Share (%), by Technology 2024 & 2032
- Figure 50: Europe Fiber Optic Pressure Sensors Industry Volume Share (%), by Technology 2024 & 2032
- Figure 51: Europe Fiber Optic Pressure Sensors Industry Revenue (Million), by Application 2024 & 2032
- Figure 52: Europe Fiber Optic Pressure Sensors Industry Volume (K Unit), by Application 2024 & 2032
- Figure 53: Europe Fiber Optic Pressure Sensors Industry Revenue Share (%), by Application 2024 & 2032
- Figure 54: Europe Fiber Optic Pressure Sensors Industry Volume Share (%), by Application 2024 & 2032
- Figure 55: Europe Fiber Optic Pressure Sensors Industry Revenue (Million), by Country 2024 & 2032
- Figure 56: Europe Fiber Optic Pressure Sensors Industry Volume (K Unit), by Country 2024 & 2032
- Figure 57: Europe Fiber Optic Pressure Sensors Industry Revenue Share (%), by Country 2024 & 2032
- Figure 58: Europe Fiber Optic Pressure Sensors Industry Volume Share (%), by Country 2024 & 2032
- Figure 59: Asia Pacific Fiber Optic Pressure Sensors Industry Revenue (Million), by Type 2024 & 2032
- Figure 60: Asia Pacific Fiber Optic Pressure Sensors Industry Volume (K Unit), by Type 2024 & 2032
- Figure 61: Asia Pacific Fiber Optic Pressure Sensors Industry Revenue Share (%), by Type 2024 & 2032
- Figure 62: Asia Pacific Fiber Optic Pressure Sensors Industry Volume Share (%), by Type 2024 & 2032
- Figure 63: Asia Pacific Fiber Optic Pressure Sensors Industry Revenue (Million), by Technology 2024 & 2032
- Figure 64: Asia Pacific Fiber Optic Pressure Sensors Industry Volume (K Unit), by Technology 2024 & 2032
- Figure 65: Asia Pacific Fiber Optic Pressure Sensors Industry Revenue Share (%), by Technology 2024 & 2032
- Figure 66: Asia Pacific Fiber Optic Pressure Sensors Industry Volume Share (%), by Technology 2024 & 2032
- Figure 67: Asia Pacific Fiber Optic Pressure Sensors Industry Revenue (Million), by Application 2024 & 2032
- Figure 68: Asia Pacific Fiber Optic Pressure Sensors Industry Volume (K Unit), by Application 2024 & 2032
- Figure 69: Asia Pacific Fiber Optic Pressure Sensors Industry Revenue Share (%), by Application 2024 & 2032
- Figure 70: Asia Pacific Fiber Optic Pressure Sensors Industry Volume Share (%), by Application 2024 & 2032
- Figure 71: Asia Pacific Fiber Optic Pressure Sensors Industry Revenue (Million), by Country 2024 & 2032
- Figure 72: Asia Pacific Fiber Optic Pressure Sensors Industry Volume (K Unit), by Country 2024 & 2032
- Figure 73: Asia Pacific Fiber Optic Pressure Sensors Industry Revenue Share (%), by Country 2024 & 2032
- Figure 74: Asia Pacific Fiber Optic Pressure Sensors Industry Volume Share (%), by Country 2024 & 2032
- Figure 75: Rest of the World Fiber Optic Pressure Sensors Industry Revenue (Million), by Type 2024 & 2032
- Figure 76: Rest of the World Fiber Optic Pressure Sensors Industry Volume (K Unit), by Type 2024 & 2032
- Figure 77: Rest of the World Fiber Optic Pressure Sensors Industry Revenue Share (%), by Type 2024 & 2032
- Figure 78: Rest of the World Fiber Optic Pressure Sensors Industry Volume Share (%), by Type 2024 & 2032
- Figure 79: Rest of the World Fiber Optic Pressure Sensors Industry Revenue (Million), by Technology 2024 & 2032
- Figure 80: Rest of the World Fiber Optic Pressure Sensors Industry Volume (K Unit), by Technology 2024 & 2032
- Figure 81: Rest of the World Fiber Optic Pressure Sensors Industry Revenue Share (%), by Technology 2024 & 2032
- Figure 82: Rest of the World Fiber Optic Pressure Sensors Industry Volume Share (%), by Technology 2024 & 2032
- Figure 83: Rest of the World Fiber Optic Pressure Sensors Industry Revenue (Million), by Application 2024 & 2032
- Figure 84: Rest of the World Fiber Optic Pressure Sensors Industry Volume (K Unit), by Application 2024 & 2032
- Figure 85: Rest of the World Fiber Optic Pressure Sensors Industry Revenue Share (%), by Application 2024 & 2032
- Figure 86: Rest of the World Fiber Optic Pressure Sensors Industry Volume Share (%), by Application 2024 & 2032
- Figure 87: Rest of the World Fiber Optic Pressure Sensors Industry Revenue (Million), by Country 2024 & 2032
- Figure 88: Rest of the World Fiber Optic Pressure Sensors Industry Volume (K Unit), by Country 2024 & 2032
- Figure 89: Rest of the World Fiber Optic Pressure Sensors Industry Revenue Share (%), by Country 2024 & 2032
- Figure 90: Rest of the World Fiber Optic Pressure Sensors Industry Volume Share (%), by Country 2024 & 2032
List of Tables
- Table 1: Global Fiber Optic Pressure Sensors Industry Revenue Million Forecast, by Region 2019 & 2032
- Table 2: Global Fiber Optic Pressure Sensors Industry Volume K Unit Forecast, by Region 2019 & 2032
- Table 3: Global Fiber Optic Pressure Sensors Industry Revenue Million Forecast, by Type 2019 & 2032
- Table 4: Global Fiber Optic Pressure Sensors Industry Volume K Unit Forecast, by Type 2019 & 2032
- Table 5: Global Fiber Optic Pressure Sensors Industry Revenue Million Forecast, by Technology 2019 & 2032
- Table 6: Global Fiber Optic Pressure Sensors Industry Volume K Unit Forecast, by Technology 2019 & 2032
- Table 7: Global Fiber Optic Pressure Sensors Industry Revenue Million Forecast, by Application 2019 & 2032
- Table 8: Global Fiber Optic Pressure Sensors Industry Volume K Unit Forecast, by Application 2019 & 2032
- Table 9: Global Fiber Optic Pressure Sensors Industry Revenue Million Forecast, by Region 2019 & 2032
- Table 10: Global Fiber Optic Pressure Sensors Industry Volume K Unit Forecast, by Region 2019 & 2032
- Table 11: Global Fiber Optic Pressure Sensors Industry Revenue Million Forecast, by Country 2019 & 2032
- Table 12: Global Fiber Optic Pressure Sensors Industry Volume K Unit Forecast, by Country 2019 & 2032
- Table 13: United States Fiber Optic Pressure Sensors Industry Revenue (Million) Forecast, by Application 2019 & 2032
- Table 14: United States Fiber Optic Pressure Sensors Industry Volume (K Unit) Forecast, by Application 2019 & 2032
- Table 15: Canada Fiber Optic Pressure Sensors Industry Revenue (Million) Forecast, by Application 2019 & 2032
- Table 16: Canada Fiber Optic Pressure Sensors Industry Volume (K Unit) Forecast, by Application 2019 & 2032
- Table 17: Mexico Fiber Optic Pressure Sensors Industry Revenue (Million) Forecast, by Application 2019 & 2032
- Table 18: Mexico Fiber Optic Pressure Sensors Industry Volume (K Unit) Forecast, by Application 2019 & 2032
- Table 19: Global Fiber Optic Pressure Sensors Industry Revenue Million Forecast, by Country 2019 & 2032
- Table 20: Global Fiber Optic Pressure Sensors Industry Volume K Unit Forecast, by Country 2019 & 2032
- Table 21: Germany Fiber Optic Pressure Sensors Industry Revenue (Million) Forecast, by Application 2019 & 2032
- Table 22: Germany Fiber Optic Pressure Sensors Industry Volume (K Unit) Forecast, by Application 2019 & 2032
- Table 23: United Kingdom Fiber Optic Pressure Sensors Industry Revenue (Million) Forecast, by Application 2019 & 2032
- Table 24: United Kingdom Fiber Optic Pressure Sensors Industry Volume (K Unit) Forecast, by Application 2019 & 2032
- Table 25: France Fiber Optic Pressure Sensors Industry Revenue (Million) Forecast, by Application 2019 & 2032
- Table 26: France Fiber Optic Pressure Sensors Industry Volume (K Unit) Forecast, by Application 2019 & 2032
- Table 27: Spain Fiber Optic Pressure Sensors Industry Revenue (Million) Forecast, by Application 2019 & 2032
- Table 28: Spain Fiber Optic Pressure Sensors Industry Volume (K Unit) Forecast, by Application 2019 & 2032
- Table 29: Italy Fiber Optic Pressure Sensors Industry Revenue (Million) Forecast, by Application 2019 & 2032
- Table 30: Italy Fiber Optic Pressure Sensors Industry Volume (K Unit) Forecast, by Application 2019 & 2032
- Table 31: Spain Fiber Optic Pressure Sensors Industry Revenue (Million) Forecast, by Application 2019 & 2032
- Table 32: Spain Fiber Optic Pressure Sensors Industry Volume (K Unit) Forecast, by Application 2019 & 2032
- Table 33: Belgium Fiber Optic Pressure Sensors Industry Revenue (Million) Forecast, by Application 2019 & 2032
- Table 34: Belgium Fiber Optic Pressure Sensors Industry Volume (K Unit) Forecast, by Application 2019 & 2032
- Table 35: Netherland Fiber Optic Pressure Sensors Industry Revenue (Million) Forecast, by Application 2019 & 2032
- Table 36: Netherland Fiber Optic Pressure Sensors Industry Volume (K Unit) Forecast, by Application 2019 & 2032
- Table 37: Nordics Fiber Optic Pressure Sensors Industry Revenue (Million) Forecast, by Application 2019 & 2032
- Table 38: Nordics Fiber Optic Pressure Sensors Industry Volume (K Unit) Forecast, by Application 2019 & 2032
- Table 39: Rest of Europe Fiber Optic Pressure Sensors Industry Revenue (Million) Forecast, by Application 2019 & 2032
- Table 40: Rest of Europe Fiber Optic Pressure Sensors Industry Volume (K Unit) Forecast, by Application 2019 & 2032
- Table 41: Global Fiber Optic Pressure Sensors Industry Revenue Million Forecast, by Country 2019 & 2032
- Table 42: Global Fiber Optic Pressure Sensors Industry Volume K Unit Forecast, by Country 2019 & 2032
- Table 43: China Fiber Optic Pressure Sensors Industry Revenue (Million) Forecast, by Application 2019 & 2032
- Table 44: China Fiber Optic Pressure Sensors Industry Volume (K Unit) Forecast, by Application 2019 & 2032
- Table 45: Japan Fiber Optic Pressure Sensors Industry Revenue (Million) Forecast, by Application 2019 & 2032
- Table 46: Japan Fiber Optic Pressure Sensors Industry Volume (K Unit) Forecast, by Application 2019 & 2032
- Table 47: India Fiber Optic Pressure Sensors Industry Revenue (Million) Forecast, by Application 2019 & 2032
- Table 48: India Fiber Optic Pressure Sensors Industry Volume (K Unit) Forecast, by Application 2019 & 2032
- Table 49: South Korea Fiber Optic Pressure Sensors Industry Revenue (Million) Forecast, by Application 2019 & 2032
- Table 50: South Korea Fiber Optic Pressure Sensors Industry Volume (K Unit) Forecast, by Application 2019 & 2032
- Table 51: Southeast Asia Fiber Optic Pressure Sensors Industry Revenue (Million) Forecast, by Application 2019 & 2032
- Table 52: Southeast Asia Fiber Optic Pressure Sensors Industry Volume (K Unit) Forecast, by Application 2019 & 2032
- Table 53: Australia Fiber Optic Pressure Sensors Industry Revenue (Million) Forecast, by Application 2019 & 2032
- Table 54: Australia Fiber Optic Pressure Sensors Industry Volume (K Unit) Forecast, by Application 2019 & 2032
- Table 55: Indonesia Fiber Optic Pressure Sensors Industry Revenue (Million) Forecast, by Application 2019 & 2032
- Table 56: Indonesia Fiber Optic Pressure Sensors Industry Volume (K Unit) Forecast, by Application 2019 & 2032
- Table 57: Phillipes Fiber Optic Pressure Sensors Industry Revenue (Million) Forecast, by Application 2019 & 2032
- Table 58: Phillipes Fiber Optic Pressure Sensors Industry Volume (K Unit) Forecast, by Application 2019 & 2032
- Table 59: Singapore Fiber Optic Pressure Sensors Industry Revenue (Million) Forecast, by Application 2019 & 2032
- Table 60: Singapore Fiber Optic Pressure Sensors Industry Volume (K Unit) Forecast, by Application 2019 & 2032
- Table 61: Thailandc Fiber Optic Pressure Sensors Industry Revenue (Million) Forecast, by Application 2019 & 2032
- Table 62: Thailandc Fiber Optic Pressure Sensors Industry Volume (K Unit) Forecast, by Application 2019 & 2032
- Table 63: Rest of Asia Pacific Fiber Optic Pressure Sensors Industry Revenue (Million) Forecast, by Application 2019 & 2032
- Table 64: Rest of Asia Pacific Fiber Optic Pressure Sensors Industry Volume (K Unit) Forecast, by Application 2019 & 2032
- Table 65: Global Fiber Optic Pressure Sensors Industry Revenue Million Forecast, by Country 2019 & 2032
- Table 66: Global Fiber Optic Pressure Sensors Industry Volume K Unit Forecast, by Country 2019 & 2032
- Table 67: Brazil Fiber Optic Pressure Sensors Industry Revenue (Million) Forecast, by Application 2019 & 2032
- Table 68: Brazil Fiber Optic Pressure Sensors Industry Volume (K Unit) Forecast, by Application 2019 & 2032
- Table 69: Argentina Fiber Optic Pressure Sensors Industry Revenue (Million) Forecast, by Application 2019 & 2032
- Table 70: Argentina Fiber Optic Pressure Sensors Industry Volume (K Unit) Forecast, by Application 2019 & 2032
- Table 71: Peru Fiber Optic Pressure Sensors Industry Revenue (Million) Forecast, by Application 2019 & 2032
- Table 72: Peru Fiber Optic Pressure Sensors Industry Volume (K Unit) Forecast, by Application 2019 & 2032
- Table 73: Chile Fiber Optic Pressure Sensors Industry Revenue (Million) Forecast, by Application 2019 & 2032
- Table 74: Chile Fiber Optic Pressure Sensors Industry Volume (K Unit) Forecast, by Application 2019 & 2032
- Table 75: Colombia Fiber Optic Pressure Sensors Industry Revenue (Million) Forecast, by Application 2019 & 2032
- Table 76: Colombia Fiber Optic Pressure Sensors Industry Volume (K Unit) Forecast, by Application 2019 & 2032
- Table 77: Ecuador Fiber Optic Pressure Sensors Industry Revenue (Million) Forecast, by Application 2019 & 2032
- Table 78: Ecuador Fiber Optic Pressure Sensors Industry Volume (K Unit) Forecast, by Application 2019 & 2032
- Table 79: Venezuela Fiber Optic Pressure Sensors Industry Revenue (Million) Forecast, by Application 2019 & 2032
- Table 80: Venezuela Fiber Optic Pressure Sensors Industry Volume (K Unit) Forecast, by Application 2019 & 2032
- Table 81: Rest of South America Fiber Optic Pressure Sensors Industry Revenue (Million) Forecast, by Application 2019 & 2032
- Table 82: Rest of South America Fiber Optic Pressure Sensors Industry Volume (K Unit) Forecast, by Application 2019 & 2032
- Table 83: Global Fiber Optic Pressure Sensors Industry Revenue Million Forecast, by Country 2019 & 2032
- Table 84: Global Fiber Optic Pressure Sensors Industry Volume K Unit Forecast, by Country 2019 & 2032
- Table 85: United States Fiber Optic Pressure Sensors Industry Revenue (Million) Forecast, by Application 2019 & 2032
- Table 86: United States Fiber Optic Pressure Sensors Industry Volume (K Unit) Forecast, by Application 2019 & 2032
- Table 87: Canada Fiber Optic Pressure Sensors Industry Revenue (Million) Forecast, by Application 2019 & 2032
- Table 88: Canada Fiber Optic Pressure Sensors Industry Volume (K Unit) Forecast, by Application 2019 & 2032
- Table 89: Mexico Fiber Optic Pressure Sensors Industry Revenue (Million) Forecast, by Application 2019 & 2032
- Table 90: Mexico Fiber Optic Pressure Sensors Industry Volume (K Unit) Forecast, by Application 2019 & 2032
- Table 91: Global Fiber Optic Pressure Sensors Industry Revenue Million Forecast, by Country 2019 & 2032
- Table 92: Global Fiber Optic Pressure Sensors Industry Volume K Unit Forecast, by Country 2019 & 2032
- Table 93: United Arab Emirates Fiber Optic Pressure Sensors Industry Revenue (Million) Forecast, by Application 2019 & 2032
- Table 94: United Arab Emirates Fiber Optic Pressure Sensors Industry Volume (K Unit) Forecast, by Application 2019 & 2032
- Table 95: Saudi Arabia Fiber Optic Pressure Sensors Industry Revenue (Million) Forecast, by Application 2019 & 2032
- Table 96: Saudi Arabia Fiber Optic Pressure Sensors Industry Volume (K Unit) Forecast, by Application 2019 & 2032
- Table 97: South Africa Fiber Optic Pressure Sensors Industry Revenue (Million) Forecast, by Application 2019 & 2032
- Table 98: South Africa Fiber Optic Pressure Sensors Industry Volume (K Unit) Forecast, by Application 2019 & 2032
- Table 99: Rest of Middle East and Africa Fiber Optic Pressure Sensors Industry Revenue (Million) Forecast, by Application 2019 & 2032
- Table 100: Rest of Middle East and Africa Fiber Optic Pressure Sensors Industry Volume (K Unit) Forecast, by Application 2019 & 2032
- Table 101: Global Fiber Optic Pressure Sensors Industry Revenue Million Forecast, by Type 2019 & 2032
- Table 102: Global Fiber Optic Pressure Sensors Industry Volume K Unit Forecast, by Type 2019 & 2032
- Table 103: Global Fiber Optic Pressure Sensors Industry Revenue Million Forecast, by Technology 2019 & 2032
- Table 104: Global Fiber Optic Pressure Sensors Industry Volume K Unit Forecast, by Technology 2019 & 2032
- Table 105: Global Fiber Optic Pressure Sensors Industry Revenue Million Forecast, by Application 2019 & 2032
- Table 106: Global Fiber Optic Pressure Sensors Industry Volume K Unit Forecast, by Application 2019 & 2032
- Table 107: Global Fiber Optic Pressure Sensors Industry Revenue Million Forecast, by Country 2019 & 2032
- Table 108: Global Fiber Optic Pressure Sensors Industry Volume K Unit Forecast, by Country 2019 & 2032
- Table 109: United States Fiber Optic Pressure Sensors Industry Revenue (Million) Forecast, by Application 2019 & 2032
- Table 110: United States Fiber Optic Pressure Sensors Industry Volume (K Unit) Forecast, by Application 2019 & 2032
- Table 111: Canada Fiber Optic Pressure Sensors Industry Revenue (Million) Forecast, by Application 2019 & 2032
- Table 112: Canada Fiber Optic Pressure Sensors Industry Volume (K Unit) Forecast, by Application 2019 & 2032
- Table 113: Global Fiber Optic Pressure Sensors Industry Revenue Million Forecast, by Type 2019 & 2032
- Table 114: Global Fiber Optic Pressure Sensors Industry Volume K Unit Forecast, by Type 2019 & 2032
- Table 115: Global Fiber Optic Pressure Sensors Industry Revenue Million Forecast, by Technology 2019 & 2032
- Table 116: Global Fiber Optic Pressure Sensors Industry Volume K Unit Forecast, by Technology 2019 & 2032
- Table 117: Global Fiber Optic Pressure Sensors Industry Revenue Million Forecast, by Application 2019 & 2032
- Table 118: Global Fiber Optic Pressure Sensors Industry Volume K Unit Forecast, by Application 2019 & 2032
- Table 119: Global Fiber Optic Pressure Sensors Industry Revenue Million Forecast, by Country 2019 & 2032
- Table 120: Global Fiber Optic Pressure Sensors Industry Volume K Unit Forecast, by Country 2019 & 2032
- Table 121: United Kingdom Fiber Optic Pressure Sensors Industry Revenue (Million) Forecast, by Application 2019 & 2032
- Table 122: United Kingdom Fiber Optic Pressure Sensors Industry Volume (K Unit) Forecast, by Application 2019 & 2032
- Table 123: Germany Fiber Optic Pressure Sensors Industry Revenue (Million) Forecast, by Application 2019 & 2032
- Table 124: Germany Fiber Optic Pressure Sensors Industry Volume (K Unit) Forecast, by Application 2019 & 2032
- Table 125: France Fiber Optic Pressure Sensors Industry Revenue (Million) Forecast, by Application 2019 & 2032
- Table 126: France Fiber Optic Pressure Sensors Industry Volume (K Unit) Forecast, by Application 2019 & 2032
- Table 127: Russia Fiber Optic Pressure Sensors Industry Revenue (Million) Forecast, by Application 2019 & 2032
- Table 128: Russia Fiber Optic Pressure Sensors Industry Volume (K Unit) Forecast, by Application 2019 & 2032
- Table 129: Rest of Europe Fiber Optic Pressure Sensors Industry Revenue (Million) Forecast, by Application 2019 & 2032
- Table 130: Rest of Europe Fiber Optic Pressure Sensors Industry Volume (K Unit) Forecast, by Application 2019 & 2032
- Table 131: Global Fiber Optic Pressure Sensors Industry Revenue Million Forecast, by Type 2019 & 2032
- Table 132: Global Fiber Optic Pressure Sensors Industry Volume K Unit Forecast, by Type 2019 & 2032
- Table 133: Global Fiber Optic Pressure Sensors Industry Revenue Million Forecast, by Technology 2019 & 2032
- Table 134: Global Fiber Optic Pressure Sensors Industry Volume K Unit Forecast, by Technology 2019 & 2032
- Table 135: Global Fiber Optic Pressure Sensors Industry Revenue Million Forecast, by Application 2019 & 2032
- Table 136: Global Fiber Optic Pressure Sensors Industry Volume K Unit Forecast, by Application 2019 & 2032
- Table 137: Global Fiber Optic Pressure Sensors Industry Revenue Million Forecast, by Country 2019 & 2032
- Table 138: Global Fiber Optic Pressure Sensors Industry Volume K Unit Forecast, by Country 2019 & 2032
- Table 139: China Fiber Optic Pressure Sensors Industry Revenue (Million) Forecast, by Application 2019 & 2032
- Table 140: China Fiber Optic Pressure Sensors Industry Volume (K Unit) Forecast, by Application 2019 & 2032
- Table 141: India Fiber Optic Pressure Sensors Industry Revenue (Million) Forecast, by Application 2019 & 2032
- Table 142: India Fiber Optic Pressure Sensors Industry Volume (K Unit) Forecast, by Application 2019 & 2032
- Table 143: Japan Fiber Optic Pressure Sensors Industry Revenue (Million) Forecast, by Application 2019 & 2032
- Table 144: Japan Fiber Optic Pressure Sensors Industry Volume (K Unit) Forecast, by Application 2019 & 2032
- Table 145: Rest of Asia Pacific Fiber Optic Pressure Sensors Industry Revenue (Million) Forecast, by Application 2019 & 2032
- Table 146: Rest of Asia Pacific Fiber Optic Pressure Sensors Industry Volume (K Unit) Forecast, by Application 2019 & 2032
- Table 147: Global Fiber Optic Pressure Sensors Industry Revenue Million Forecast, by Type 2019 & 2032
- Table 148: Global Fiber Optic Pressure Sensors Industry Volume K Unit Forecast, by Type 2019 & 2032
- Table 149: Global Fiber Optic Pressure Sensors Industry Revenue Million Forecast, by Technology 2019 & 2032
- Table 150: Global Fiber Optic Pressure Sensors Industry Volume K Unit Forecast, by Technology 2019 & 2032
- Table 151: Global Fiber Optic Pressure Sensors Industry Revenue Million Forecast, by Application 2019 & 2032
- Table 152: Global Fiber Optic Pressure Sensors Industry Volume K Unit Forecast, by Application 2019 & 2032
- Table 153: Global Fiber Optic Pressure Sensors Industry Revenue Million Forecast, by Country 2019 & 2032
- Table 154: Global Fiber Optic Pressure Sensors Industry Volume K Unit Forecast, by Country 2019 & 2032
- Table 155: Latin America Fiber Optic Pressure Sensors Industry Revenue (Million) Forecast, by Application 2019 & 2032
- Table 156: Latin America Fiber Optic Pressure Sensors Industry Volume (K Unit) Forecast, by Application 2019 & 2032
- Table 157: Middle East Fiber Optic Pressure Sensors Industry Revenue (Million) Forecast, by Application 2019 & 2032
- Table 158: Middle East Fiber Optic Pressure Sensors Industry Volume (K Unit) Forecast, by Application 2019 & 2032
Frequently Asked Questions
1. What is the projected Compound Annual Growth Rate (CAGR) of the Fiber Optic Pressure Sensors Industry?
The projected CAGR is approximately 9.92%.
2. Which companies are prominent players in the Fiber Optic Pressure Sensors Industry?
Key companies in the market include Honeywell International Inc, Opsens Inc, STMicroelectronics Inc, Althen Sensors & Controls, FISO Technologies Inc, NXP Semiconductors, Omron Corporation, Robert Bosch GmbH, Infineon Technologies Inc, Panasonic Corporation.
3. What are the main segments of the Fiber Optic Pressure Sensors Industry?
The market segments include Type, Technology, Application.
4. Can you provide details about the market size?
The market size is estimated to be USD XX Million as of 2022.
5. What are some drivers contributing to market growth?
; Rapid Technological Advancements; Easy Deployment with High Stability.
6. What are the notable trends driving market growth?
Oil and Gas Expected to Drive the Market Growth.
7. Are there any restraints impacting market growth?
; High Cost of Product in Biomedical Applications.
8. Can you provide examples of recent developments in the market?
N/A
9. What pricing options are available for accessing the report?
Pricing options include single-user, multi-user, and enterprise licenses priced at USD 4750, USD 5250, and USD 8750 respectively.
10. Is the market size provided in terms of value or volume?
The market size is provided in terms of value, measured in Million and volume, measured in K Unit.
11. Are there any specific market keywords associated with the report?
Yes, the market keyword associated with the report is "Fiber Optic Pressure Sensors Industry," which aids in identifying and referencing the specific market segment covered.
12. How do I determine which pricing option suits my needs best?
The pricing options vary based on user requirements and access needs. Individual users may opt for single-user licenses, while businesses requiring broader access may choose multi-user or enterprise licenses for cost-effective access to the report.
13. Are there any additional resources or data provided in the Fiber Optic Pressure Sensors Industry report?
While the report offers comprehensive insights, it's advisable to review the specific contents or supplementary materials provided to ascertain if additional resources or data are available.
14. How can I stay updated on further developments or reports in the Fiber Optic Pressure Sensors Industry?
To stay informed about further developments, trends, and reports in the Fiber Optic Pressure Sensors Industry, consider subscribing to industry newsletters, following relevant companies and organizations, or regularly checking reputable industry news sources and publications.
Methodology
Step 1 - Identification of Relevant Samples Size from Population Database


Step 2 - Approaches for Defining Global Market Size (Value, Volume* & Price*)

Note*: In applicable scenarios
Step 3 - Data Sources
Primary Research
- Web Analytics
- Survey Reports
- Research Institute
- Latest Research Reports
- Opinion Leaders
Secondary Research
- Annual Reports
- White Paper
- Latest Press Release
- Industry Association
- Paid Database
- Investor Presentations

Step 4 - Data Triangulation
Involves using different sources of information in order to increase the validity of a study
These sources are likely to be stakeholders in a program - participants, other researchers, program staff, other community members, and so on.
Then we put all data in single framework & apply various statistical tools to find out the dynamic on the market.
During the analysis stage, feedback from the stakeholder groups would be compared to determine areas of agreement as well as areas of divergence
