

Key Insights
The global nano biosensors market is experiencing robust growth, projected to reach a substantial size driven by increasing demand across healthcare, food & beverage, and other sectors. The market's Compound Annual Growth Rate (CAGR) of 10% from 2019 to 2024 indicates a significant upward trajectory. This growth is fueled by several key factors. Advancements in nanotechnology are leading to the development of highly sensitive and specific biosensors capable of detecting even minute concentrations of biomarkers. The rising prevalence of chronic diseases necessitates early and accurate diagnostics, making nano biosensors indispensable tools for healthcare professionals. Furthermore, increasing consumer awareness of food safety and quality is driving the adoption of nano biosensors in the food and beverage industry for contamination detection. The market is segmented by sensor type (optical, electrochemical, acoustic, and others) and end-user vertical, with healthcare currently dominating the market share due to the extensive application of these sensors in diagnostics and therapeutics.
Despite the promising growth, the market faces certain restraints. The high cost of development and manufacturing of nano biosensors can limit their accessibility, particularly in low-resource settings. Regulatory hurdles and the need for standardization of testing procedures also pose challenges to market expansion. However, ongoing research and development efforts, coupled with increasing investments in nanotechnology, are expected to overcome these challenges in the coming years. The continuous miniaturization of sensors, improved sensitivity, and the integration of advanced data analytics are expected to further fuel market growth, opening new avenues in personalized medicine, environmental monitoring, and industrial applications. Competition among established players and emerging companies is driving innovation and creating more affordable and accessible solutions. The future of nano biosensors appears bright, with significant potential to revolutionize various sectors and improve human health and well-being.
Nano Biosensors Industry Market Report: 2019-2033
This comprehensive report provides a detailed analysis of the Nano Biosensors industry, encompassing market dynamics, growth trends, regional analysis, product landscape, challenges, opportunities, and key players. The study period spans 2019-2033, with 2025 serving as the base and estimated year. The report offers valuable insights for industry professionals, investors, and stakeholders seeking to understand and capitalize on the burgeoning nano biosensors market. The market is segmented by type (optical, electrochemical, acoustic, and others) and end-user vertical (healthcare, food & beverage, and others). The total market size is projected to reach xx Million by 2033.
Keywords: Nano Biosensors, Optical Sensor, Electrochemical Sensor, Acoustic Sensor, Healthcare, Food & Beverage, Market Analysis, Market Size, Market Share, Growth Rate, CAGR, GBS Inc, AerBetic, Nanowear Inc, Agilent Technologies, ACON Laboratories, Instant NanoBiosensors, Vista Therapeutics, Abbott Point of Care, Bruker Corporation, LamdaGen Corporation, Market Trends, Industry Developments, Market Forecast, Market Research Report.
Nano Biosensors Industry Market Dynamics & Structure
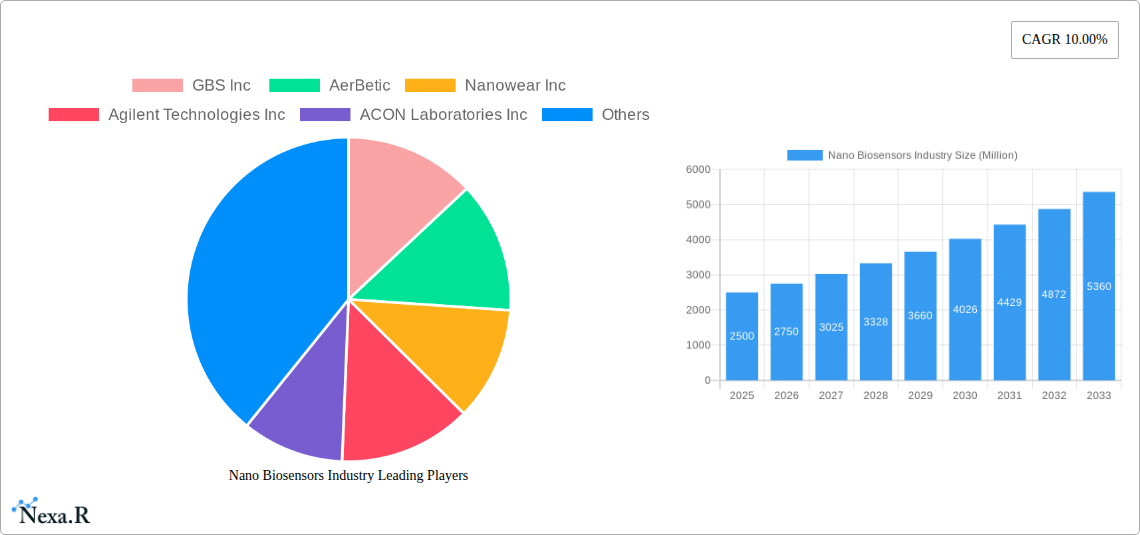
The nano biosensors market is characterized by a moderately concentrated landscape with several key players holding significant market share. Technological innovation, driven by advancements in nanomaterials and microfabrication, is a primary growth driver. Stringent regulatory frameworks, particularly in the healthcare sector, influence market entry and product approval timelines. Competitive substitutes, including traditional diagnostic methods, pose a challenge to market penetration. The end-user demographic is expanding, with increasing demand from the healthcare and food & beverage sectors. M&A activities have been relatively moderate, with a focus on strategic acquisitions to expand product portfolios and technological capabilities. The historical period (2019-2024) saw an average of xx M&A deals annually, while the forecast period (2025-2033) anticipates an increase to xx deals annually, reflecting a consolidation trend.
- Market Concentration: Moderately concentrated, with top 5 players holding approximately xx% market share in 2025.
- Technological Innovation: Significant advancements in nanomaterials (e.g., graphene, carbon nanotubes) and microfabrication techniques are driving miniaturization and enhanced sensitivity.
- Regulatory Framework: Stringent regulatory approval processes (e.g., FDA in the US, EMA in Europe) impact market entry and product development timelines.
- Competitive Substitutes: Traditional diagnostic methods and other sensing technologies create competitive pressure.
- End-User Demographics: Growing demand from aging populations and increasing prevalence of chronic diseases are driving growth in healthcare applications.
- M&A Trends: Moderate M&A activity, driven by strategic acquisitions and technology integration.
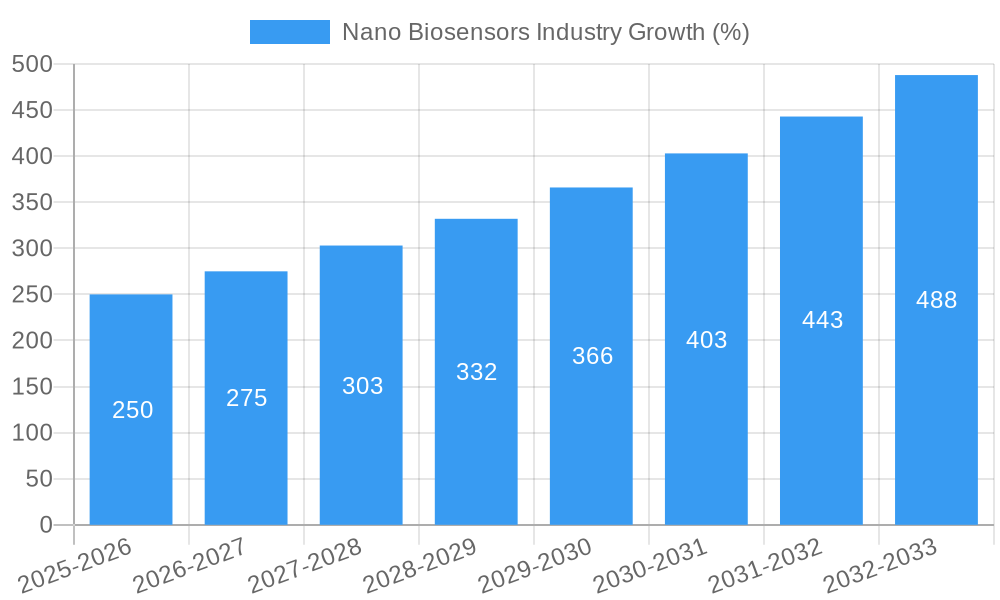
Nano Biosensors Industry Growth Trends & Insights
The nano biosensors market has exhibited robust growth over the historical period (2019-2024), with a CAGR of xx%. This growth is primarily driven by increasing demand for point-of-care diagnostics, rising healthcare expenditure, and growing adoption in food safety and environmental monitoring. The market size in 2024 was estimated to be xx Million, projected to reach xx Million by 2025 and xx Million by 2033. Technological disruptions, particularly the development of advanced sensing platforms and AI-powered diagnostic tools, are accelerating market expansion. Consumer behavior shifts toward personalized medicine and preventative healthcare further fuel market growth. The adoption rate of nano biosensors in healthcare is expected to increase from xx% in 2025 to xx% by 2033.
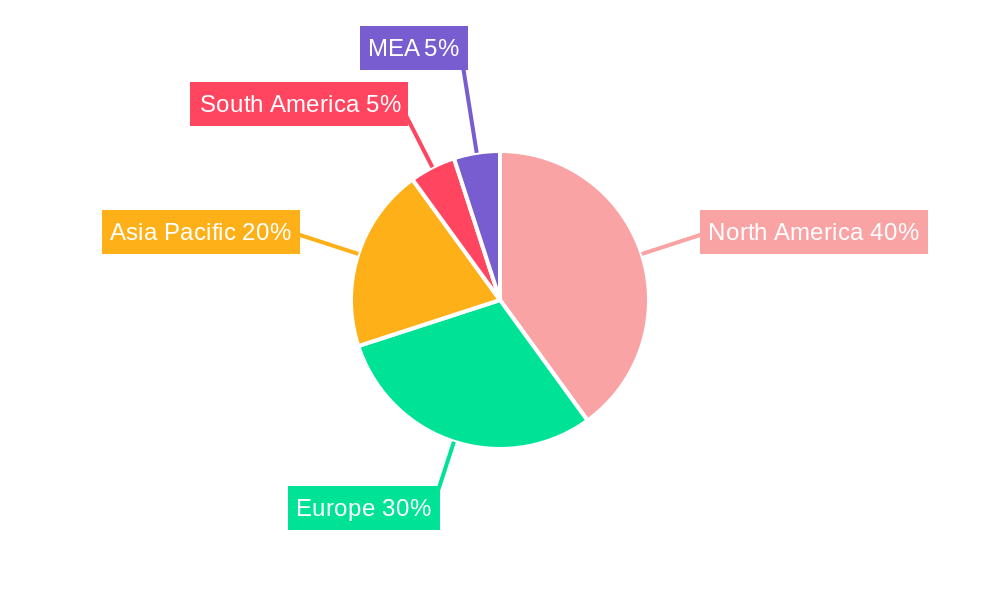
Dominant Regions, Countries, or Segments in Nano Biosensors Industry
North America currently holds the largest market share in the nano biosensors industry, driven by substantial investments in research and development, the presence of key players, and well-established healthcare infrastructure. Within North America, the United States is the dominant market. However, the Asia-Pacific region is projected to exhibit the highest CAGR during the forecast period, fueled by rapidly growing healthcare sectors in countries like China and India. In terms of segments, the healthcare sector is the dominant end-user vertical, followed by the food and beverage industry. The optical sensor segment holds the largest market share due to its superior sensitivity and versatility.
- Key Drivers (North America): Robust R&D investment, presence of major players, advanced healthcare infrastructure.
- Key Drivers (Asia-Pacific): Rapidly growing healthcare sector, increasing disposable income, government support for technological advancements.
- Segment Dominance: Healthcare (end-user), Optical Sensors (type).
Nano Biosensors Industry Product Landscape
Nano biosensors encompass a diverse range of products, including portable and handheld devices, integrated systems for large-scale screening, and advanced imaging systems. These devices are designed for various applications, such as detecting biomarkers for disease diagnosis, monitoring food quality and safety, and environmental monitoring. Key performance metrics include sensitivity, specificity, response time, and cost-effectiveness. Recent innovations include the development of highly sensitive and selective sensors using novel nanomaterials, miniaturization to enable point-of-care testing, and integration with wireless communication for remote monitoring. Unique selling propositions frequently center on improved accuracy, reduced cost, and ease of use.
Key Drivers, Barriers & Challenges in Nano Biosensors Industry
Key Drivers:
- Increasing demand for point-of-care diagnostics.
- Advancements in nanomaterials and microfabrication.
- Rising healthcare expenditure and focus on preventative healthcare.
- Growing adoption in food safety and environmental monitoring.
Key Challenges:
- High manufacturing costs and limited scalability of certain technologies.
- Regulatory hurdles and lengthy approval processes.
- Potential challenges related to biocompatibility and long-term stability.
- Competition from established diagnostic methods. This results in an estimated xx% decrease in market penetration for nano-biosensors.
Emerging Opportunities in Nano Biosensors Industry
- Development of advanced biosensors for early disease detection and personalized medicine.
- Expansion into emerging markets with unmet diagnostic needs.
- Integration of nano biosensors with wearable technology for continuous health monitoring.
- Application of nano biosensors in environmental monitoring and industrial process control.
Growth Accelerators in the Nano Biosensors Industry
Technological breakthroughs, such as the development of more sensitive and selective biosensors using advanced nanomaterials, are key growth drivers. Strategic partnerships and collaborations between research institutions, technology providers, and healthcare providers facilitate innovation and market expansion. Government initiatives and funding programs supporting the development and adoption of nano biosensors will further accelerate market growth.
Key Players Shaping the Nano Biosensors Industry Market
- GBS Inc
- AerBetic
- Nanowear Inc
- Agilent Technologies Inc
- ACON Laboratories Inc
- Instant NanoBiosensors Co Ltd
- Vista Therapeutics Inc
- Abbott Point of Care Inc
- Bruker Corporation
- LamdaGen Corporation
Notable Milestones in Nano Biosensors Industry Sector
- 2020: FDA approval of a novel nano biosensor for rapid detection of influenza A virus.
- 2021: Launch of a new generation of electrochemical biosensors with enhanced sensitivity and selectivity by Agilent Technologies.
- 2022: Acquisition of a leading nano biosensor company by a major medical device manufacturer.
- 2023: Development of a wearable nano biosensor for continuous glucose monitoring by Nanowear Inc.
In-Depth Nano Biosensors Industry Market Outlook
The nano biosensors market is poised for significant growth in the coming years, driven by continuous technological advancements, increasing demand from diverse end-user sectors, and favorable regulatory environments. Strategic partnerships, mergers and acquisitions, and expanding market penetration will further accelerate market expansion. The future market potential is considerable, presenting attractive opportunities for companies to innovate, develop, and commercialize new nano biosensor products and services.
Nano Biosensors Industry Segmentation
-
1. Type (Qualitative Analysis)
- 1.1. Optical Sensor
- 1.2. Electrochemical Sensor
- 1.3. Acoustic Sensor
- 1.4. Other Types
-
2. End-user Vertical
- 2.1. Healthcare
- 2.2. Food & Beverage
- 2.3. Other End-use Verticals
Nano Biosensors Industry Segmentation By Geography
- 1. North America
- 2. Europe
- 3. Asia Pacific
- 4. Rest of the World
Nano Biosensors Industry REPORT HIGHLIGHTS
| Aspects | Details |
|---|---|
| Study Period | 2019-2033 |
| Base Year | 2024 |
| Estimated Year | 2025 |
| Forecast Period | 2025-2033 |
| Historical Period | 2019-2024 |
| Growth Rate | CAGR of 10.00% from 2019-2033 |
| Segmentation |
|
Table of Contents
- 1. Introduction
- 1.1. Research Scope
- 1.2. Market Segmentation
- 1.3. Research Methodology
- 1.4. Definitions and Assumptions
- 2. Executive Summary
- 2.1. Introduction
- 3. Market Dynamics
- 3.1. Introduction
- 3.2. Market Drivers
- 3.2.1. ; Rise of Miniaturization Trend
- 3.3. Market Restrains
- 3.3.1. Operational Challenges Involving Cross-border Payments
- 3.4. Market Trends
- 3.4.1. Healthcare Industry Holds the Significant Share in the Market
- 4. Market Factor Analysis
- 4.1. Porters Five Forces
- 4.2. Supply/Value Chain
- 4.3. PESTEL analysis
- 4.4. Market Entropy
- 4.5. Patent/Trademark Analysis
- 5. Global Nano Biosensors Industry Analysis, Insights and Forecast, 2019-2031
- 5.1. Market Analysis, Insights and Forecast - by Type (Qualitative Analysis)
- 5.1.1. Optical Sensor
- 5.1.2. Electrochemical Sensor
- 5.1.3. Acoustic Sensor
- 5.1.4. Other Types
- 5.2. Market Analysis, Insights and Forecast - by End-user Vertical
- 5.2.1. Healthcare
- 5.2.2. Food & Beverage
- 5.2.3. Other End-use Verticals
- 5.3. Market Analysis, Insights and Forecast - by Region
- 5.3.1. North America
- 5.3.2. Europe
- 5.3.3. Asia Pacific
- 5.3.4. Rest of the World
- 5.1. Market Analysis, Insights and Forecast - by Type (Qualitative Analysis)
- 6. North America Nano Biosensors Industry Analysis, Insights and Forecast, 2019-2031
- 6.1. Market Analysis, Insights and Forecast - by Type (Qualitative Analysis)
- 6.1.1. Optical Sensor
- 6.1.2. Electrochemical Sensor
- 6.1.3. Acoustic Sensor
- 6.1.4. Other Types
- 6.2. Market Analysis, Insights and Forecast - by End-user Vertical
- 6.2.1. Healthcare
- 6.2.2. Food & Beverage
- 6.2.3. Other End-use Verticals
- 6.1. Market Analysis, Insights and Forecast - by Type (Qualitative Analysis)
- 7. Europe Nano Biosensors Industry Analysis, Insights and Forecast, 2019-2031
- 7.1. Market Analysis, Insights and Forecast - by Type (Qualitative Analysis)
- 7.1.1. Optical Sensor
- 7.1.2. Electrochemical Sensor
- 7.1.3. Acoustic Sensor
- 7.1.4. Other Types
- 7.2. Market Analysis, Insights and Forecast - by End-user Vertical
- 7.2.1. Healthcare
- 7.2.2. Food & Beverage
- 7.2.3. Other End-use Verticals
- 7.1. Market Analysis, Insights and Forecast - by Type (Qualitative Analysis)
- 8. Asia Pacific Nano Biosensors Industry Analysis, Insights and Forecast, 2019-2031
- 8.1. Market Analysis, Insights and Forecast - by Type (Qualitative Analysis)
- 8.1.1. Optical Sensor
- 8.1.2. Electrochemical Sensor
- 8.1.3. Acoustic Sensor
- 8.1.4. Other Types
- 8.2. Market Analysis, Insights and Forecast - by End-user Vertical
- 8.2.1. Healthcare
- 8.2.2. Food & Beverage
- 8.2.3. Other End-use Verticals
- 8.1. Market Analysis, Insights and Forecast - by Type (Qualitative Analysis)
- 9. Rest of the World Nano Biosensors Industry Analysis, Insights and Forecast, 2019-2031
- 9.1. Market Analysis, Insights and Forecast - by Type (Qualitative Analysis)
- 9.1.1. Optical Sensor
- 9.1.2. Electrochemical Sensor
- 9.1.3. Acoustic Sensor
- 9.1.4. Other Types
- 9.2. Market Analysis, Insights and Forecast - by End-user Vertical
- 9.2.1. Healthcare
- 9.2.2. Food & Beverage
- 9.2.3. Other End-use Verticals
- 9.1. Market Analysis, Insights and Forecast - by Type (Qualitative Analysis)
- 10. North America Nano Biosensors Industry Analysis, Insights and Forecast, 2019-2031
- 10.1. Market Analysis, Insights and Forecast - By Country/Sub-region
- 10.1.1. undefined
- 11. Europe Nano Biosensors Industry Analysis, Insights and Forecast, 2019-2031
- 11.1. Market Analysis, Insights and Forecast - By Country/Sub-region
- 11.1.1. undefined
- 12. Asia Pacific Nano Biosensors Industry Analysis, Insights and Forecast, 2019-2031
- 12.1. Market Analysis, Insights and Forecast - By Country/Sub-region
- 12.1.1. undefined
- 13. South America Nano Biosensors Industry Analysis, Insights and Forecast, 2019-2031
- 13.1. Market Analysis, Insights and Forecast - By Country/Sub-region
- 13.1.1. undefined
- 14. North America Nano Biosensors Industry Analysis, Insights and Forecast, 2019-2031
- 14.1. Market Analysis, Insights and Forecast - By Country/Sub-region
- 14.1.1. undefined
- 15. MEA Nano Biosensors Industry Analysis, Insights and Forecast, 2019-2031
- 15.1. Market Analysis, Insights and Forecast - By Country/Sub-region
- 15.1.1. undefined
- 16. Competitive Analysis
- 16.1. Global Market Share Analysis 2024
- 16.2. Company Profiles
- 16.2.1 GBS Inc
- 16.2.1.1. Overview
- 16.2.1.2. Products
- 16.2.1.3. SWOT Analysis
- 16.2.1.4. Recent Developments
- 16.2.1.5. Financials (Based on Availability)
- 16.2.2 AerBetic
- 16.2.2.1. Overview
- 16.2.2.2. Products
- 16.2.2.3. SWOT Analysis
- 16.2.2.4. Recent Developments
- 16.2.2.5. Financials (Based on Availability)
- 16.2.3 Nanowear Inc
- 16.2.3.1. Overview
- 16.2.3.2. Products
- 16.2.3.3. SWOT Analysis
- 16.2.3.4. Recent Developments
- 16.2.3.5. Financials (Based on Availability)
- 16.2.4 Agilent Technologies Inc
- 16.2.4.1. Overview
- 16.2.4.2. Products
- 16.2.4.3. SWOT Analysis
- 16.2.4.4. Recent Developments
- 16.2.4.5. Financials (Based on Availability)
- 16.2.5 ACON Laboratories Inc
- 16.2.5.1. Overview
- 16.2.5.2. Products
- 16.2.5.3. SWOT Analysis
- 16.2.5.4. Recent Developments
- 16.2.5.5. Financials (Based on Availability)
- 16.2.6 Instant NanoBiosensors Co Ltd
- 16.2.6.1. Overview
- 16.2.6.2. Products
- 16.2.6.3. SWOT Analysis
- 16.2.6.4. Recent Developments
- 16.2.6.5. Financials (Based on Availability)
- 16.2.7 Vista Therapeutics Inc
- 16.2.7.1. Overview
- 16.2.7.2. Products
- 16.2.7.3. SWOT Analysis
- 16.2.7.4. Recent Developments
- 16.2.7.5. Financials (Based on Availability)
- 16.2.8 Abbott Point of Care Inc
- 16.2.8.1. Overview
- 16.2.8.2. Products
- 16.2.8.3. SWOT Analysis
- 16.2.8.4. Recent Developments
- 16.2.8.5. Financials (Based on Availability)
- 16.2.9 Bruker Corporation
- 16.2.9.1. Overview
- 16.2.9.2. Products
- 16.2.9.3. SWOT Analysis
- 16.2.9.4. Recent Developments
- 16.2.9.5. Financials (Based on Availability)
- 16.2.10 LamdaGen Corporation
- 16.2.10.1. Overview
- 16.2.10.2. Products
- 16.2.10.3. SWOT Analysis
- 16.2.10.4. Recent Developments
- 16.2.10.5. Financials (Based on Availability)
- 16.2.1 GBS Inc
List of Figures
- Figure 1: Global Nano Biosensors Industry Revenue Breakdown (Million, %) by Region 2024 & 2032
- Figure 2: Global Nano Biosensors Industry Volume Breakdown (K Unit, %) by Region 2024 & 2032
- Figure 3: North America Nano Biosensors Industry Revenue (Million), by Country 2024 & 2032
- Figure 4: North America Nano Biosensors Industry Volume (K Unit), by Country 2024 & 2032
- Figure 5: North America Nano Biosensors Industry Revenue Share (%), by Country 2024 & 2032
- Figure 6: North America Nano Biosensors Industry Volume Share (%), by Country 2024 & 2032
- Figure 7: Europe Nano Biosensors Industry Revenue (Million), by Country 2024 & 2032
- Figure 8: Europe Nano Biosensors Industry Volume (K Unit), by Country 2024 & 2032
- Figure 9: Europe Nano Biosensors Industry Revenue Share (%), by Country 2024 & 2032
- Figure 10: Europe Nano Biosensors Industry Volume Share (%), by Country 2024 & 2032
- Figure 11: Asia Pacific Nano Biosensors Industry Revenue (Million), by Country 2024 & 2032
- Figure 12: Asia Pacific Nano Biosensors Industry Volume (K Unit), by Country 2024 & 2032
- Figure 13: Asia Pacific Nano Biosensors Industry Revenue Share (%), by Country 2024 & 2032
- Figure 14: Asia Pacific Nano Biosensors Industry Volume Share (%), by Country 2024 & 2032
- Figure 15: South America Nano Biosensors Industry Revenue (Million), by Country 2024 & 2032
- Figure 16: South America Nano Biosensors Industry Volume (K Unit), by Country 2024 & 2032
- Figure 17: South America Nano Biosensors Industry Revenue Share (%), by Country 2024 & 2032
- Figure 18: South America Nano Biosensors Industry Volume Share (%), by Country 2024 & 2032
- Figure 19: North America Nano Biosensors Industry Revenue (Million), by Country 2024 & 2032
- Figure 20: North America Nano Biosensors Industry Volume (K Unit), by Country 2024 & 2032
- Figure 21: North America Nano Biosensors Industry Revenue Share (%), by Country 2024 & 2032
- Figure 22: North America Nano Biosensors Industry Volume Share (%), by Country 2024 & 2032
- Figure 23: MEA Nano Biosensors Industry Revenue (Million), by Country 2024 & 2032
- Figure 24: MEA Nano Biosensors Industry Volume (K Unit), by Country 2024 & 2032
- Figure 25: MEA Nano Biosensors Industry Revenue Share (%), by Country 2024 & 2032
- Figure 26: MEA Nano Biosensors Industry Volume Share (%), by Country 2024 & 2032
- Figure 27: North America Nano Biosensors Industry Revenue (Million), by Type (Qualitative Analysis) 2024 & 2032
- Figure 28: North America Nano Biosensors Industry Volume (K Unit), by Type (Qualitative Analysis) 2024 & 2032
- Figure 29: North America Nano Biosensors Industry Revenue Share (%), by Type (Qualitative Analysis) 2024 & 2032
- Figure 30: North America Nano Biosensors Industry Volume Share (%), by Type (Qualitative Analysis) 2024 & 2032
- Figure 31: North America Nano Biosensors Industry Revenue (Million), by End-user Vertical 2024 & 2032
- Figure 32: North America Nano Biosensors Industry Volume (K Unit), by End-user Vertical 2024 & 2032
- Figure 33: North America Nano Biosensors Industry Revenue Share (%), by End-user Vertical 2024 & 2032
- Figure 34: North America Nano Biosensors Industry Volume Share (%), by End-user Vertical 2024 & 2032
- Figure 35: North America Nano Biosensors Industry Revenue (Million), by Country 2024 & 2032
- Figure 36: North America Nano Biosensors Industry Volume (K Unit), by Country 2024 & 2032
- Figure 37: North America Nano Biosensors Industry Revenue Share (%), by Country 2024 & 2032
- Figure 38: North America Nano Biosensors Industry Volume Share (%), by Country 2024 & 2032
- Figure 39: Europe Nano Biosensors Industry Revenue (Million), by Type (Qualitative Analysis) 2024 & 2032
- Figure 40: Europe Nano Biosensors Industry Volume (K Unit), by Type (Qualitative Analysis) 2024 & 2032
- Figure 41: Europe Nano Biosensors Industry Revenue Share (%), by Type (Qualitative Analysis) 2024 & 2032
- Figure 42: Europe Nano Biosensors Industry Volume Share (%), by Type (Qualitative Analysis) 2024 & 2032
- Figure 43: Europe Nano Biosensors Industry Revenue (Million), by End-user Vertical 2024 & 2032
- Figure 44: Europe Nano Biosensors Industry Volume (K Unit), by End-user Vertical 2024 & 2032
- Figure 45: Europe Nano Biosensors Industry Revenue Share (%), by End-user Vertical 2024 & 2032
- Figure 46: Europe Nano Biosensors Industry Volume Share (%), by End-user Vertical 2024 & 2032
- Figure 47: Europe Nano Biosensors Industry Revenue (Million), by Country 2024 & 2032
- Figure 48: Europe Nano Biosensors Industry Volume (K Unit), by Country 2024 & 2032
- Figure 49: Europe Nano Biosensors Industry Revenue Share (%), by Country 2024 & 2032
- Figure 50: Europe Nano Biosensors Industry Volume Share (%), by Country 2024 & 2032
- Figure 51: Asia Pacific Nano Biosensors Industry Revenue (Million), by Type (Qualitative Analysis) 2024 & 2032
- Figure 52: Asia Pacific Nano Biosensors Industry Volume (K Unit), by Type (Qualitative Analysis) 2024 & 2032
- Figure 53: Asia Pacific Nano Biosensors Industry Revenue Share (%), by Type (Qualitative Analysis) 2024 & 2032
- Figure 54: Asia Pacific Nano Biosensors Industry Volume Share (%), by Type (Qualitative Analysis) 2024 & 2032
- Figure 55: Asia Pacific Nano Biosensors Industry Revenue (Million), by End-user Vertical 2024 & 2032
- Figure 56: Asia Pacific Nano Biosensors Industry Volume (K Unit), by End-user Vertical 2024 & 2032
- Figure 57: Asia Pacific Nano Biosensors Industry Revenue Share (%), by End-user Vertical 2024 & 2032
- Figure 58: Asia Pacific Nano Biosensors Industry Volume Share (%), by End-user Vertical 2024 & 2032
- Figure 59: Asia Pacific Nano Biosensors Industry Revenue (Million), by Country 2024 & 2032
- Figure 60: Asia Pacific Nano Biosensors Industry Volume (K Unit), by Country 2024 & 2032
- Figure 61: Asia Pacific Nano Biosensors Industry Revenue Share (%), by Country 2024 & 2032
- Figure 62: Asia Pacific Nano Biosensors Industry Volume Share (%), by Country 2024 & 2032
- Figure 63: Rest of the World Nano Biosensors Industry Revenue (Million), by Type (Qualitative Analysis) 2024 & 2032
- Figure 64: Rest of the World Nano Biosensors Industry Volume (K Unit), by Type (Qualitative Analysis) 2024 & 2032
- Figure 65: Rest of the World Nano Biosensors Industry Revenue Share (%), by Type (Qualitative Analysis) 2024 & 2032
- Figure 66: Rest of the World Nano Biosensors Industry Volume Share (%), by Type (Qualitative Analysis) 2024 & 2032
- Figure 67: Rest of the World Nano Biosensors Industry Revenue (Million), by End-user Vertical 2024 & 2032
- Figure 68: Rest of the World Nano Biosensors Industry Volume (K Unit), by End-user Vertical 2024 & 2032
- Figure 69: Rest of the World Nano Biosensors Industry Revenue Share (%), by End-user Vertical 2024 & 2032
- Figure 70: Rest of the World Nano Biosensors Industry Volume Share (%), by End-user Vertical 2024 & 2032
- Figure 71: Rest of the World Nano Biosensors Industry Revenue (Million), by Country 2024 & 2032
- Figure 72: Rest of the World Nano Biosensors Industry Volume (K Unit), by Country 2024 & 2032
- Figure 73: Rest of the World Nano Biosensors Industry Revenue Share (%), by Country 2024 & 2032
- Figure 74: Rest of the World Nano Biosensors Industry Volume Share (%), by Country 2024 & 2032
List of Tables
- Table 1: Global Nano Biosensors Industry Revenue Million Forecast, by Region 2019 & 2032
- Table 2: Global Nano Biosensors Industry Volume K Unit Forecast, by Region 2019 & 2032
- Table 3: Global Nano Biosensors Industry Revenue Million Forecast, by Type (Qualitative Analysis) 2019 & 2032
- Table 4: Global Nano Biosensors Industry Volume K Unit Forecast, by Type (Qualitative Analysis) 2019 & 2032
- Table 5: Global Nano Biosensors Industry Revenue Million Forecast, by End-user Vertical 2019 & 2032
- Table 6: Global Nano Biosensors Industry Volume K Unit Forecast, by End-user Vertical 2019 & 2032
- Table 7: Global Nano Biosensors Industry Revenue Million Forecast, by Region 2019 & 2032
- Table 8: Global Nano Biosensors Industry Volume K Unit Forecast, by Region 2019 & 2032
- Table 9: Global Nano Biosensors Industry Revenue Million Forecast, by Country 2019 & 2032
- Table 10: Global Nano Biosensors Industry Volume K Unit Forecast, by Country 2019 & 2032
- Table 11: Global Nano Biosensors Industry Revenue Million Forecast, by Country 2019 & 2032
- Table 12: Global Nano Biosensors Industry Volume K Unit Forecast, by Country 2019 & 2032
- Table 13: Global Nano Biosensors Industry Revenue Million Forecast, by Country 2019 & 2032
- Table 14: Global Nano Biosensors Industry Volume K Unit Forecast, by Country 2019 & 2032
- Table 15: Global Nano Biosensors Industry Revenue Million Forecast, by Country 2019 & 2032
- Table 16: Global Nano Biosensors Industry Volume K Unit Forecast, by Country 2019 & 2032
- Table 17: Global Nano Biosensors Industry Revenue Million Forecast, by Country 2019 & 2032
- Table 18: Global Nano Biosensors Industry Volume K Unit Forecast, by Country 2019 & 2032
- Table 19: Global Nano Biosensors Industry Revenue Million Forecast, by Country 2019 & 2032
- Table 20: Global Nano Biosensors Industry Volume K Unit Forecast, by Country 2019 & 2032
- Table 21: Global Nano Biosensors Industry Revenue Million Forecast, by Type (Qualitative Analysis) 2019 & 2032
- Table 22: Global Nano Biosensors Industry Volume K Unit Forecast, by Type (Qualitative Analysis) 2019 & 2032
- Table 23: Global Nano Biosensors Industry Revenue Million Forecast, by End-user Vertical 2019 & 2032
- Table 24: Global Nano Biosensors Industry Volume K Unit Forecast, by End-user Vertical 2019 & 2032
- Table 25: Global Nano Biosensors Industry Revenue Million Forecast, by Country 2019 & 2032
- Table 26: Global Nano Biosensors Industry Volume K Unit Forecast, by Country 2019 & 2032
- Table 27: Global Nano Biosensors Industry Revenue Million Forecast, by Type (Qualitative Analysis) 2019 & 2032
- Table 28: Global Nano Biosensors Industry Volume K Unit Forecast, by Type (Qualitative Analysis) 2019 & 2032
- Table 29: Global Nano Biosensors Industry Revenue Million Forecast, by End-user Vertical 2019 & 2032
- Table 30: Global Nano Biosensors Industry Volume K Unit Forecast, by End-user Vertical 2019 & 2032
- Table 31: Global Nano Biosensors Industry Revenue Million Forecast, by Country 2019 & 2032
- Table 32: Global Nano Biosensors Industry Volume K Unit Forecast, by Country 2019 & 2032
- Table 33: Global Nano Biosensors Industry Revenue Million Forecast, by Type (Qualitative Analysis) 2019 & 2032
- Table 34: Global Nano Biosensors Industry Volume K Unit Forecast, by Type (Qualitative Analysis) 2019 & 2032
- Table 35: Global Nano Biosensors Industry Revenue Million Forecast, by End-user Vertical 2019 & 2032
- Table 36: Global Nano Biosensors Industry Volume K Unit Forecast, by End-user Vertical 2019 & 2032
- Table 37: Global Nano Biosensors Industry Revenue Million Forecast, by Country 2019 & 2032
- Table 38: Global Nano Biosensors Industry Volume K Unit Forecast, by Country 2019 & 2032
- Table 39: Global Nano Biosensors Industry Revenue Million Forecast, by Type (Qualitative Analysis) 2019 & 2032
- Table 40: Global Nano Biosensors Industry Volume K Unit Forecast, by Type (Qualitative Analysis) 2019 & 2032
- Table 41: Global Nano Biosensors Industry Revenue Million Forecast, by End-user Vertical 2019 & 2032
- Table 42: Global Nano Biosensors Industry Volume K Unit Forecast, by End-user Vertical 2019 & 2032
- Table 43: Global Nano Biosensors Industry Revenue Million Forecast, by Country 2019 & 2032
- Table 44: Global Nano Biosensors Industry Volume K Unit Forecast, by Country 2019 & 2032
Frequently Asked Questions
1. What is the projected Compound Annual Growth Rate (CAGR) of the Nano Biosensors Industry?
The projected CAGR is approximately 10.00%.
2. Which companies are prominent players in the Nano Biosensors Industry?
Key companies in the market include GBS Inc , AerBetic, Nanowear Inc, Agilent Technologies Inc, ACON Laboratories Inc, Instant NanoBiosensors Co Ltd, Vista Therapeutics Inc, Abbott Point of Care Inc, Bruker Corporation, LamdaGen Corporation.
3. What are the main segments of the Nano Biosensors Industry?
The market segments include Type (Qualitative Analysis), End-user Vertical .
4. Can you provide details about the market size?
The market size is estimated to be USD XX Million as of 2022.
5. What are some drivers contributing to market growth?
; Rise of Miniaturization Trend.
6. What are the notable trends driving market growth?
Healthcare Industry Holds the Significant Share in the Market.
7. Are there any restraints impacting market growth?
Operational Challenges Involving Cross-border Payments.
8. Can you provide examples of recent developments in the market?
N/A
9. What pricing options are available for accessing the report?
Pricing options include single-user, multi-user, and enterprise licenses priced at USD 4750, USD 5250, and USD 8750 respectively.
10. Is the market size provided in terms of value or volume?
The market size is provided in terms of value, measured in Million and volume, measured in K Unit.
11. Are there any specific market keywords associated with the report?
Yes, the market keyword associated with the report is "Nano Biosensors Industry," which aids in identifying and referencing the specific market segment covered.
12. How do I determine which pricing option suits my needs best?
The pricing options vary based on user requirements and access needs. Individual users may opt for single-user licenses, while businesses requiring broader access may choose multi-user or enterprise licenses for cost-effective access to the report.
13. Are there any additional resources or data provided in the Nano Biosensors Industry report?
While the report offers comprehensive insights, it's advisable to review the specific contents or supplementary materials provided to ascertain if additional resources or data are available.
14. How can I stay updated on further developments or reports in the Nano Biosensors Industry?
To stay informed about further developments, trends, and reports in the Nano Biosensors Industry, consider subscribing to industry newsletters, following relevant companies and organizations, or regularly checking reputable industry news sources and publications.
Methodology
Step 1 - Identification of Relevant Samples Size from Population Database


Step 2 - Approaches for Defining Global Market Size (Value, Volume* & Price*)

Note*: In applicable scenarios
Step 3 - Data Sources
Primary Research
- Web Analytics
- Survey Reports
- Research Institute
- Latest Research Reports
- Opinion Leaders
Secondary Research
- Annual Reports
- White Paper
- Latest Press Release
- Industry Association
- Paid Database
- Investor Presentations

Step 4 - Data Triangulation
Involves using different sources of information in order to increase the validity of a study
These sources are likely to be stakeholders in a program - participants, other researchers, program staff, other community members, and so on.
Then we put all data in single framework & apply various statistical tools to find out the dynamic on the market.
During the analysis stage, feedback from the stakeholder groups would be compared to determine areas of agreement as well as areas of divergence
