

Key Insights
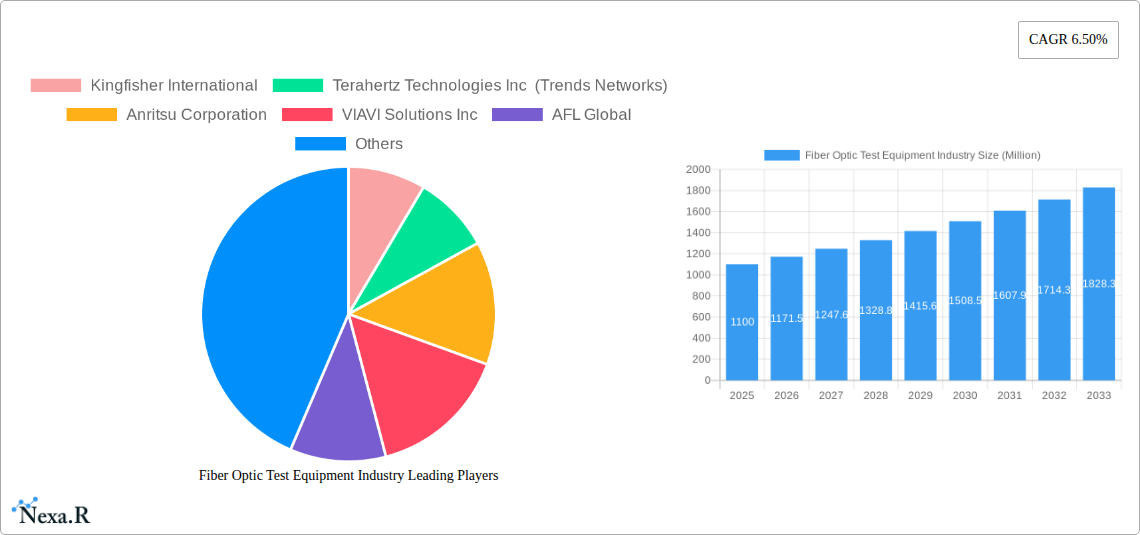
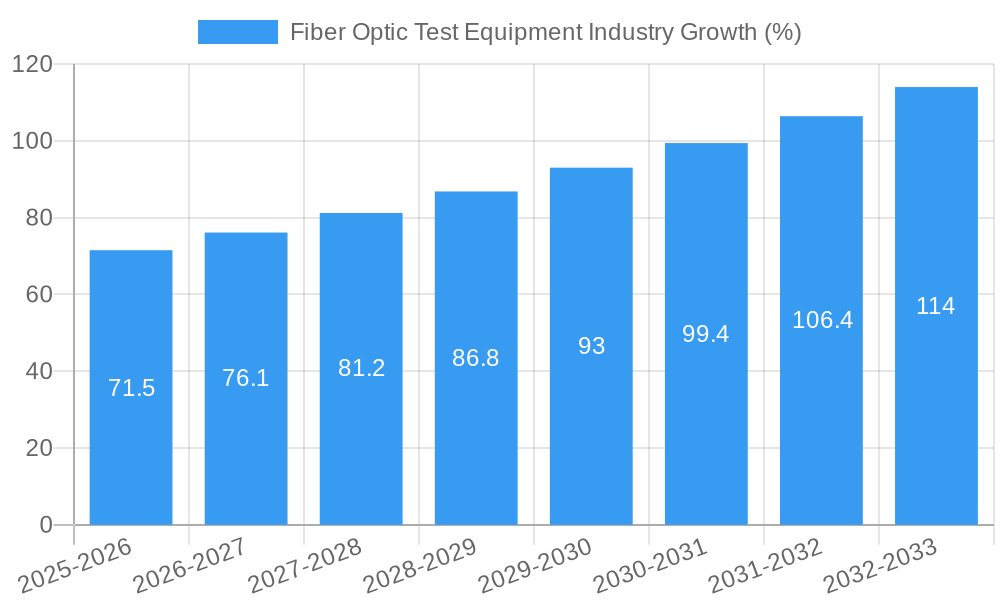
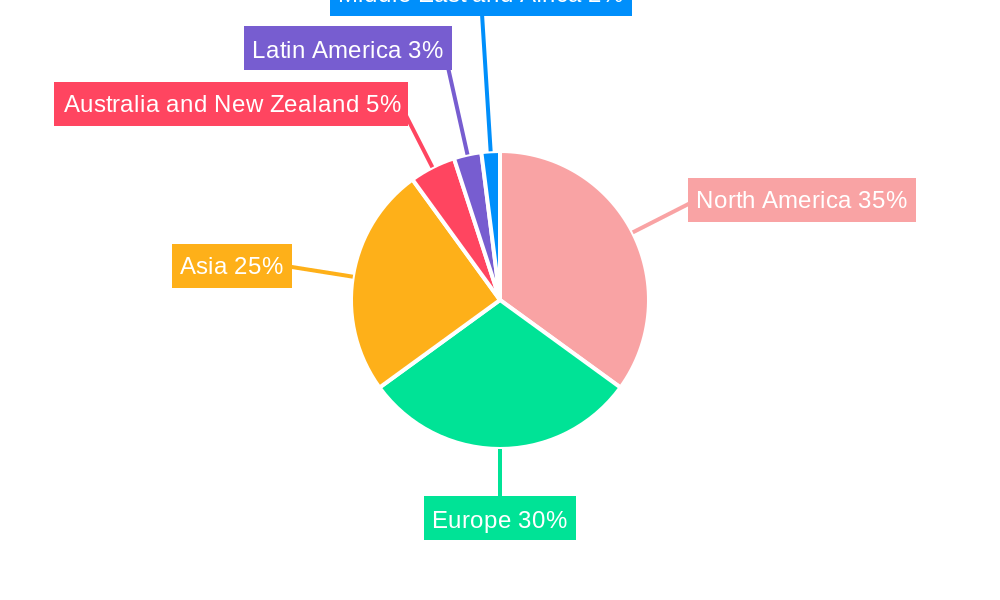
The Fiber Optic Test Equipment market, valued at $1.10 billion in 2025, is poised for robust growth, exhibiting a Compound Annual Growth Rate (CAGR) of 6.50% from 2025 to 2033. This expansion is fueled by the escalating demand for high-speed internet access, the proliferation of data centers supporting cloud computing, and the continuous expansion of 5G and fiber-to-the-X (FTTx) networks globally. Key drivers include the increasing need for reliable network infrastructure testing and maintenance, the growing adoption of advanced testing technologies like Optical Spectrum Analyzers and Optical Time Domain Reflectometers, and the rising investments in infrastructure projects across various sectors, including telecommunications, data centers, and industries. The market is segmented by equipment type (Optical Light Sources, Optical Power and Loss Meters, OTDRs, Optical Spectrum Analyzers, Remote Fiber Test Systems, and others) and end-user application (Telecommunications, Data Centers, Industries, and others). North America and Europe currently hold significant market shares, driven by early adoption of advanced technologies and robust telecom infrastructure. However, the Asia-Pacific region is projected to witness the fastest growth due to substantial investments in infrastructure development and expanding data center capacities in countries like China and India. Competitive dynamics are shaped by established players like VIAVI Solutions, Anritsu, and Fluke Networks, alongside emerging companies focusing on specialized solutions and innovative technologies.
The restraining factors currently impacting growth include the high initial investment cost associated with fiber optic test equipment, the complexity of certain technologies that require specialized training, and potential supply chain disruptions. However, these challenges are anticipated to be offset by technological advancements leading to more cost-effective and user-friendly solutions. The increasing demand for automation and remote testing capabilities is driving innovation in the market, leading to the development of software-defined solutions and cloud-based testing platforms. This trend is expected to boost the market's expansion further, contributing to the overall sustained growth forecast for the next decade. The diverse applications across various industries and the growing emphasis on network monitoring and optimization create a positive outlook for the fiber optic test equipment market, promising consistent growth in the coming years.
Fiber Optic Test Equipment Industry Market Report: 2019-2033
This comprehensive report provides an in-depth analysis of the Fiber Optic Test Equipment market, encompassing market dynamics, growth trends, regional dominance, product landscape, key challenges, emerging opportunities, and key players. The study period spans from 2019 to 2033, with 2025 serving as the base and estimated year. The report caters to industry professionals, investors, and researchers seeking a complete understanding of this dynamic sector. The market is segmented by equipment type (Optical Light Sources, Optical Power and Loss Meters, Optical Time Domain Reflectometer, Optical Spectrum Analyzers, Remote Fiber Test System, Other Equipment Types) and end-user application (Telecommunications, Data Centers, Industries, Other End-user Applications).
Fiber Optic Test Equipment Industry Market Dynamics & Structure
The fiber optic test equipment market is characterized by moderate concentration, with key players like VIAVI Solutions Inc, Anritsu Corporation, and EXFO Inc holding significant market share. However, the emergence of smaller, specialized firms like VeEX Inc and Pelorus Technologies Pvt Ltd is fostering competition and innovation. Technological advancements, particularly in 5G and high-speed data transmission, are primary growth drivers. Stringent regulatory frameworks governing network performance and safety influence market dynamics. While there are no direct substitutes for specialized fiber optic test equipment, alternative testing methodologies may exist for certain applications. The market is witnessing a rise in M&A activity, with larger companies acquiring smaller firms to expand their product portfolios and technological capabilities.
- Market Concentration: Moderately concentrated, with top 5 players holding approximately xx% market share in 2024.
- Technological Innovation: Driven by advancements in 5G, 800G, and high-speed data transmission technologies.
- Regulatory Frameworks: Stringent standards for network performance and safety compliance impact market growth.
- M&A Activity: xx major mergers and acquisitions recorded between 2019 and 2024, indicating consolidation trends.
- Innovation Barriers: High R&D costs and the need for specialized expertise create entry barriers for new players.
Fiber Optic Test Equipment Industry Growth Trends & Insights
The global fiber optic test equipment market experienced significant growth during the historical period (2019-2024), driven by the expansion of fiber optic infrastructure for 5G deployments, data centers, and industrial applications. The market size is projected to reach xx million units by 2025 and is expected to maintain a healthy CAGR of xx% during the forecast period (2025-2033). This growth is fueled by increasing data consumption, the growing adoption of cloud computing and the Internet of Things (IoT), and the ongoing migration to high-bandwidth applications. Technological disruptions, such as the development of advanced test modules for 800G networks, are accelerating market expansion. Consumer behavior shifts towards high-speed connectivity and improved network reliability further underpin market growth.
Dominant Regions, Countries, or Segments in Fiber Optic Test Equipment Industry
North America and Asia-Pacific currently dominate the fiber optic test equipment market, driven by robust telecommunications infrastructure development, substantial investments in data centers, and the rapid expansion of 5G networks. Within the equipment type segment, Optical Time Domain Reflectometers (OTDRs) and Optical Spectrum Analyzers (OSAs) represent significant market shares due to their indispensable role in network installation and maintenance. The telecommunications sector remains the largest end-user application segment, fueled by continuous network upgrades and expansion.
- Key Drivers:
- North America: High investments in 5G infrastructure and data center expansion.
- Asia-Pacific: Rapid growth in telecommunications and data center deployments, particularly in China and India.
- Europe: Expanding fiber optic networks and increasing adoption of high-speed internet services.
- Dominant Segments:
- By Equipment Type: Optical Time Domain Reflectometers (OTDRs) and Optical Spectrum Analyzers (OSAs) hold the largest market share.
- By End-user Application: Telecommunications sector continues to be the dominant end-user, followed by Data Centers.
Fiber Optic Test Equipment Industry Product Landscape
Recent innovations in fiber optic test equipment focus on enhanced speed, portability, and versatility. Advanced features such as automated testing capabilities, integrated software solutions, and support for emerging technologies (e.g., 800G) are key selling points. Manufacturers are emphasizing user-friendly interfaces and improved diagnostic tools to simplify testing procedures and reduce downtime. The trend is towards smaller, more portable devices capable of handling high-speed data transmission tests.
Key Drivers, Barriers & Challenges in Fiber Optic Test Equipment Industry
Key Drivers:
- Expanding global fiber optic infrastructure for 5G and high-speed internet.
- Increasing demand for high-bandwidth applications in data centers and industries.
- Government initiatives promoting digital transformation and infrastructure development.
Key Challenges:
- Intense competition among established players and emerging technologies.
- High R&D costs associated with developing cutting-edge test equipment.
- Supply chain disruptions impacting the availability of critical components.
Emerging Opportunities in Fiber Optic Test Equipment Industry
Untapped markets in developing economies, increasing adoption of fiber optics in various industries (e.g., healthcare, automotive), and the rising demand for cost-effective testing solutions present significant opportunities. Innovative applications in areas like submarine cable testing and optical sensor technology offer substantial growth potential.
Growth Accelerators in the Fiber Optic Test Equipment Industry Industry
Technological advancements like the development of 800G test modules are driving growth. Strategic partnerships between equipment manufacturers and telecommunications companies are further accelerating market expansion. The increasing focus on network automation and remote testing solutions also contributes to long-term growth prospects.
Key Players Shaping the Fiber Optic Test Equipment Industry Market
- Kingfisher International
- Terahertz Technologies Inc (Trends Networks)
- Anritsu Corporation
- VIAVI Solutions Inc
- AFL Global
- Pelorus Technologies Pvt Ltd
- EXFO Inc
- Yokogawa Electric Corporation
- AMS Technologies A
- Deviser Instruments
- Fluke Networks
- VeEX Inc
Notable Milestones in Fiber Optic Test Equipment Industry Sector
- March 2024: VeEX Inc. unveiled the RXT-6800 Advanced 800G Multiservice test module, setting a new standard for portable 800G testing.
- February 2024: Anritsu Corporation and MediaTek validated advanced 3TX technology in MediaTek's M80 5G modem using Anritsu's MT8000A test station, signifying progress in 5G testing capabilities.
In-Depth Fiber Optic Test Equipment Industry Market Outlook
The fiber optic test equipment market is poised for substantial growth, driven by ongoing technological advancements, expanding global fiber optic infrastructure, and the increasing demand for higher bandwidth and faster data transmission. Strategic partnerships, innovations in testing methodologies, and expansion into emerging markets will be crucial for realizing the full market potential. The focus on developing user-friendly, portable, and cost-effective solutions will be key to success in this competitive landscape.
Fiber Optic Test Equipment Industry Segmentation
-
1. Equipment Type
- 1.1. Optical Light Sources
- 1.2. Optical Power and Loss Meters
- 1.3. Optical Time Domain Reflectometer
- 1.4. Optical Spectrum Analyzers
- 1.5. Remote Fiber Test System
- 1.6. Other Equipment Types
-
2. End-user Application
- 2.1. Telecommunications
- 2.2. Data Centers
- 2.3. Industries
- 2.4. Other End-user Applications
Fiber Optic Test Equipment Industry Segmentation By Geography
-
1. North America
- 1.1. United States
- 1.2. Canada
-
2. Europe
- 2.1. Germany
- 2.2. United Kingdom
- 2.3. France
-
3. Asia
- 3.1. China
- 3.2. Japan
- 3.3. India
- 4. Australia and New Zealand
-
5. Latin America
- 5.1. Brazil
- 5.2. Argentina
- 5.3. Mexico
-
6. Middle East and Africa
- 6.1. United Arab Emirates
- 6.2. South Africa
Fiber Optic Test Equipment Industry REPORT HIGHLIGHTS
| Aspects | Details |
|---|---|
| Study Period | 2019-2033 |
| Base Year | 2024 |
| Estimated Year | 2025 |
| Forecast Period | 2025-2033 |
| Historical Period | 2019-2024 |
| Growth Rate | CAGR of 6.50% from 2019-2033 |
| Segmentation |
|
Table of Contents
- 1. Introduction
- 1.1. Research Scope
- 1.2. Market Segmentation
- 1.3. Research Methodology
- 1.4. Definitions and Assumptions
- 2. Executive Summary
- 2.1. Introduction
- 3. Market Dynamics
- 3.1. Introduction
- 3.2. Market Drivers
- 3.2.1 Increasing Penetration of 5G/LTE Networks and Fixed Broadband Subscription; Growing Adoption of fiber optic networks for power and utility management
- 3.2.2 Security
- 3.2.3 and Communication
- 3.3. Market Restrains
- 3.3.1. High Cost of Testers and Fiber Optic Test Equipment; Lack of Awareness and Technical Knowledge
- 3.4. Market Trends
- 3.4.1. Telecommunications to Witness Significant Growth
- 4. Market Factor Analysis
- 4.1. Porters Five Forces
- 4.2. Supply/Value Chain
- 4.3. PESTEL analysis
- 4.4. Market Entropy
- 4.5. Patent/Trademark Analysis
- 5. Global Fiber Optic Test Equipment Industry Analysis, Insights and Forecast, 2019-2031
- 5.1. Market Analysis, Insights and Forecast - by Equipment Type
- 5.1.1. Optical Light Sources
- 5.1.2. Optical Power and Loss Meters
- 5.1.3. Optical Time Domain Reflectometer
- 5.1.4. Optical Spectrum Analyzers
- 5.1.5. Remote Fiber Test System
- 5.1.6. Other Equipment Types
- 5.2. Market Analysis, Insights and Forecast - by End-user Application
- 5.2.1. Telecommunications
- 5.2.2. Data Centers
- 5.2.3. Industries
- 5.2.4. Other End-user Applications
- 5.3. Market Analysis, Insights and Forecast - by Region
- 5.3.1. North America
- 5.3.2. Europe
- 5.3.3. Asia
- 5.3.4. Australia and New Zealand
- 5.3.5. Latin America
- 5.3.6. Middle East and Africa
- 5.1. Market Analysis, Insights and Forecast - by Equipment Type
- 6. North America Fiber Optic Test Equipment Industry Analysis, Insights and Forecast, 2019-2031
- 6.1. Market Analysis, Insights and Forecast - by Equipment Type
- 6.1.1. Optical Light Sources
- 6.1.2. Optical Power and Loss Meters
- 6.1.3. Optical Time Domain Reflectometer
- 6.1.4. Optical Spectrum Analyzers
- 6.1.5. Remote Fiber Test System
- 6.1.6. Other Equipment Types
- 6.2. Market Analysis, Insights and Forecast - by End-user Application
- 6.2.1. Telecommunications
- 6.2.2. Data Centers
- 6.2.3. Industries
- 6.2.4. Other End-user Applications
- 6.1. Market Analysis, Insights and Forecast - by Equipment Type
- 7. Europe Fiber Optic Test Equipment Industry Analysis, Insights and Forecast, 2019-2031
- 7.1. Market Analysis, Insights and Forecast - by Equipment Type
- 7.1.1. Optical Light Sources
- 7.1.2. Optical Power and Loss Meters
- 7.1.3. Optical Time Domain Reflectometer
- 7.1.4. Optical Spectrum Analyzers
- 7.1.5. Remote Fiber Test System
- 7.1.6. Other Equipment Types
- 7.2. Market Analysis, Insights and Forecast - by End-user Application
- 7.2.1. Telecommunications
- 7.2.2. Data Centers
- 7.2.3. Industries
- 7.2.4. Other End-user Applications
- 7.1. Market Analysis, Insights and Forecast - by Equipment Type
- 8. Asia Fiber Optic Test Equipment Industry Analysis, Insights and Forecast, 2019-2031
- 8.1. Market Analysis, Insights and Forecast - by Equipment Type
- 8.1.1. Optical Light Sources
- 8.1.2. Optical Power and Loss Meters
- 8.1.3. Optical Time Domain Reflectometer
- 8.1.4. Optical Spectrum Analyzers
- 8.1.5. Remote Fiber Test System
- 8.1.6. Other Equipment Types
- 8.2. Market Analysis, Insights and Forecast - by End-user Application
- 8.2.1. Telecommunications
- 8.2.2. Data Centers
- 8.2.3. Industries
- 8.2.4. Other End-user Applications
- 8.1. Market Analysis, Insights and Forecast - by Equipment Type
- 9. Australia and New Zealand Fiber Optic Test Equipment Industry Analysis, Insights and Forecast, 2019-2031
- 9.1. Market Analysis, Insights and Forecast - by Equipment Type
- 9.1.1. Optical Light Sources
- 9.1.2. Optical Power and Loss Meters
- 9.1.3. Optical Time Domain Reflectometer
- 9.1.4. Optical Spectrum Analyzers
- 9.1.5. Remote Fiber Test System
- 9.1.6. Other Equipment Types
- 9.2. Market Analysis, Insights and Forecast - by End-user Application
- 9.2.1. Telecommunications
- 9.2.2. Data Centers
- 9.2.3. Industries
- 9.2.4. Other End-user Applications
- 9.1. Market Analysis, Insights and Forecast - by Equipment Type
- 10. Latin America Fiber Optic Test Equipment Industry Analysis, Insights and Forecast, 2019-2031
- 10.1. Market Analysis, Insights and Forecast - by Equipment Type
- 10.1.1. Optical Light Sources
- 10.1.2. Optical Power and Loss Meters
- 10.1.3. Optical Time Domain Reflectometer
- 10.1.4. Optical Spectrum Analyzers
- 10.1.5. Remote Fiber Test System
- 10.1.6. Other Equipment Types
- 10.2. Market Analysis, Insights and Forecast - by End-user Application
- 10.2.1. Telecommunications
- 10.2.2. Data Centers
- 10.2.3. Industries
- 10.2.4. Other End-user Applications
- 10.1. Market Analysis, Insights and Forecast - by Equipment Type
- 11. Middle East and Africa Fiber Optic Test Equipment Industry Analysis, Insights and Forecast, 2019-2031
- 11.1. Market Analysis, Insights and Forecast - by Equipment Type
- 11.1.1. Optical Light Sources
- 11.1.2. Optical Power and Loss Meters
- 11.1.3. Optical Time Domain Reflectometer
- 11.1.4. Optical Spectrum Analyzers
- 11.1.5. Remote Fiber Test System
- 11.1.6. Other Equipment Types
- 11.2. Market Analysis, Insights and Forecast - by End-user Application
- 11.2.1. Telecommunications
- 11.2.2. Data Centers
- 11.2.3. Industries
- 11.2.4. Other End-user Applications
- 11.1. Market Analysis, Insights and Forecast - by Equipment Type
- 12. North America Fiber Optic Test Equipment Industry Analysis, Insights and Forecast, 2019-2031
- 12.1. Market Analysis, Insights and Forecast - By Country/Sub-region
- 12.1.1 United States
- 12.1.2 Canada
- 13. Europe Fiber Optic Test Equipment Industry Analysis, Insights and Forecast, 2019-2031
- 13.1. Market Analysis, Insights and Forecast - By Country/Sub-region
- 13.1.1 Germany
- 13.1.2 United Kingdom
- 13.1.3 France
- 14. Asia Fiber Optic Test Equipment Industry Analysis, Insights and Forecast, 2019-2031
- 14.1. Market Analysis, Insights and Forecast - By Country/Sub-region
- 14.1.1 China
- 14.1.2 Japan
- 14.1.3 India
- 15. Australia and New Zealand Fiber Optic Test Equipment Industry Analysis, Insights and Forecast, 2019-2031
- 15.1. Market Analysis, Insights and Forecast - By Country/Sub-region
- 15.1.1.
- 16. Latin America Fiber Optic Test Equipment Industry Analysis, Insights and Forecast, 2019-2031
- 16.1. Market Analysis, Insights and Forecast - By Country/Sub-region
- 16.1.1 Brazil
- 16.1.2 Argentina
- 16.1.3 Mexico
- 17. Middle East and Africa Fiber Optic Test Equipment Industry Analysis, Insights and Forecast, 2019-2031
- 17.1. Market Analysis, Insights and Forecast - By Country/Sub-region
- 17.1.1 United Arab Emirates
- 17.1.2 South Africa
- 18. Competitive Analysis
- 18.1. Global Market Share Analysis 2024
- 18.2. Company Profiles
- 18.2.1 Kingfisher International
- 18.2.1.1. Overview
- 18.2.1.2. Products
- 18.2.1.3. SWOT Analysis
- 18.2.1.4. Recent Developments
- 18.2.1.5. Financials (Based on Availability)
- 18.2.2 Terahertz Technologies Inc (Trends Networks)
- 18.2.2.1. Overview
- 18.2.2.2. Products
- 18.2.2.3. SWOT Analysis
- 18.2.2.4. Recent Developments
- 18.2.2.5. Financials (Based on Availability)
- 18.2.3 Anritsu Corporation
- 18.2.3.1. Overview
- 18.2.3.2. Products
- 18.2.3.3. SWOT Analysis
- 18.2.3.4. Recent Developments
- 18.2.3.5. Financials (Based on Availability)
- 18.2.4 VIAVI Solutions Inc
- 18.2.4.1. Overview
- 18.2.4.2. Products
- 18.2.4.3. SWOT Analysis
- 18.2.4.4. Recent Developments
- 18.2.4.5. Financials (Based on Availability)
- 18.2.5 AFL Global
- 18.2.5.1. Overview
- 18.2.5.2. Products
- 18.2.5.3. SWOT Analysis
- 18.2.5.4. Recent Developments
- 18.2.5.5. Financials (Based on Availability)
- 18.2.6 Pelorus Technologies Pvt Ltd
- 18.2.6.1. Overview
- 18.2.6.2. Products
- 18.2.6.3. SWOT Analysis
- 18.2.6.4. Recent Developments
- 18.2.6.5. Financials (Based on Availability)
- 18.2.7 EXFO Inc
- 18.2.7.1. Overview
- 18.2.7.2. Products
- 18.2.7.3. SWOT Analysis
- 18.2.7.4. Recent Developments
- 18.2.7.5. Financials (Based on Availability)
- 18.2.8 Yokogawa Electric Corporation
- 18.2.8.1. Overview
- 18.2.8.2. Products
- 18.2.8.3. SWOT Analysis
- 18.2.8.4. Recent Developments
- 18.2.8.5. Financials (Based on Availability)
- 18.2.9 AMS Technologies A
- 18.2.9.1. Overview
- 18.2.9.2. Products
- 18.2.9.3. SWOT Analysis
- 18.2.9.4. Recent Developments
- 18.2.9.5. Financials (Based on Availability)
- 18.2.10 Deviser Instruments
- 18.2.10.1. Overview
- 18.2.10.2. Products
- 18.2.10.3. SWOT Analysis
- 18.2.10.4. Recent Developments
- 18.2.10.5. Financials (Based on Availability)
- 18.2.11 Fluke Networks
- 18.2.11.1. Overview
- 18.2.11.2. Products
- 18.2.11.3. SWOT Analysis
- 18.2.11.4. Recent Developments
- 18.2.11.5. Financials (Based on Availability)
- 18.2.12 VeEX Inc
- 18.2.12.1. Overview
- 18.2.12.2. Products
- 18.2.12.3. SWOT Analysis
- 18.2.12.4. Recent Developments
- 18.2.12.5. Financials (Based on Availability)
- 18.2.1 Kingfisher International
List of Figures
- Figure 1: Global Fiber Optic Test Equipment Industry Revenue Breakdown (Million, %) by Region 2024 & 2032
- Figure 2: Global Fiber Optic Test Equipment Industry Volume Breakdown (K Unit, %) by Region 2024 & 2032
- Figure 3: North America Fiber Optic Test Equipment Industry Revenue (Million), by Country 2024 & 2032
- Figure 4: North America Fiber Optic Test Equipment Industry Volume (K Unit), by Country 2024 & 2032
- Figure 5: North America Fiber Optic Test Equipment Industry Revenue Share (%), by Country 2024 & 2032
- Figure 6: North America Fiber Optic Test Equipment Industry Volume Share (%), by Country 2024 & 2032
- Figure 7: Europe Fiber Optic Test Equipment Industry Revenue (Million), by Country 2024 & 2032
- Figure 8: Europe Fiber Optic Test Equipment Industry Volume (K Unit), by Country 2024 & 2032
- Figure 9: Europe Fiber Optic Test Equipment Industry Revenue Share (%), by Country 2024 & 2032
- Figure 10: Europe Fiber Optic Test Equipment Industry Volume Share (%), by Country 2024 & 2032
- Figure 11: Asia Fiber Optic Test Equipment Industry Revenue (Million), by Country 2024 & 2032
- Figure 12: Asia Fiber Optic Test Equipment Industry Volume (K Unit), by Country 2024 & 2032
- Figure 13: Asia Fiber Optic Test Equipment Industry Revenue Share (%), by Country 2024 & 2032
- Figure 14: Asia Fiber Optic Test Equipment Industry Volume Share (%), by Country 2024 & 2032
- Figure 15: Australia and New Zealand Fiber Optic Test Equipment Industry Revenue (Million), by Country 2024 & 2032
- Figure 16: Australia and New Zealand Fiber Optic Test Equipment Industry Volume (K Unit), by Country 2024 & 2032
- Figure 17: Australia and New Zealand Fiber Optic Test Equipment Industry Revenue Share (%), by Country 2024 & 2032
- Figure 18: Australia and New Zealand Fiber Optic Test Equipment Industry Volume Share (%), by Country 2024 & 2032
- Figure 19: Latin America Fiber Optic Test Equipment Industry Revenue (Million), by Country 2024 & 2032
- Figure 20: Latin America Fiber Optic Test Equipment Industry Volume (K Unit), by Country 2024 & 2032
- Figure 21: Latin America Fiber Optic Test Equipment Industry Revenue Share (%), by Country 2024 & 2032
- Figure 22: Latin America Fiber Optic Test Equipment Industry Volume Share (%), by Country 2024 & 2032
- Figure 23: Middle East and Africa Fiber Optic Test Equipment Industry Revenue (Million), by Country 2024 & 2032
- Figure 24: Middle East and Africa Fiber Optic Test Equipment Industry Volume (K Unit), by Country 2024 & 2032
- Figure 25: Middle East and Africa Fiber Optic Test Equipment Industry Revenue Share (%), by Country 2024 & 2032
- Figure 26: Middle East and Africa Fiber Optic Test Equipment Industry Volume Share (%), by Country 2024 & 2032
- Figure 27: North America Fiber Optic Test Equipment Industry Revenue (Million), by Equipment Type 2024 & 2032
- Figure 28: North America Fiber Optic Test Equipment Industry Volume (K Unit), by Equipment Type 2024 & 2032
- Figure 29: North America Fiber Optic Test Equipment Industry Revenue Share (%), by Equipment Type 2024 & 2032
- Figure 30: North America Fiber Optic Test Equipment Industry Volume Share (%), by Equipment Type 2024 & 2032
- Figure 31: North America Fiber Optic Test Equipment Industry Revenue (Million), by End-user Application 2024 & 2032
- Figure 32: North America Fiber Optic Test Equipment Industry Volume (K Unit), by End-user Application 2024 & 2032
- Figure 33: North America Fiber Optic Test Equipment Industry Revenue Share (%), by End-user Application 2024 & 2032
- Figure 34: North America Fiber Optic Test Equipment Industry Volume Share (%), by End-user Application 2024 & 2032
- Figure 35: North America Fiber Optic Test Equipment Industry Revenue (Million), by Country 2024 & 2032
- Figure 36: North America Fiber Optic Test Equipment Industry Volume (K Unit), by Country 2024 & 2032
- Figure 37: North America Fiber Optic Test Equipment Industry Revenue Share (%), by Country 2024 & 2032
- Figure 38: North America Fiber Optic Test Equipment Industry Volume Share (%), by Country 2024 & 2032
- Figure 39: Europe Fiber Optic Test Equipment Industry Revenue (Million), by Equipment Type 2024 & 2032
- Figure 40: Europe Fiber Optic Test Equipment Industry Volume (K Unit), by Equipment Type 2024 & 2032
- Figure 41: Europe Fiber Optic Test Equipment Industry Revenue Share (%), by Equipment Type 2024 & 2032
- Figure 42: Europe Fiber Optic Test Equipment Industry Volume Share (%), by Equipment Type 2024 & 2032
- Figure 43: Europe Fiber Optic Test Equipment Industry Revenue (Million), by End-user Application 2024 & 2032
- Figure 44: Europe Fiber Optic Test Equipment Industry Volume (K Unit), by End-user Application 2024 & 2032
- Figure 45: Europe Fiber Optic Test Equipment Industry Revenue Share (%), by End-user Application 2024 & 2032
- Figure 46: Europe Fiber Optic Test Equipment Industry Volume Share (%), by End-user Application 2024 & 2032
- Figure 47: Europe Fiber Optic Test Equipment Industry Revenue (Million), by Country 2024 & 2032
- Figure 48: Europe Fiber Optic Test Equipment Industry Volume (K Unit), by Country 2024 & 2032
- Figure 49: Europe Fiber Optic Test Equipment Industry Revenue Share (%), by Country 2024 & 2032
- Figure 50: Europe Fiber Optic Test Equipment Industry Volume Share (%), by Country 2024 & 2032
- Figure 51: Asia Fiber Optic Test Equipment Industry Revenue (Million), by Equipment Type 2024 & 2032
- Figure 52: Asia Fiber Optic Test Equipment Industry Volume (K Unit), by Equipment Type 2024 & 2032
- Figure 53: Asia Fiber Optic Test Equipment Industry Revenue Share (%), by Equipment Type 2024 & 2032
- Figure 54: Asia Fiber Optic Test Equipment Industry Volume Share (%), by Equipment Type 2024 & 2032
- Figure 55: Asia Fiber Optic Test Equipment Industry Revenue (Million), by End-user Application 2024 & 2032
- Figure 56: Asia Fiber Optic Test Equipment Industry Volume (K Unit), by End-user Application 2024 & 2032
- Figure 57: Asia Fiber Optic Test Equipment Industry Revenue Share (%), by End-user Application 2024 & 2032
- Figure 58: Asia Fiber Optic Test Equipment Industry Volume Share (%), by End-user Application 2024 & 2032
- Figure 59: Asia Fiber Optic Test Equipment Industry Revenue (Million), by Country 2024 & 2032
- Figure 60: Asia Fiber Optic Test Equipment Industry Volume (K Unit), by Country 2024 & 2032
- Figure 61: Asia Fiber Optic Test Equipment Industry Revenue Share (%), by Country 2024 & 2032
- Figure 62: Asia Fiber Optic Test Equipment Industry Volume Share (%), by Country 2024 & 2032
- Figure 63: Australia and New Zealand Fiber Optic Test Equipment Industry Revenue (Million), by Equipment Type 2024 & 2032
- Figure 64: Australia and New Zealand Fiber Optic Test Equipment Industry Volume (K Unit), by Equipment Type 2024 & 2032
- Figure 65: Australia and New Zealand Fiber Optic Test Equipment Industry Revenue Share (%), by Equipment Type 2024 & 2032
- Figure 66: Australia and New Zealand Fiber Optic Test Equipment Industry Volume Share (%), by Equipment Type 2024 & 2032
- Figure 67: Australia and New Zealand Fiber Optic Test Equipment Industry Revenue (Million), by End-user Application 2024 & 2032
- Figure 68: Australia and New Zealand Fiber Optic Test Equipment Industry Volume (K Unit), by End-user Application 2024 & 2032
- Figure 69: Australia and New Zealand Fiber Optic Test Equipment Industry Revenue Share (%), by End-user Application 2024 & 2032
- Figure 70: Australia and New Zealand Fiber Optic Test Equipment Industry Volume Share (%), by End-user Application 2024 & 2032
- Figure 71: Australia and New Zealand Fiber Optic Test Equipment Industry Revenue (Million), by Country 2024 & 2032
- Figure 72: Australia and New Zealand Fiber Optic Test Equipment Industry Volume (K Unit), by Country 2024 & 2032
- Figure 73: Australia and New Zealand Fiber Optic Test Equipment Industry Revenue Share (%), by Country 2024 & 2032
- Figure 74: Australia and New Zealand Fiber Optic Test Equipment Industry Volume Share (%), by Country 2024 & 2032
- Figure 75: Latin America Fiber Optic Test Equipment Industry Revenue (Million), by Equipment Type 2024 & 2032
- Figure 76: Latin America Fiber Optic Test Equipment Industry Volume (K Unit), by Equipment Type 2024 & 2032
- Figure 77: Latin America Fiber Optic Test Equipment Industry Revenue Share (%), by Equipment Type 2024 & 2032
- Figure 78: Latin America Fiber Optic Test Equipment Industry Volume Share (%), by Equipment Type 2024 & 2032
- Figure 79: Latin America Fiber Optic Test Equipment Industry Revenue (Million), by End-user Application 2024 & 2032
- Figure 80: Latin America Fiber Optic Test Equipment Industry Volume (K Unit), by End-user Application 2024 & 2032
- Figure 81: Latin America Fiber Optic Test Equipment Industry Revenue Share (%), by End-user Application 2024 & 2032
- Figure 82: Latin America Fiber Optic Test Equipment Industry Volume Share (%), by End-user Application 2024 & 2032
- Figure 83: Latin America Fiber Optic Test Equipment Industry Revenue (Million), by Country 2024 & 2032
- Figure 84: Latin America Fiber Optic Test Equipment Industry Volume (K Unit), by Country 2024 & 2032
- Figure 85: Latin America Fiber Optic Test Equipment Industry Revenue Share (%), by Country 2024 & 2032
- Figure 86: Latin America Fiber Optic Test Equipment Industry Volume Share (%), by Country 2024 & 2032
- Figure 87: Middle East and Africa Fiber Optic Test Equipment Industry Revenue (Million), by Equipment Type 2024 & 2032
- Figure 88: Middle East and Africa Fiber Optic Test Equipment Industry Volume (K Unit), by Equipment Type 2024 & 2032
- Figure 89: Middle East and Africa Fiber Optic Test Equipment Industry Revenue Share (%), by Equipment Type 2024 & 2032
- Figure 90: Middle East and Africa Fiber Optic Test Equipment Industry Volume Share (%), by Equipment Type 2024 & 2032
- Figure 91: Middle East and Africa Fiber Optic Test Equipment Industry Revenue (Million), by End-user Application 2024 & 2032
- Figure 92: Middle East and Africa Fiber Optic Test Equipment Industry Volume (K Unit), by End-user Application 2024 & 2032
- Figure 93: Middle East and Africa Fiber Optic Test Equipment Industry Revenue Share (%), by End-user Application 2024 & 2032
- Figure 94: Middle East and Africa Fiber Optic Test Equipment Industry Volume Share (%), by End-user Application 2024 & 2032
- Figure 95: Middle East and Africa Fiber Optic Test Equipment Industry Revenue (Million), by Country 2024 & 2032
- Figure 96: Middle East and Africa Fiber Optic Test Equipment Industry Volume (K Unit), by Country 2024 & 2032
- Figure 97: Middle East and Africa Fiber Optic Test Equipment Industry Revenue Share (%), by Country 2024 & 2032
- Figure 98: Middle East and Africa Fiber Optic Test Equipment Industry Volume Share (%), by Country 2024 & 2032
List of Tables
- Table 1: Global Fiber Optic Test Equipment Industry Revenue Million Forecast, by Region 2019 & 2032
- Table 2: Global Fiber Optic Test Equipment Industry Volume K Unit Forecast, by Region 2019 & 2032
- Table 3: Global Fiber Optic Test Equipment Industry Revenue Million Forecast, by Equipment Type 2019 & 2032
- Table 4: Global Fiber Optic Test Equipment Industry Volume K Unit Forecast, by Equipment Type 2019 & 2032
- Table 5: Global Fiber Optic Test Equipment Industry Revenue Million Forecast, by End-user Application 2019 & 2032
- Table 6: Global Fiber Optic Test Equipment Industry Volume K Unit Forecast, by End-user Application 2019 & 2032
- Table 7: Global Fiber Optic Test Equipment Industry Revenue Million Forecast, by Region 2019 & 2032
- Table 8: Global Fiber Optic Test Equipment Industry Volume K Unit Forecast, by Region 2019 & 2032
- Table 9: Global Fiber Optic Test Equipment Industry Revenue Million Forecast, by Country 2019 & 2032
- Table 10: Global Fiber Optic Test Equipment Industry Volume K Unit Forecast, by Country 2019 & 2032
- Table 11: United States Fiber Optic Test Equipment Industry Revenue (Million) Forecast, by Application 2019 & 2032
- Table 12: United States Fiber Optic Test Equipment Industry Volume (K Unit) Forecast, by Application 2019 & 2032
- Table 13: Canada Fiber Optic Test Equipment Industry Revenue (Million) Forecast, by Application 2019 & 2032
- Table 14: Canada Fiber Optic Test Equipment Industry Volume (K Unit) Forecast, by Application 2019 & 2032
- Table 15: Global Fiber Optic Test Equipment Industry Revenue Million Forecast, by Country 2019 & 2032
- Table 16: Global Fiber Optic Test Equipment Industry Volume K Unit Forecast, by Country 2019 & 2032
- Table 17: Germany Fiber Optic Test Equipment Industry Revenue (Million) Forecast, by Application 2019 & 2032
- Table 18: Germany Fiber Optic Test Equipment Industry Volume (K Unit) Forecast, by Application 2019 & 2032
- Table 19: United Kingdom Fiber Optic Test Equipment Industry Revenue (Million) Forecast, by Application 2019 & 2032
- Table 20: United Kingdom Fiber Optic Test Equipment Industry Volume (K Unit) Forecast, by Application 2019 & 2032
- Table 21: France Fiber Optic Test Equipment Industry Revenue (Million) Forecast, by Application 2019 & 2032
- Table 22: France Fiber Optic Test Equipment Industry Volume (K Unit) Forecast, by Application 2019 & 2032
- Table 23: Global Fiber Optic Test Equipment Industry Revenue Million Forecast, by Country 2019 & 2032
- Table 24: Global Fiber Optic Test Equipment Industry Volume K Unit Forecast, by Country 2019 & 2032
- Table 25: China Fiber Optic Test Equipment Industry Revenue (Million) Forecast, by Application 2019 & 2032
- Table 26: China Fiber Optic Test Equipment Industry Volume (K Unit) Forecast, by Application 2019 & 2032
- Table 27: Japan Fiber Optic Test Equipment Industry Revenue (Million) Forecast, by Application 2019 & 2032
- Table 28: Japan Fiber Optic Test Equipment Industry Volume (K Unit) Forecast, by Application 2019 & 2032
- Table 29: India Fiber Optic Test Equipment Industry Revenue (Million) Forecast, by Application 2019 & 2032
- Table 30: India Fiber Optic Test Equipment Industry Volume (K Unit) Forecast, by Application 2019 & 2032
- Table 31: Global Fiber Optic Test Equipment Industry Revenue Million Forecast, by Country 2019 & 2032
- Table 32: Global Fiber Optic Test Equipment Industry Volume K Unit Forecast, by Country 2019 & 2032
- Table 33: Fiber Optic Test Equipment Industry Revenue (Million) Forecast, by Application 2019 & 2032
- Table 34: Fiber Optic Test Equipment Industry Volume (K Unit) Forecast, by Application 2019 & 2032
- Table 35: Global Fiber Optic Test Equipment Industry Revenue Million Forecast, by Country 2019 & 2032
- Table 36: Global Fiber Optic Test Equipment Industry Volume K Unit Forecast, by Country 2019 & 2032
- Table 37: Brazil Fiber Optic Test Equipment Industry Revenue (Million) Forecast, by Application 2019 & 2032
- Table 38: Brazil Fiber Optic Test Equipment Industry Volume (K Unit) Forecast, by Application 2019 & 2032
- Table 39: Argentina Fiber Optic Test Equipment Industry Revenue (Million) Forecast, by Application 2019 & 2032
- Table 40: Argentina Fiber Optic Test Equipment Industry Volume (K Unit) Forecast, by Application 2019 & 2032
- Table 41: Mexico Fiber Optic Test Equipment Industry Revenue (Million) Forecast, by Application 2019 & 2032
- Table 42: Mexico Fiber Optic Test Equipment Industry Volume (K Unit) Forecast, by Application 2019 & 2032
- Table 43: Global Fiber Optic Test Equipment Industry Revenue Million Forecast, by Country 2019 & 2032
- Table 44: Global Fiber Optic Test Equipment Industry Volume K Unit Forecast, by Country 2019 & 2032
- Table 45: United Arab Emirates Fiber Optic Test Equipment Industry Revenue (Million) Forecast, by Application 2019 & 2032
- Table 46: United Arab Emirates Fiber Optic Test Equipment Industry Volume (K Unit) Forecast, by Application 2019 & 2032
- Table 47: South Africa Fiber Optic Test Equipment Industry Revenue (Million) Forecast, by Application 2019 & 2032
- Table 48: South Africa Fiber Optic Test Equipment Industry Volume (K Unit) Forecast, by Application 2019 & 2032
- Table 49: Global Fiber Optic Test Equipment Industry Revenue Million Forecast, by Equipment Type 2019 & 2032
- Table 50: Global Fiber Optic Test Equipment Industry Volume K Unit Forecast, by Equipment Type 2019 & 2032
- Table 51: Global Fiber Optic Test Equipment Industry Revenue Million Forecast, by End-user Application 2019 & 2032
- Table 52: Global Fiber Optic Test Equipment Industry Volume K Unit Forecast, by End-user Application 2019 & 2032
- Table 53: Global Fiber Optic Test Equipment Industry Revenue Million Forecast, by Country 2019 & 2032
- Table 54: Global Fiber Optic Test Equipment Industry Volume K Unit Forecast, by Country 2019 & 2032
- Table 55: United States Fiber Optic Test Equipment Industry Revenue (Million) Forecast, by Application 2019 & 2032
- Table 56: United States Fiber Optic Test Equipment Industry Volume (K Unit) Forecast, by Application 2019 & 2032
- Table 57: Canada Fiber Optic Test Equipment Industry Revenue (Million) Forecast, by Application 2019 & 2032
- Table 58: Canada Fiber Optic Test Equipment Industry Volume (K Unit) Forecast, by Application 2019 & 2032
- Table 59: Global Fiber Optic Test Equipment Industry Revenue Million Forecast, by Equipment Type 2019 & 2032
- Table 60: Global Fiber Optic Test Equipment Industry Volume K Unit Forecast, by Equipment Type 2019 & 2032
- Table 61: Global Fiber Optic Test Equipment Industry Revenue Million Forecast, by End-user Application 2019 & 2032
- Table 62: Global Fiber Optic Test Equipment Industry Volume K Unit Forecast, by End-user Application 2019 & 2032
- Table 63: Global Fiber Optic Test Equipment Industry Revenue Million Forecast, by Country 2019 & 2032
- Table 64: Global Fiber Optic Test Equipment Industry Volume K Unit Forecast, by Country 2019 & 2032
- Table 65: Germany Fiber Optic Test Equipment Industry Revenue (Million) Forecast, by Application 2019 & 2032
- Table 66: Germany Fiber Optic Test Equipment Industry Volume (K Unit) Forecast, by Application 2019 & 2032
- Table 67: United Kingdom Fiber Optic Test Equipment Industry Revenue (Million) Forecast, by Application 2019 & 2032
- Table 68: United Kingdom Fiber Optic Test Equipment Industry Volume (K Unit) Forecast, by Application 2019 & 2032
- Table 69: France Fiber Optic Test Equipment Industry Revenue (Million) Forecast, by Application 2019 & 2032
- Table 70: France Fiber Optic Test Equipment Industry Volume (K Unit) Forecast, by Application 2019 & 2032
- Table 71: Global Fiber Optic Test Equipment Industry Revenue Million Forecast, by Equipment Type 2019 & 2032
- Table 72: Global Fiber Optic Test Equipment Industry Volume K Unit Forecast, by Equipment Type 2019 & 2032
- Table 73: Global Fiber Optic Test Equipment Industry Revenue Million Forecast, by End-user Application 2019 & 2032
- Table 74: Global Fiber Optic Test Equipment Industry Volume K Unit Forecast, by End-user Application 2019 & 2032
- Table 75: Global Fiber Optic Test Equipment Industry Revenue Million Forecast, by Country 2019 & 2032
- Table 76: Global Fiber Optic Test Equipment Industry Volume K Unit Forecast, by Country 2019 & 2032
- Table 77: China Fiber Optic Test Equipment Industry Revenue (Million) Forecast, by Application 2019 & 2032
- Table 78: China Fiber Optic Test Equipment Industry Volume (K Unit) Forecast, by Application 2019 & 2032
- Table 79: Japan Fiber Optic Test Equipment Industry Revenue (Million) Forecast, by Application 2019 & 2032
- Table 80: Japan Fiber Optic Test Equipment Industry Volume (K Unit) Forecast, by Application 2019 & 2032
- Table 81: India Fiber Optic Test Equipment Industry Revenue (Million) Forecast, by Application 2019 & 2032
- Table 82: India Fiber Optic Test Equipment Industry Volume (K Unit) Forecast, by Application 2019 & 2032
- Table 83: Global Fiber Optic Test Equipment Industry Revenue Million Forecast, by Equipment Type 2019 & 2032
- Table 84: Global Fiber Optic Test Equipment Industry Volume K Unit Forecast, by Equipment Type 2019 & 2032
- Table 85: Global Fiber Optic Test Equipment Industry Revenue Million Forecast, by End-user Application 2019 & 2032
- Table 86: Global Fiber Optic Test Equipment Industry Volume K Unit Forecast, by End-user Application 2019 & 2032
- Table 87: Global Fiber Optic Test Equipment Industry Revenue Million Forecast, by Country 2019 & 2032
- Table 88: Global Fiber Optic Test Equipment Industry Volume K Unit Forecast, by Country 2019 & 2032
- Table 89: Global Fiber Optic Test Equipment Industry Revenue Million Forecast, by Equipment Type 2019 & 2032
- Table 90: Global Fiber Optic Test Equipment Industry Volume K Unit Forecast, by Equipment Type 2019 & 2032
- Table 91: Global Fiber Optic Test Equipment Industry Revenue Million Forecast, by End-user Application 2019 & 2032
- Table 92: Global Fiber Optic Test Equipment Industry Volume K Unit Forecast, by End-user Application 2019 & 2032
- Table 93: Global Fiber Optic Test Equipment Industry Revenue Million Forecast, by Country 2019 & 2032
- Table 94: Global Fiber Optic Test Equipment Industry Volume K Unit Forecast, by Country 2019 & 2032
- Table 95: Brazil Fiber Optic Test Equipment Industry Revenue (Million) Forecast, by Application 2019 & 2032
- Table 96: Brazil Fiber Optic Test Equipment Industry Volume (K Unit) Forecast, by Application 2019 & 2032
- Table 97: Argentina Fiber Optic Test Equipment Industry Revenue (Million) Forecast, by Application 2019 & 2032
- Table 98: Argentina Fiber Optic Test Equipment Industry Volume (K Unit) Forecast, by Application 2019 & 2032
- Table 99: Mexico Fiber Optic Test Equipment Industry Revenue (Million) Forecast, by Application 2019 & 2032
- Table 100: Mexico Fiber Optic Test Equipment Industry Volume (K Unit) Forecast, by Application 2019 & 2032
- Table 101: Global Fiber Optic Test Equipment Industry Revenue Million Forecast, by Equipment Type 2019 & 2032
- Table 102: Global Fiber Optic Test Equipment Industry Volume K Unit Forecast, by Equipment Type 2019 & 2032
- Table 103: Global Fiber Optic Test Equipment Industry Revenue Million Forecast, by End-user Application 2019 & 2032
- Table 104: Global Fiber Optic Test Equipment Industry Volume K Unit Forecast, by End-user Application 2019 & 2032
- Table 105: Global Fiber Optic Test Equipment Industry Revenue Million Forecast, by Country 2019 & 2032
- Table 106: Global Fiber Optic Test Equipment Industry Volume K Unit Forecast, by Country 2019 & 2032
- Table 107: United Arab Emirates Fiber Optic Test Equipment Industry Revenue (Million) Forecast, by Application 2019 & 2032
- Table 108: United Arab Emirates Fiber Optic Test Equipment Industry Volume (K Unit) Forecast, by Application 2019 & 2032
- Table 109: South Africa Fiber Optic Test Equipment Industry Revenue (Million) Forecast, by Application 2019 & 2032
- Table 110: South Africa Fiber Optic Test Equipment Industry Volume (K Unit) Forecast, by Application 2019 & 2032
Frequently Asked Questions
1. What is the projected Compound Annual Growth Rate (CAGR) of the Fiber Optic Test Equipment Industry?
The projected CAGR is approximately 6.50%.
2. Which companies are prominent players in the Fiber Optic Test Equipment Industry?
Key companies in the market include Kingfisher International, Terahertz Technologies Inc (Trends Networks), Anritsu Corporation, VIAVI Solutions Inc, AFL Global, Pelorus Technologies Pvt Ltd, EXFO Inc, Yokogawa Electric Corporation, AMS Technologies A, Deviser Instruments, Fluke Networks, VeEX Inc.
3. What are the main segments of the Fiber Optic Test Equipment Industry?
The market segments include Equipment Type, End-user Application.
4. Can you provide details about the market size?
The market size is estimated to be USD 1.10 Million as of 2022.
5. What are some drivers contributing to market growth?
Increasing Penetration of 5G/LTE Networks and Fixed Broadband Subscription; Growing Adoption of fiber optic networks for power and utility management. Security. and Communication.
6. What are the notable trends driving market growth?
Telecommunications to Witness Significant Growth.
7. Are there any restraints impacting market growth?
High Cost of Testers and Fiber Optic Test Equipment; Lack of Awareness and Technical Knowledge.
8. Can you provide examples of recent developments in the market?
March 2024 - VeEX Inc. unveiled the RXT- 6800 Advanced 800G Multiservice test module. Based on the RXT-6400400G high-speed test module, the RXT6800 provides the flexibility to test existing interfaces up to a maximum of 800G. This new module is the industry's smallest, most versatile, and most portable 800G field test solution.
9. What pricing options are available for accessing the report?
Pricing options include single-user, multi-user, and enterprise licenses priced at USD 4750, USD 5250, and USD 8750 respectively.
10. Is the market size provided in terms of value or volume?
The market size is provided in terms of value, measured in Million and volume, measured in K Unit.
11. Are there any specific market keywords associated with the report?
Yes, the market keyword associated with the report is "Fiber Optic Test Equipment Industry," which aids in identifying and referencing the specific market segment covered.
12. How do I determine which pricing option suits my needs best?
The pricing options vary based on user requirements and access needs. Individual users may opt for single-user licenses, while businesses requiring broader access may choose multi-user or enterprise licenses for cost-effective access to the report.
13. Are there any additional resources or data provided in the Fiber Optic Test Equipment Industry report?
While the report offers comprehensive insights, it's advisable to review the specific contents or supplementary materials provided to ascertain if additional resources or data are available.
14. How can I stay updated on further developments or reports in the Fiber Optic Test Equipment Industry?
To stay informed about further developments, trends, and reports in the Fiber Optic Test Equipment Industry, consider subscribing to industry newsletters, following relevant companies and organizations, or regularly checking reputable industry news sources and publications.
Methodology
Step 1 - Identification of Relevant Samples Size from Population Database


Step 2 - Approaches for Defining Global Market Size (Value, Volume* & Price*)

Note*: In applicable scenarios
Step 3 - Data Sources
Primary Research
- Web Analytics
- Survey Reports
- Research Institute
- Latest Research Reports
- Opinion Leaders
Secondary Research
- Annual Reports
- White Paper
- Latest Press Release
- Industry Association
- Paid Database
- Investor Presentations

Step 4 - Data Triangulation
Involves using different sources of information in order to increase the validity of a study
These sources are likely to be stakeholders in a program - participants, other researchers, program staff, other community members, and so on.
Then we put all data in single framework & apply various statistical tools to find out the dynamic on the market.
During the analysis stage, feedback from the stakeholder groups would be compared to determine areas of agreement as well as areas of divergence
