

Key Insights
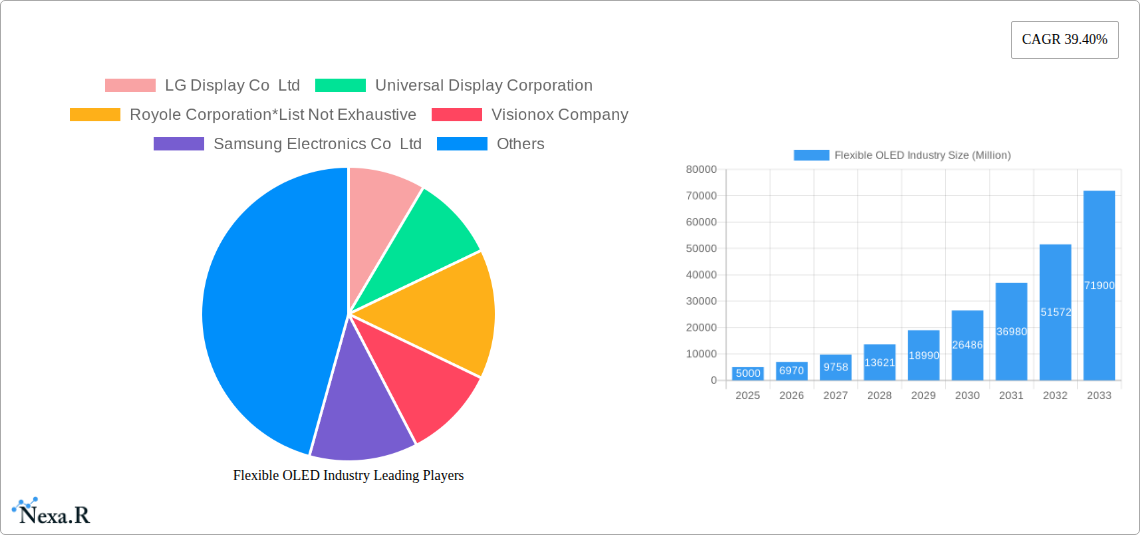
The flexible OLED market is experiencing explosive growth, driven by increasing demand for foldable smartphones, flexible displays in wearables, and the rise of innovative applications in automotive and other sectors. A compound annual growth rate (CAGR) of 39.40% from 2019 to 2024 suggests a rapidly expanding market. While precise market size figures for 2024 are unavailable, extrapolating from a base year of 2025, a logical estimation places the 2024 market value significantly below the 2025 value. This rapid expansion is fueled by advancements in AMOLED and PMOLED technologies, enabling thinner, lighter, and more durable displays with superior image quality. The dominance of mobile and tablet applications is expected to continue, but significant growth is anticipated from the wearable technology and automotive sectors. Key players like Samsung Electronics, LG Display, and BOE Technology are aggressively investing in research and development, driving innovation and enhancing production capabilities. Competition is fierce, leading to continuous improvements in cost-efficiency and product performance. However, challenges remain, including high manufacturing costs, especially for larger flexible displays, and the need for improved durability to meet the demands of diverse applications.
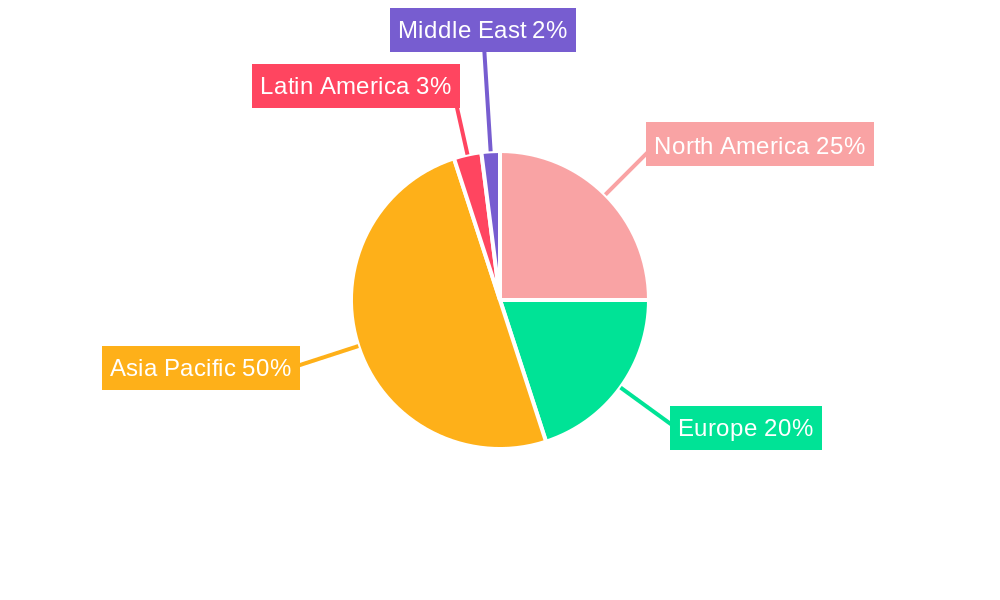
Despite these challenges, the long-term outlook for the flexible OLED market is extremely positive. The forecast period of 2025-2033 promises continued expansion, driven by ongoing technological advancements and the increasing integration of flexible displays across a broader range of consumer and industrial products. Regional variations exist; the Asia Pacific region is likely to maintain a leading market share due to a high concentration of manufacturing facilities and a robust consumer electronics market. However, North America and Europe will also experience substantial growth driven by increased adoption across various applications. The strategic diversification of applications beyond smartphones and tablets presents a key pathway to continued expansion, contributing significantly to the overall market value in the coming years. The competitive landscape will likely remain dynamic, with continuous innovation and consolidation shaping the industry's trajectory.
Flexible OLED Industry Market Report: 2019-2033
This comprehensive report provides an in-depth analysis of the flexible OLED industry, encompassing market dynamics, growth trends, key players, and future outlook. With a study period spanning 2019-2033, a base year of 2025, and a forecast period of 2025-2033, this report is an invaluable resource for industry professionals, investors, and anyone seeking to understand this rapidly evolving market. The report analyzes both parent markets (display technologies) and child markets (specific applications) to provide a holistic view of the flexible OLED landscape.
Flexible OLED Industry Market Dynamics & Structure
The flexible OLED market is characterized by intense competition among key players, significant technological innovation, and evolving regulatory frameworks. Market concentration is relatively high, with a few dominant players holding substantial market share. The report analyzes market share percentages for key players and the volume of M&A deals within the industry during the historical period. Innovation is a critical driver, with companies constantly striving to improve display quality, flexibility, and power efficiency. However, barriers to entry, such as high R&D costs and complex manufacturing processes, limit the number of new entrants.
- Market Concentration: LG Display, Samsung, and BOE collectively held approximately xx% of the market share in 2024.
- Technological Innovation: Focus on AMOLED and PMOLED technologies, with advancements in Hybrid-TFT and other power-saving techniques.
- Regulatory Frameworks: Analysis of regional regulations impacting manufacturing, material sourcing, and product safety.
- Competitive Product Substitutes: Assessment of competing display technologies, such as flexible LCDs and micro-LEDs.
- End-User Demographics: Analysis of consumer preferences, adoption rates across different demographics, and evolving demands.
- M&A Trends: Evaluation of mergers, acquisitions, and joint ventures during 2019-2024, with projected trends for 2025-2033. xx M&A deals were observed during the historical period.
Flexible OLED Industry Growth Trends & Insights
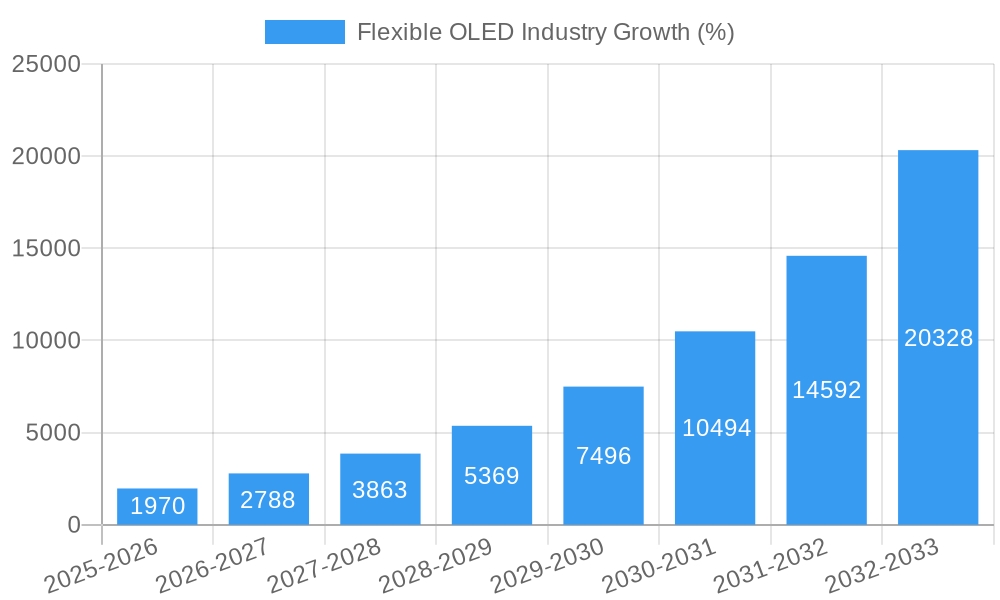
The flexible OLED market experienced significant growth during 2019-2024, driven by increasing demand for high-quality displays in various applications. The report projects continued growth during the forecast period (2025-2033), with a compound annual growth rate (CAGR) of xx%. This growth is fueled by technological advancements, such as the development of flexible displays with improved brightness, resolution, and power efficiency. The adoption rate of flexible OLED displays is expected to increase steadily across various sectors, driven by consumer preference for sleek, lightweight devices with superior visual experiences. The report analyzes these factors in detail, incorporating specific metrics and projections to provide a comprehensive outlook.
Dominant Regions, Countries, or Segments in Flexible OLED Industry
The flexible OLED market is geographically diverse, with several regions exhibiting strong growth. Asia, particularly South Korea, China, and Japan, dominate the market due to strong manufacturing capabilities and a large consumer base. The report provides a detailed analysis of regional variations, focusing on factors like economic policies, infrastructure development, and consumer spending patterns. Within the segments, AMOLED technology holds a significant market share compared to PMOLED, driven by its superior performance characteristics. The Mobile and Tablets application segment is currently the largest, followed by Wearables and Monitors and TVs.
- Leading Regions: Asia (South Korea, China, Japan) dominates market share in 2024 at approximately xx%.
- Dominant Technology: AMOLED holds a xx% market share in 2024 due to superior quality and features.
- Largest Application Segment: Mobile and Tablets; Projected to maintain its dominance until 2033 with a xx% market share in 2024.
- Key Drivers: Strong consumer electronics manufacturing, government investments in R&D, and supportive infrastructure.
Flexible OLED Industry Product Landscape
Flexible OLED technology offers unique advantages over traditional displays, including superior image quality, thinner profiles, and enhanced flexibility. Product innovations focus on achieving higher resolutions, better color accuracy, and increased power efficiency. Advancements in materials science and manufacturing processes are driving the development of more durable, foldable, and rollable displays. Unique selling propositions include improved viewing angles, higher contrast ratios, and reduced power consumption.
Key Drivers, Barriers & Challenges in Flexible OLED Industry
Key Drivers:
- Growing demand for high-resolution, flexible displays in smartphones, wearables, and other consumer electronics.
- Technological advancements leading to improved display performance and reduced costs.
- Increasing investments in R&D by key players and governments.
Key Challenges:
- High manufacturing costs and complex production processes, limiting accessibility and affordability.
- Supply chain vulnerabilities related to critical materials and manufacturing capacity.
- Intense competition among major players leading to price pressures.
Emerging Opportunities in Flexible OLED Industry
- Expansion into new applications, such as automotive displays and augmented reality (AR)/virtual reality (VR) devices.
- Development of flexible displays with innovative functionalities, such as haptic feedback and bio-sensing capabilities.
- Growth in emerging markets, particularly in developing economies with increasing consumer disposable incomes.
Growth Accelerators in the Flexible OLED Industry
Technological breakthroughs in materials science and manufacturing processes are key catalysts for long-term growth, enabling the production of more flexible, durable, and cost-effective displays. Strategic partnerships and collaborations between display manufacturers, material suppliers, and device makers facilitate technological advancements and market expansion. Expansion into new and emerging applications across various industries offers substantial growth potential.
Key Players Shaping the Flexible OLED Industry Market
- LG Display Co Ltd
- Universal Display Corporation
- Royole Corporation
- Visionox Company
- Samsung Electronics Co Ltd
- BOE Technology UK Limited
- Ritdisplay Corporation
- AUO Corporation
- WiseChip Semiconductor Inc
Notable Milestones in Flexible OLED Industry Sector
- June 2022: LG Display launches upgraded G2 and C2 OLED TVs with improved brightness and clarity, introducing new sizes (55", 65", 77" for G2 and 6 sizes for C2).
- February 2022: Visionox releases China's first 1Hz low-power AMOLED display using Hybrid-TFT technology, significantly reducing power consumption.
In-Depth Flexible OLED Industry Market Outlook
The flexible OLED market is poised for substantial growth in the coming years, driven by continued technological innovation, rising consumer demand, and expansion into diverse applications. Strategic partnerships, investments in R&D, and efficient manufacturing processes will play a vital role in shaping the future of the market. The market holds significant potential for companies that can successfully navigate the challenges and capitalize on the emerging opportunities.
Flexible OLED Industry Segmentation
-
1. Technology
- 1.1. AMOLED
- 1.2. PMOLED
-
2. Application
- 2.1. Mobiles and Tablets
- 2.2. Monitors and TVs
- 2.3. Wearables
- 2.4. Other Applications
Flexible OLED Industry Segmentation By Geography
- 1. North America
- 2. Europe
- 3. Asia Pacific
- 4. Latin America
- 5. Middle East
Flexible OLED Industry REPORT HIGHLIGHTS
| Aspects | Details |
|---|---|
| Study Period | 2019-2033 |
| Base Year | 2024 |
| Estimated Year | 2025 |
| Forecast Period | 2025-2033 |
| Historical Period | 2019-2024 |
| Growth Rate | CAGR of 39.40% from 2019-2033 |
| Segmentation |
|
Table of Contents
- 1. Introduction
- 1.1. Research Scope
- 1.2. Market Segmentation
- 1.3. Research Methodology
- 1.4. Definitions and Assumptions
- 2. Executive Summary
- 2.1. Introduction
- 3. Market Dynamics
- 3.1. Introduction
- 3.2. Market Drivers
- 3.2.1. Increasing Demand for OLED in Smartphone Panels; Technological Advancements in Display Market
- 3.3. Market Restrains
- 3.3.1. ; Competition with Existing Display Technologies
- 3.4. Market Trends
- 3.4.1. Mobiles and Televisions to Witness Significant Growth
- 4. Market Factor Analysis
- 4.1. Porters Five Forces
- 4.2. Supply/Value Chain
- 4.3. PESTEL analysis
- 4.4. Market Entropy
- 4.5. Patent/Trademark Analysis
- 5. Global Flexible OLED Industry Analysis, Insights and Forecast, 2019-2031
- 5.1. Market Analysis, Insights and Forecast - by Technology
- 5.1.1. AMOLED
- 5.1.2. PMOLED
- 5.2. Market Analysis, Insights and Forecast - by Application
- 5.2.1. Mobiles and Tablets
- 5.2.2. Monitors and TVs
- 5.2.3. Wearables
- 5.2.4. Other Applications
- 5.3. Market Analysis, Insights and Forecast - by Region
- 5.3.1. North America
- 5.3.2. Europe
- 5.3.3. Asia Pacific
- 5.3.4. Latin America
- 5.3.5. Middle East
- 5.1. Market Analysis, Insights and Forecast - by Technology
- 6. North America Flexible OLED Industry Analysis, Insights and Forecast, 2019-2031
- 6.1. Market Analysis, Insights and Forecast - by Technology
- 6.1.1. AMOLED
- 6.1.2. PMOLED
- 6.2. Market Analysis, Insights and Forecast - by Application
- 6.2.1. Mobiles and Tablets
- 6.2.2. Monitors and TVs
- 6.2.3. Wearables
- 6.2.4. Other Applications
- 6.1. Market Analysis, Insights and Forecast - by Technology
- 7. Europe Flexible OLED Industry Analysis, Insights and Forecast, 2019-2031
- 7.1. Market Analysis, Insights and Forecast - by Technology
- 7.1.1. AMOLED
- 7.1.2. PMOLED
- 7.2. Market Analysis, Insights and Forecast - by Application
- 7.2.1. Mobiles and Tablets
- 7.2.2. Monitors and TVs
- 7.2.3. Wearables
- 7.2.4. Other Applications
- 7.1. Market Analysis, Insights and Forecast - by Technology
- 8. Asia Pacific Flexible OLED Industry Analysis, Insights and Forecast, 2019-2031
- 8.1. Market Analysis, Insights and Forecast - by Technology
- 8.1.1. AMOLED
- 8.1.2. PMOLED
- 8.2. Market Analysis, Insights and Forecast - by Application
- 8.2.1. Mobiles and Tablets
- 8.2.2. Monitors and TVs
- 8.2.3. Wearables
- 8.2.4. Other Applications
- 8.1. Market Analysis, Insights and Forecast - by Technology
- 9. Latin America Flexible OLED Industry Analysis, Insights and Forecast, 2019-2031
- 9.1. Market Analysis, Insights and Forecast - by Technology
- 9.1.1. AMOLED
- 9.1.2. PMOLED
- 9.2. Market Analysis, Insights and Forecast - by Application
- 9.2.1. Mobiles and Tablets
- 9.2.2. Monitors and TVs
- 9.2.3. Wearables
- 9.2.4. Other Applications
- 9.1. Market Analysis, Insights and Forecast - by Technology
- 10. Middle East Flexible OLED Industry Analysis, Insights and Forecast, 2019-2031
- 10.1. Market Analysis, Insights and Forecast - by Technology
- 10.1.1. AMOLED
- 10.1.2. PMOLED
- 10.2. Market Analysis, Insights and Forecast - by Application
- 10.2.1. Mobiles and Tablets
- 10.2.2. Monitors and TVs
- 10.2.3. Wearables
- 10.2.4. Other Applications
- 10.1. Market Analysis, Insights and Forecast - by Technology
- 11. North America Flexible OLED Industry Analysis, Insights and Forecast, 2019-2031
- 11.1. Market Analysis, Insights and Forecast - By Country/Sub-region
- 11.1.1.
- 12. Europe Flexible OLED Industry Analysis, Insights and Forecast, 2019-2031
- 12.1. Market Analysis, Insights and Forecast - By Country/Sub-region
- 12.1.1.
- 13. Asia Pacific Flexible OLED Industry Analysis, Insights and Forecast, 2019-2031
- 13.1. Market Analysis, Insights and Forecast - By Country/Sub-region
- 13.1.1.
- 14. Latin America Flexible OLED Industry Analysis, Insights and Forecast, 2019-2031
- 14.1. Market Analysis, Insights and Forecast - By Country/Sub-region
- 14.1.1.
- 15. Middle East Flexible OLED Industry Analysis, Insights and Forecast, 2019-2031
- 15.1. Market Analysis, Insights and Forecast - By Country/Sub-region
- 15.1.1.
- 16. Competitive Analysis
- 16.1. Global Market Share Analysis 2024
- 16.2. Company Profiles
- 16.2.1 LG Display Co Ltd
- 16.2.1.1. Overview
- 16.2.1.2. Products
- 16.2.1.3. SWOT Analysis
- 16.2.1.4. Recent Developments
- 16.2.1.5. Financials (Based on Availability)
- 16.2.2 Universal Display Corporation
- 16.2.2.1. Overview
- 16.2.2.2. Products
- 16.2.2.3. SWOT Analysis
- 16.2.2.4. Recent Developments
- 16.2.2.5. Financials (Based on Availability)
- 16.2.3 Royole Corporation*List Not Exhaustive
- 16.2.3.1. Overview
- 16.2.3.2. Products
- 16.2.3.3. SWOT Analysis
- 16.2.3.4. Recent Developments
- 16.2.3.5. Financials (Based on Availability)
- 16.2.4 Visionox Company
- 16.2.4.1. Overview
- 16.2.4.2. Products
- 16.2.4.3. SWOT Analysis
- 16.2.4.4. Recent Developments
- 16.2.4.5. Financials (Based on Availability)
- 16.2.5 Samsung Electronics Co Ltd
- 16.2.5.1. Overview
- 16.2.5.2. Products
- 16.2.5.3. SWOT Analysis
- 16.2.5.4. Recent Developments
- 16.2.5.5. Financials (Based on Availability)
- 16.2.6 BOE Technology UK Limited
- 16.2.6.1. Overview
- 16.2.6.2. Products
- 16.2.6.3. SWOT Analysis
- 16.2.6.4. Recent Developments
- 16.2.6.5. Financials (Based on Availability)
- 16.2.7 Ritdisplay Corporation
- 16.2.7.1. Overview
- 16.2.7.2. Products
- 16.2.7.3. SWOT Analysis
- 16.2.7.4. Recent Developments
- 16.2.7.5. Financials (Based on Availability)
- 16.2.8 AUO Corporation
- 16.2.8.1. Overview
- 16.2.8.2. Products
- 16.2.8.3. SWOT Analysis
- 16.2.8.4. Recent Developments
- 16.2.8.5. Financials (Based on Availability)
- 16.2.9 WiseChip Semiconductor Inc
- 16.2.9.1. Overview
- 16.2.9.2. Products
- 16.2.9.3. SWOT Analysis
- 16.2.9.4. Recent Developments
- 16.2.9.5. Financials (Based on Availability)
- 16.2.1 LG Display Co Ltd
List of Figures
- Figure 1: Global Flexible OLED Industry Revenue Breakdown (Million, %) by Region 2024 & 2032
- Figure 2: North America Flexible OLED Industry Revenue (Million), by Country 2024 & 2032
- Figure 3: North America Flexible OLED Industry Revenue Share (%), by Country 2024 & 2032
- Figure 4: Europe Flexible OLED Industry Revenue (Million), by Country 2024 & 2032
- Figure 5: Europe Flexible OLED Industry Revenue Share (%), by Country 2024 & 2032
- Figure 6: Asia Pacific Flexible OLED Industry Revenue (Million), by Country 2024 & 2032
- Figure 7: Asia Pacific Flexible OLED Industry Revenue Share (%), by Country 2024 & 2032
- Figure 8: Latin America Flexible OLED Industry Revenue (Million), by Country 2024 & 2032
- Figure 9: Latin America Flexible OLED Industry Revenue Share (%), by Country 2024 & 2032
- Figure 10: Middle East Flexible OLED Industry Revenue (Million), by Country 2024 & 2032
- Figure 11: Middle East Flexible OLED Industry Revenue Share (%), by Country 2024 & 2032
- Figure 12: North America Flexible OLED Industry Revenue (Million), by Technology 2024 & 2032
- Figure 13: North America Flexible OLED Industry Revenue Share (%), by Technology 2024 & 2032
- Figure 14: North America Flexible OLED Industry Revenue (Million), by Application 2024 & 2032
- Figure 15: North America Flexible OLED Industry Revenue Share (%), by Application 2024 & 2032
- Figure 16: North America Flexible OLED Industry Revenue (Million), by Country 2024 & 2032
- Figure 17: North America Flexible OLED Industry Revenue Share (%), by Country 2024 & 2032
- Figure 18: Europe Flexible OLED Industry Revenue (Million), by Technology 2024 & 2032
- Figure 19: Europe Flexible OLED Industry Revenue Share (%), by Technology 2024 & 2032
- Figure 20: Europe Flexible OLED Industry Revenue (Million), by Application 2024 & 2032
- Figure 21: Europe Flexible OLED Industry Revenue Share (%), by Application 2024 & 2032
- Figure 22: Europe Flexible OLED Industry Revenue (Million), by Country 2024 & 2032
- Figure 23: Europe Flexible OLED Industry Revenue Share (%), by Country 2024 & 2032
- Figure 24: Asia Pacific Flexible OLED Industry Revenue (Million), by Technology 2024 & 2032
- Figure 25: Asia Pacific Flexible OLED Industry Revenue Share (%), by Technology 2024 & 2032
- Figure 26: Asia Pacific Flexible OLED Industry Revenue (Million), by Application 2024 & 2032
- Figure 27: Asia Pacific Flexible OLED Industry Revenue Share (%), by Application 2024 & 2032
- Figure 28: Asia Pacific Flexible OLED Industry Revenue (Million), by Country 2024 & 2032
- Figure 29: Asia Pacific Flexible OLED Industry Revenue Share (%), by Country 2024 & 2032
- Figure 30: Latin America Flexible OLED Industry Revenue (Million), by Technology 2024 & 2032
- Figure 31: Latin America Flexible OLED Industry Revenue Share (%), by Technology 2024 & 2032
- Figure 32: Latin America Flexible OLED Industry Revenue (Million), by Application 2024 & 2032
- Figure 33: Latin America Flexible OLED Industry Revenue Share (%), by Application 2024 & 2032
- Figure 34: Latin America Flexible OLED Industry Revenue (Million), by Country 2024 & 2032
- Figure 35: Latin America Flexible OLED Industry Revenue Share (%), by Country 2024 & 2032
- Figure 36: Middle East Flexible OLED Industry Revenue (Million), by Technology 2024 & 2032
- Figure 37: Middle East Flexible OLED Industry Revenue Share (%), by Technology 2024 & 2032
- Figure 38: Middle East Flexible OLED Industry Revenue (Million), by Application 2024 & 2032
- Figure 39: Middle East Flexible OLED Industry Revenue Share (%), by Application 2024 & 2032
- Figure 40: Middle East Flexible OLED Industry Revenue (Million), by Country 2024 & 2032
- Figure 41: Middle East Flexible OLED Industry Revenue Share (%), by Country 2024 & 2032
List of Tables
- Table 1: Global Flexible OLED Industry Revenue Million Forecast, by Region 2019 & 2032
- Table 2: Global Flexible OLED Industry Revenue Million Forecast, by Technology 2019 & 2032
- Table 3: Global Flexible OLED Industry Revenue Million Forecast, by Application 2019 & 2032
- Table 4: Global Flexible OLED Industry Revenue Million Forecast, by Region 2019 & 2032
- Table 5: Global Flexible OLED Industry Revenue Million Forecast, by Country 2019 & 2032
- Table 6: Flexible OLED Industry Revenue (Million) Forecast, by Application 2019 & 2032
- Table 7: Global Flexible OLED Industry Revenue Million Forecast, by Country 2019 & 2032
- Table 8: Flexible OLED Industry Revenue (Million) Forecast, by Application 2019 & 2032
- Table 9: Global Flexible OLED Industry Revenue Million Forecast, by Country 2019 & 2032
- Table 10: Flexible OLED Industry Revenue (Million) Forecast, by Application 2019 & 2032
- Table 11: Global Flexible OLED Industry Revenue Million Forecast, by Country 2019 & 2032
- Table 12: Flexible OLED Industry Revenue (Million) Forecast, by Application 2019 & 2032
- Table 13: Global Flexible OLED Industry Revenue Million Forecast, by Country 2019 & 2032
- Table 14: Flexible OLED Industry Revenue (Million) Forecast, by Application 2019 & 2032
- Table 15: Global Flexible OLED Industry Revenue Million Forecast, by Technology 2019 & 2032
- Table 16: Global Flexible OLED Industry Revenue Million Forecast, by Application 2019 & 2032
- Table 17: Global Flexible OLED Industry Revenue Million Forecast, by Country 2019 & 2032
- Table 18: Global Flexible OLED Industry Revenue Million Forecast, by Technology 2019 & 2032
- Table 19: Global Flexible OLED Industry Revenue Million Forecast, by Application 2019 & 2032
- Table 20: Global Flexible OLED Industry Revenue Million Forecast, by Country 2019 & 2032
- Table 21: Global Flexible OLED Industry Revenue Million Forecast, by Technology 2019 & 2032
- Table 22: Global Flexible OLED Industry Revenue Million Forecast, by Application 2019 & 2032
- Table 23: Global Flexible OLED Industry Revenue Million Forecast, by Country 2019 & 2032
- Table 24: Global Flexible OLED Industry Revenue Million Forecast, by Technology 2019 & 2032
- Table 25: Global Flexible OLED Industry Revenue Million Forecast, by Application 2019 & 2032
- Table 26: Global Flexible OLED Industry Revenue Million Forecast, by Country 2019 & 2032
- Table 27: Global Flexible OLED Industry Revenue Million Forecast, by Technology 2019 & 2032
- Table 28: Global Flexible OLED Industry Revenue Million Forecast, by Application 2019 & 2032
- Table 29: Global Flexible OLED Industry Revenue Million Forecast, by Country 2019 & 2032
Frequently Asked Questions
1. What is the projected Compound Annual Growth Rate (CAGR) of the Flexible OLED Industry?
The projected CAGR is approximately 39.40%.
2. Which companies are prominent players in the Flexible OLED Industry?
Key companies in the market include LG Display Co Ltd, Universal Display Corporation, Royole Corporation*List Not Exhaustive, Visionox Company, Samsung Electronics Co Ltd, BOE Technology UK Limited, Ritdisplay Corporation, AUO Corporation, WiseChip Semiconductor Inc.
3. What are the main segments of the Flexible OLED Industry?
The market segments include Technology, Application.
4. Can you provide details about the market size?
The market size is estimated to be USD XX Million as of 2022.
5. What are some drivers contributing to market growth?
Increasing Demand for OLED in Smartphone Panels; Technological Advancements in Display Market.
6. What are the notable trends driving market growth?
Mobiles and Televisions to Witness Significant Growth.
7. Are there any restraints impacting market growth?
; Competition with Existing Display Technologies.
8. Can you provide examples of recent developments in the market?
June 2022 - LG Display creates new markets with cutting-edge OLED solutions. The company launched upgraded versions of G2& C2 televisions. Both versions are making use of upgraded OLED technology to create even better visuals. This technology enables the displays to deliver higher brightness with greater clarity and detail. The new sizes of the G2 series are introduced alongside three other sizes (55", 65", and 77"). The C2 series gets a total of 6 display sizes.
9. What pricing options are available for accessing the report?
Pricing options include single-user, multi-user, and enterprise licenses priced at USD 4750, USD 5250, and USD 8750 respectively.
10. Is the market size provided in terms of value or volume?
The market size is provided in terms of value, measured in Million.
11. Are there any specific market keywords associated with the report?
Yes, the market keyword associated with the report is "Flexible OLED Industry," which aids in identifying and referencing the specific market segment covered.
12. How do I determine which pricing option suits my needs best?
The pricing options vary based on user requirements and access needs. Individual users may opt for single-user licenses, while businesses requiring broader access may choose multi-user or enterprise licenses for cost-effective access to the report.
13. Are there any additional resources or data provided in the Flexible OLED Industry report?
While the report offers comprehensive insights, it's advisable to review the specific contents or supplementary materials provided to ascertain if additional resources or data are available.
14. How can I stay updated on further developments or reports in the Flexible OLED Industry?
To stay informed about further developments, trends, and reports in the Flexible OLED Industry, consider subscribing to industry newsletters, following relevant companies and organizations, or regularly checking reputable industry news sources and publications.
Methodology
Step 1 - Identification of Relevant Samples Size from Population Database


Step 2 - Approaches for Defining Global Market Size (Value, Volume* & Price*)

Note*: In applicable scenarios
Step 3 - Data Sources
Primary Research
- Web Analytics
- Survey Reports
- Research Institute
- Latest Research Reports
- Opinion Leaders
Secondary Research
- Annual Reports
- White Paper
- Latest Press Release
- Industry Association
- Paid Database
- Investor Presentations

Step 4 - Data Triangulation
Involves using different sources of information in order to increase the validity of a study
These sources are likely to be stakeholders in a program - participants, other researchers, program staff, other community members, and so on.
Then we put all data in single framework & apply various statistical tools to find out the dynamic on the market.
During the analysis stage, feedback from the stakeholder groups would be compared to determine areas of agreement as well as areas of divergence
