

Key Insights
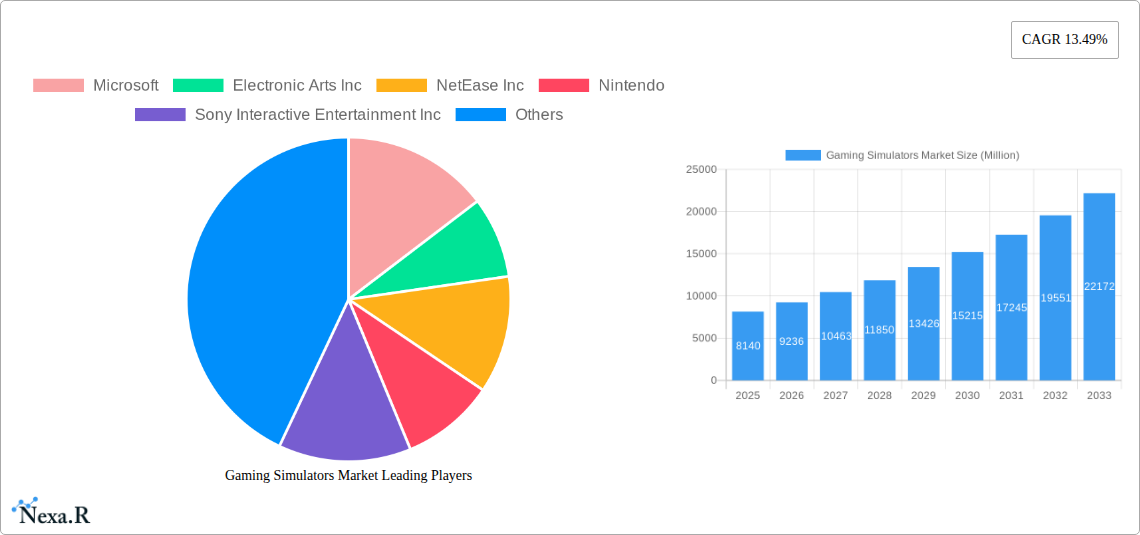
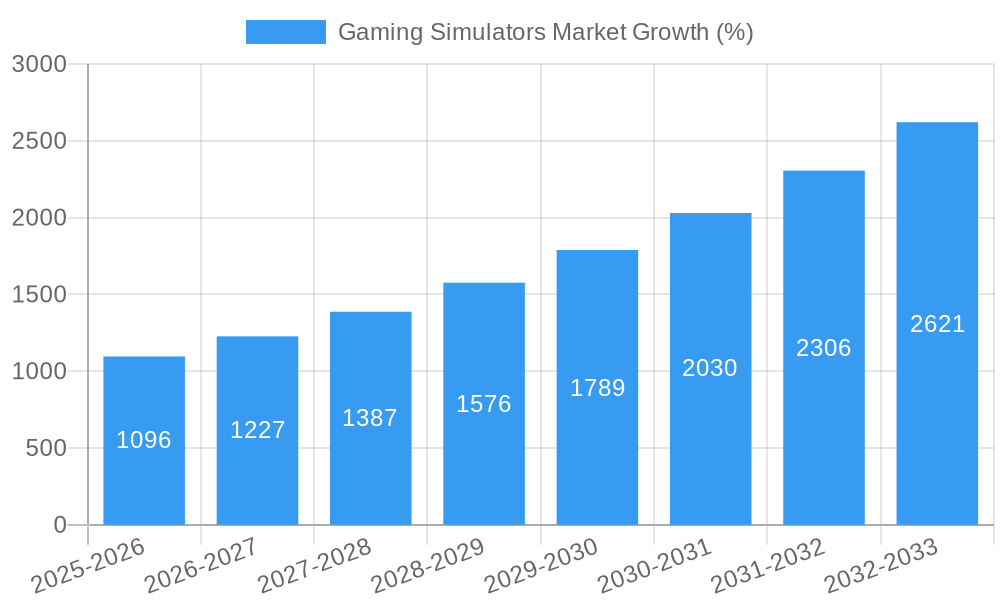
The gaming simulator market, currently valued at $8.14 billion in 2025, is projected to experience robust growth, exhibiting a Compound Annual Growth Rate (CAGR) of 13.49% from 2025 to 2033. This expansion is fueled by several key factors. The increasing popularity of esports and competitive gaming is driving demand for realistic and immersive simulation experiences. Technological advancements, such as the development of more powerful and affordable hardware (including VR and AR devices), and sophisticated game engines are enhancing the realism and accessibility of simulators. Furthermore, the growing adoption of cloud gaming platforms expands market reach, allowing players with varying levels of technical capability to access high-quality simulations. The market is segmented by type (Advertising, In-App Purchase, Paid App), with paid apps likely holding the largest share due to the higher-quality experience and features often associated with them. Major players like Microsoft, Electronic Arts, and Tencent are heavily invested in this space, continuously innovating and expanding their offerings. Geographic distribution shows significant growth potential across regions, particularly in Asia-Pacific, driven by a burgeoning gaming culture and increasing disposable incomes.
However, market growth is not without its challenges. The high cost of development and maintenance for sophisticated simulators presents a significant barrier to entry for smaller companies. Competition within the industry is fierce, requiring continuous innovation and marketing efforts to maintain market share. Furthermore, the potential for user fatigue and the need for regular updates to maintain user engagement require significant ongoing investment. Despite these challenges, the long-term outlook for the gaming simulator market remains positive, driven by sustained technological advancements and the enduring appeal of immersive gaming experiences. The market's evolution towards more realistic and accessible simulations, coupled with strategic partnerships and acquisitions among major players, will continue to shape the future of this dynamic sector.
Gaming Simulators Market: A Comprehensive Market Report (2019-2033)
This in-depth report provides a comprehensive analysis of the Gaming Simulators Market, encompassing market dynamics, growth trends, regional dominance, product landscapes, key players, and future outlooks. The study period covers 2019-2033, with 2025 as the base and estimated year. The report offers invaluable insights for industry professionals, investors, and stakeholders seeking to understand and capitalize on opportunities within this rapidly evolving sector. The parent market is the broader gaming market, and the child market is specifically simulation games.
Gaming Simulators Market Dynamics & Structure
The gaming simulator market is characterized by intense competition among established players and emerging entrants. Market concentration is moderate, with a few major players holding significant market share, while numerous smaller companies focus on niche segments. Technological innovation, particularly in areas like AI, VR/AR, and enhanced graphics, are key drivers. Regulatory frameworks concerning data privacy and in-game purchases vary across regions, influencing market dynamics. Competitive product substitutes, such as other entertainment forms, exert pressure on market growth. End-user demographics skew towards younger generations with disposable income and a preference for immersive gaming experiences. M&A activity within the market is robust, reflecting consolidation trends and strategic acquisitions.
- Market Concentration: Moderate, with top 5 players holding approximately xx% of market share (2024).
- Technological Innovation: AI integration, VR/AR advancements, improved graphics are driving growth.
- Regulatory Frameworks: Varying data privacy regulations and age restrictions impact market access.
- Competitive Substitutes: Streaming services, esports, and other forms of entertainment compete for consumer time.
- End-User Demographics: Primarily young adults (18-35 years) with high disposable income.
- M&A Activity: xx major mergers and acquisitions observed between 2019-2024, driven by expansion and technological access.
Gaming Simulators Market Growth Trends & Insights
The global gaming simulators market experienced significant growth during the historical period (2019-2024), fueled by increasing smartphone penetration, affordable high-speed internet, and the rising popularity of mobile gaming. This trend is projected to continue during the forecast period (2025-2033), with a Compound Annual Growth Rate (CAGR) of xx% estimated. Market penetration is increasing steadily, particularly in emerging economies. Technological disruptions, such as the rise of cloud gaming and the integration of AI, are reshaping the landscape. Consumer behavior shifts toward more immersive and personalized gaming experiences are also impacting market demand. The market size in 2024 was estimated at xx million units, projected to reach xx million units by 2033.
Dominant Regions, Countries, or Segments in Gaming Simulators Market
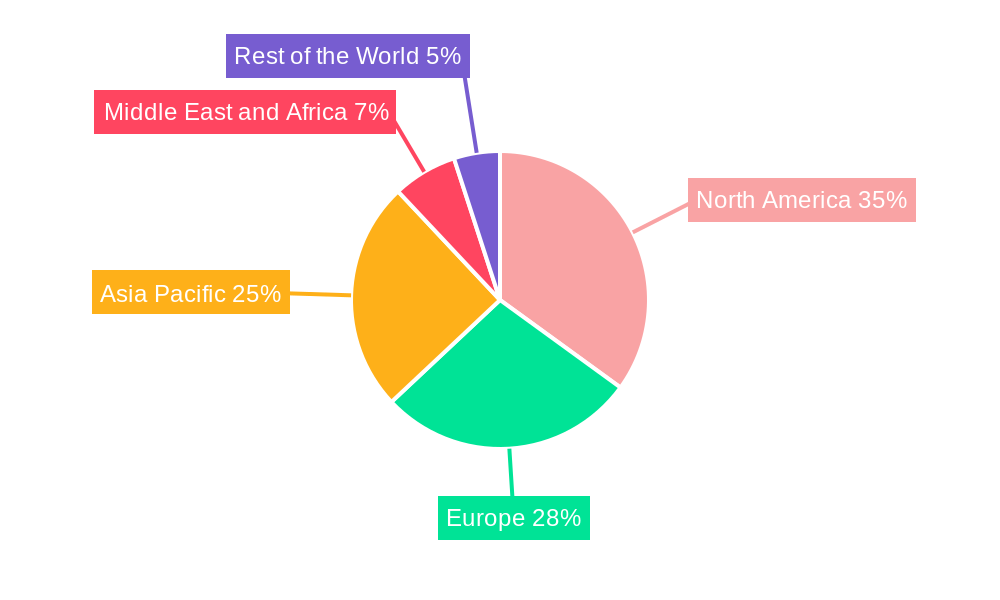
North America currently holds the largest market share in the gaming simulators market, driven by strong consumer demand, high disposable incomes, and a well-established gaming infrastructure. However, Asia-Pacific is projected to experience the fastest growth rate during the forecast period, fueled by rising smartphone penetration and expanding internet access in emerging economies like India and China. The "Paid App" segment within the "By Type" categorization demonstrates significant market dominance, commanding a market share of approximately xx% in 2024.
- North America: High consumer spending, advanced infrastructure, and strong established gaming culture.
- Asia-Pacific: Rapid growth driven by increasing smartphone penetration and expanding internet access.
- Europe: Mature market with steady growth, driven by increasing adoption of advanced gaming technology.
- Paid App Segment: Highest market share due to high consumer willingness to pay for high-quality, feature-rich simulations.
Gaming Simulators Market Product Landscape
Gaming simulators have evolved significantly, offering increasingly realistic and immersive experiences. Innovations include enhanced graphics, realistic physics engines, and integration of virtual reality (VR) and augmented reality (AR) technologies. These advancements have broadened applications across various sectors, including training and education. Key performance metrics include graphics fidelity, realistic physics simulations, response times, and level of user engagement. Unique selling propositions often involve exclusive licenses, cutting-edge technology, or highly detailed simulations.
Key Drivers, Barriers & Challenges in Gaming Simulators Market
Key Drivers: The increasing affordability of high-performance gaming hardware and software, coupled with the rise of esports and the growing popularity of realistic gaming simulations, are major drivers. Technological advancements in AI and VR/AR are further enhancing the gaming experience, creating demand. Government initiatives promoting digital economies are also contributing to market growth.
Key Barriers & Challenges: High development costs associated with creating realistic simulations, coupled with intense competition from established industry giants, pose significant challenges. The risk of technological obsolescence and evolving consumer preferences necessitate constant innovation. Regulatory uncertainties concerning data privacy and in-game purchases can also present hurdles. Supply chain disruptions have impacted the availability of components, and piracy remains an ongoing issue.
Emerging Opportunities in Gaming Simulators Market
Untapped markets in developing countries with increasing internet penetration present significant opportunities. The integration of AI to create more adaptive and challenging gaming experiences offers substantial potential. The expansion into new applications, such as professional training simulators and interactive entertainment experiences, creates avenues for market expansion. Evolving consumer preferences towards personalized and social gaming experiences will shape future market offerings.
Growth Accelerators in the Gaming Simulators Market Industry
Technological breakthroughs, including advancements in AI, VR/AR, and cloud gaming technologies, are poised to accelerate market growth. Strategic partnerships between gaming companies and technology providers will fuel innovation and broaden market reach. Aggressive market expansion strategies into emerging markets will unlock new consumer bases.
Key Players Shaping the Gaming Simulators Market Market
- Microsoft
- Electronic Arts Inc
- NetEase Inc
- Nintendo
- Sony Interactive Entertainment Inc
- Activision Blizzard Inc
- Tencent
- Square Enix Co Ltd
- Take-Two Interactive Software Inc
- Bandai Namco Entertainment Inc
Notable Milestones in Gaming Simulators Market Sector
- February 2022: Gran Turismo SophyTM, a superhuman AI racing agent, was announced, signifying a major leap in AI-powered gaming.
- February 2022: Nautilus Mobile secured a USD 5.4 million investment, highlighting investment in innovative mobile gaming experiences.
In-Depth Gaming Simulators Market Market Outlook
The gaming simulators market is poised for sustained growth, driven by continuous technological advancements and expanding consumer demand. Strategic partnerships, market diversification, and a focus on innovation will be key to success. The future holds significant potential for players who can adapt to evolving consumer preferences and leverage emerging technologies. The market is anticipated to reach xx million units by 2033, representing substantial growth opportunities.
Gaming Simulators Market Segmentation
-
1. Type
- 1.1. Advertising
- 1.2. In-App Purchase
- 1.3. Paid App
Gaming Simulators Market Segmentation By Geography
- 1. North America
- 2. Europe
- 3. Asia
- 4. Middle East and Africa
- 5. Latin America
Gaming Simulators Market REPORT HIGHLIGHTS
| Aspects | Details |
|---|---|
| Study Period | 2019-2033 |
| Base Year | 2024 |
| Estimated Year | 2025 |
| Forecast Period | 2025-2033 |
| Historical Period | 2019-2024 |
| Growth Rate | CAGR of 13.49% from 2019-2033 |
| Segmentation |
|
Table of Contents
- 1. Introduction
- 1.1. Research Scope
- 1.2. Market Segmentation
- 1.3. Research Methodology
- 1.4. Definitions and Assumptions
- 2. Executive Summary
- 2.1. Introduction
- 3. Market Dynamics
- 3.1. Introduction
- 3.2. Market Drivers
- 3.2.1. Increased Adoption of Smartphones; Increased Utilization of Gaming Simulation for Training and Analysis Across a Variety of Fields; Growing Demand for VR Headsets
- 3.3. Market Restrains
- 3.3.1. Need for Expensive Graphic Cards
- 3.4. Market Trends
- 3.4.1. Increased Adoption of Smartphones is Expected to Drive the Market Growth
- 4. Market Factor Analysis
- 4.1. Porters Five Forces
- 4.2. Supply/Value Chain
- 4.3. PESTEL analysis
- 4.4. Market Entropy
- 4.5. Patent/Trademark Analysis
- 5. Global Gaming Simulators Market Analysis, Insights and Forecast, 2019-2031
- 5.1. Market Analysis, Insights and Forecast - by Type
- 5.1.1. Advertising
- 5.1.2. In-App Purchase
- 5.1.3. Paid App
- 5.2. Market Analysis, Insights and Forecast - by Region
- 5.2.1. North America
- 5.2.2. Europe
- 5.2.3. Asia
- 5.2.4. Middle East and Africa
- 5.2.5. Latin America
- 5.1. Market Analysis, Insights and Forecast - by Type
- 6. North America Gaming Simulators Market Analysis, Insights and Forecast, 2019-2031
- 6.1. Market Analysis, Insights and Forecast - by Type
- 6.1.1. Advertising
- 6.1.2. In-App Purchase
- 6.1.3. Paid App
- 6.1. Market Analysis, Insights and Forecast - by Type
- 7. Europe Gaming Simulators Market Analysis, Insights and Forecast, 2019-2031
- 7.1. Market Analysis, Insights and Forecast - by Type
- 7.1.1. Advertising
- 7.1.2. In-App Purchase
- 7.1.3. Paid App
- 7.1. Market Analysis, Insights and Forecast - by Type
- 8. Asia Gaming Simulators Market Analysis, Insights and Forecast, 2019-2031
- 8.1. Market Analysis, Insights and Forecast - by Type
- 8.1.1. Advertising
- 8.1.2. In-App Purchase
- 8.1.3. Paid App
- 8.1. Market Analysis, Insights and Forecast - by Type
- 9. Middle East and Africa Gaming Simulators Market Analysis, Insights and Forecast, 2019-2031
- 9.1. Market Analysis, Insights and Forecast - by Type
- 9.1.1. Advertising
- 9.1.2. In-App Purchase
- 9.1.3. Paid App
- 9.1. Market Analysis, Insights and Forecast - by Type
- 10. Latin America Gaming Simulators Market Analysis, Insights and Forecast, 2019-2031
- 10.1. Market Analysis, Insights and Forecast - by Type
- 10.1.1. Advertising
- 10.1.2. In-App Purchase
- 10.1.3. Paid App
- 10.1. Market Analysis, Insights and Forecast - by Type
- 11. North America Gaming Simulators Market Analysis, Insights and Forecast, 2019-2031
- 11.1. Market Analysis, Insights and Forecast - By Country/Sub-region
- 11.1.1.
- 12. Europe Gaming Simulators Market Analysis, Insights and Forecast, 2019-2031
- 12.1. Market Analysis, Insights and Forecast - By Country/Sub-region
- 12.1.1.
- 13. Asia Pacific Gaming Simulators Market Analysis, Insights and Forecast, 2019-2031
- 13.1. Market Analysis, Insights and Forecast - By Country/Sub-region
- 13.1.1.
- 14. Middle East and Africa Gaming Simulators Market Analysis, Insights and Forecast, 2019-2031
- 14.1. Market Analysis, Insights and Forecast - By Country/Sub-region
- 14.1.1.
- 15. Rest of the World Gaming Simulators Market Analysis, Insights and Forecast, 2019-2031
- 15.1. Market Analysis, Insights and Forecast - By Country/Sub-region
- 15.1.1.
- 16. Competitive Analysis
- 16.1. Global Market Share Analysis 2024
- 16.2. Company Profiles
- 16.2.1 Microsoft
- 16.2.1.1. Overview
- 16.2.1.2. Products
- 16.2.1.3. SWOT Analysis
- 16.2.1.4. Recent Developments
- 16.2.1.5. Financials (Based on Availability)
- 16.2.2 Electronic Arts Inc
- 16.2.2.1. Overview
- 16.2.2.2. Products
- 16.2.2.3. SWOT Analysis
- 16.2.2.4. Recent Developments
- 16.2.2.5. Financials (Based on Availability)
- 16.2.3 NetEase Inc
- 16.2.3.1. Overview
- 16.2.3.2. Products
- 16.2.3.3. SWOT Analysis
- 16.2.3.4. Recent Developments
- 16.2.3.5. Financials (Based on Availability)
- 16.2.4 Nintendo
- 16.2.4.1. Overview
- 16.2.4.2. Products
- 16.2.4.3. SWOT Analysis
- 16.2.4.4. Recent Developments
- 16.2.4.5. Financials (Based on Availability)
- 16.2.5 Sony Interactive Entertainment Inc
- 16.2.5.1. Overview
- 16.2.5.2. Products
- 16.2.5.3. SWOT Analysis
- 16.2.5.4. Recent Developments
- 16.2.5.5. Financials (Based on Availability)
- 16.2.6 Activision Blizzard Inc
- 16.2.6.1. Overview
- 16.2.6.2. Products
- 16.2.6.3. SWOT Analysis
- 16.2.6.4. Recent Developments
- 16.2.6.5. Financials (Based on Availability)
- 16.2.7 Tencent
- 16.2.7.1. Overview
- 16.2.7.2. Products
- 16.2.7.3. SWOT Analysis
- 16.2.7.4. Recent Developments
- 16.2.7.5. Financials (Based on Availability)
- 16.2.8 Square Enix Co Ltd *List Not Exhaustive
- 16.2.8.1. Overview
- 16.2.8.2. Products
- 16.2.8.3. SWOT Analysis
- 16.2.8.4. Recent Developments
- 16.2.8.5. Financials (Based on Availability)
- 16.2.9 Take-Two Interactive Software Inc
- 16.2.9.1. Overview
- 16.2.9.2. Products
- 16.2.9.3. SWOT Analysis
- 16.2.9.4. Recent Developments
- 16.2.9.5. Financials (Based on Availability)
- 16.2.10 Bandai Namco Entertainment Inc
- 16.2.10.1. Overview
- 16.2.10.2. Products
- 16.2.10.3. SWOT Analysis
- 16.2.10.4. Recent Developments
- 16.2.10.5. Financials (Based on Availability)
- 16.2.1 Microsoft
List of Figures
- Figure 1: Global Gaming Simulators Market Revenue Breakdown (Million, %) by Region 2024 & 2032
- Figure 2: North America Gaming Simulators Market Revenue (Million), by Country 2024 & 2032
- Figure 3: North America Gaming Simulators Market Revenue Share (%), by Country 2024 & 2032
- Figure 4: Europe Gaming Simulators Market Revenue (Million), by Country 2024 & 2032
- Figure 5: Europe Gaming Simulators Market Revenue Share (%), by Country 2024 & 2032
- Figure 6: Asia Pacific Gaming Simulators Market Revenue (Million), by Country 2024 & 2032
- Figure 7: Asia Pacific Gaming Simulators Market Revenue Share (%), by Country 2024 & 2032
- Figure 8: Middle East and Africa Gaming Simulators Market Revenue (Million), by Country 2024 & 2032
- Figure 9: Middle East and Africa Gaming Simulators Market Revenue Share (%), by Country 2024 & 2032
- Figure 10: Rest of the World Gaming Simulators Market Revenue (Million), by Country 2024 & 2032
- Figure 11: Rest of the World Gaming Simulators Market Revenue Share (%), by Country 2024 & 2032
- Figure 12: North America Gaming Simulators Market Revenue (Million), by Type 2024 & 2032
- Figure 13: North America Gaming Simulators Market Revenue Share (%), by Type 2024 & 2032
- Figure 14: North America Gaming Simulators Market Revenue (Million), by Country 2024 & 2032
- Figure 15: North America Gaming Simulators Market Revenue Share (%), by Country 2024 & 2032
- Figure 16: Europe Gaming Simulators Market Revenue (Million), by Type 2024 & 2032
- Figure 17: Europe Gaming Simulators Market Revenue Share (%), by Type 2024 & 2032
- Figure 18: Europe Gaming Simulators Market Revenue (Million), by Country 2024 & 2032
- Figure 19: Europe Gaming Simulators Market Revenue Share (%), by Country 2024 & 2032
- Figure 20: Asia Gaming Simulators Market Revenue (Million), by Type 2024 & 2032
- Figure 21: Asia Gaming Simulators Market Revenue Share (%), by Type 2024 & 2032
- Figure 22: Asia Gaming Simulators Market Revenue (Million), by Country 2024 & 2032
- Figure 23: Asia Gaming Simulators Market Revenue Share (%), by Country 2024 & 2032
- Figure 24: Middle East and Africa Gaming Simulators Market Revenue (Million), by Type 2024 & 2032
- Figure 25: Middle East and Africa Gaming Simulators Market Revenue Share (%), by Type 2024 & 2032
- Figure 26: Middle East and Africa Gaming Simulators Market Revenue (Million), by Country 2024 & 2032
- Figure 27: Middle East and Africa Gaming Simulators Market Revenue Share (%), by Country 2024 & 2032
- Figure 28: Latin America Gaming Simulators Market Revenue (Million), by Type 2024 & 2032
- Figure 29: Latin America Gaming Simulators Market Revenue Share (%), by Type 2024 & 2032
- Figure 30: Latin America Gaming Simulators Market Revenue (Million), by Country 2024 & 2032
- Figure 31: Latin America Gaming Simulators Market Revenue Share (%), by Country 2024 & 2032
List of Tables
- Table 1: Global Gaming Simulators Market Revenue Million Forecast, by Region 2019 & 2032
- Table 2: Global Gaming Simulators Market Revenue Million Forecast, by Type 2019 & 2032
- Table 3: Global Gaming Simulators Market Revenue Million Forecast, by Region 2019 & 2032
- Table 4: Global Gaming Simulators Market Revenue Million Forecast, by Country 2019 & 2032
- Table 5: Gaming Simulators Market Revenue (Million) Forecast, by Application 2019 & 2032
- Table 6: Global Gaming Simulators Market Revenue Million Forecast, by Country 2019 & 2032
- Table 7: Gaming Simulators Market Revenue (Million) Forecast, by Application 2019 & 2032
- Table 8: Global Gaming Simulators Market Revenue Million Forecast, by Country 2019 & 2032
- Table 9: Gaming Simulators Market Revenue (Million) Forecast, by Application 2019 & 2032
- Table 10: Global Gaming Simulators Market Revenue Million Forecast, by Country 2019 & 2032
- Table 11: Gaming Simulators Market Revenue (Million) Forecast, by Application 2019 & 2032
- Table 12: Global Gaming Simulators Market Revenue Million Forecast, by Country 2019 & 2032
- Table 13: Gaming Simulators Market Revenue (Million) Forecast, by Application 2019 & 2032
- Table 14: Global Gaming Simulators Market Revenue Million Forecast, by Type 2019 & 2032
- Table 15: Global Gaming Simulators Market Revenue Million Forecast, by Country 2019 & 2032
- Table 16: Global Gaming Simulators Market Revenue Million Forecast, by Type 2019 & 2032
- Table 17: Global Gaming Simulators Market Revenue Million Forecast, by Country 2019 & 2032
- Table 18: Global Gaming Simulators Market Revenue Million Forecast, by Type 2019 & 2032
- Table 19: Global Gaming Simulators Market Revenue Million Forecast, by Country 2019 & 2032
- Table 20: Global Gaming Simulators Market Revenue Million Forecast, by Type 2019 & 2032
- Table 21: Global Gaming Simulators Market Revenue Million Forecast, by Country 2019 & 2032
- Table 22: Global Gaming Simulators Market Revenue Million Forecast, by Type 2019 & 2032
- Table 23: Global Gaming Simulators Market Revenue Million Forecast, by Country 2019 & 2032
Frequently Asked Questions
1. What is the projected Compound Annual Growth Rate (CAGR) of the Gaming Simulators Market?
The projected CAGR is approximately 13.49%.
2. Which companies are prominent players in the Gaming Simulators Market?
Key companies in the market include Microsoft, Electronic Arts Inc, NetEase Inc, Nintendo, Sony Interactive Entertainment Inc, Activision Blizzard Inc, Tencent, Square Enix Co Ltd *List Not Exhaustive, Take-Two Interactive Software Inc, Bandai Namco Entertainment Inc.
3. What are the main segments of the Gaming Simulators Market?
The market segments include Type.
4. Can you provide details about the market size?
The market size is estimated to be USD 8.14 Million as of 2022.
5. What are some drivers contributing to market growth?
Increased Adoption of Smartphones; Increased Utilization of Gaming Simulation for Training and Analysis Across a Variety of Fields; Growing Demand for VR Headsets.
6. What are the notable trends driving market growth?
Increased Adoption of Smartphones is Expected to Drive the Market Growth.
7. Are there any restraints impacting market growth?
Need for Expensive Graphic Cards.
8. Can you provide examples of recent developments in the market?
February 2022 - Gran Turismo SophyTM, the first superhuman AI agent to exceed the world's prominent drivers in the realistic PlayStation 4 racing simulation game Gran Turismo Sport, was announced by Polyphony Digital Inc. (PDI), and Sony Interactive Entertainment (SIE). Gamers all across the world will be able to access AI-powered gaming experiences delivered by GT Sophy.
9. What pricing options are available for accessing the report?
Pricing options include single-user, multi-user, and enterprise licenses priced at USD 4750, USD 5250, and USD 8750 respectively.
10. Is the market size provided in terms of value or volume?
The market size is provided in terms of value, measured in Million.
11. Are there any specific market keywords associated with the report?
Yes, the market keyword associated with the report is "Gaming Simulators Market," which aids in identifying and referencing the specific market segment covered.
12. How do I determine which pricing option suits my needs best?
The pricing options vary based on user requirements and access needs. Individual users may opt for single-user licenses, while businesses requiring broader access may choose multi-user or enterprise licenses for cost-effective access to the report.
13. Are there any additional resources or data provided in the Gaming Simulators Market report?
While the report offers comprehensive insights, it's advisable to review the specific contents or supplementary materials provided to ascertain if additional resources or data are available.
14. How can I stay updated on further developments or reports in the Gaming Simulators Market?
To stay informed about further developments, trends, and reports in the Gaming Simulators Market, consider subscribing to industry newsletters, following relevant companies and organizations, or regularly checking reputable industry news sources and publications.
Methodology
Step 1 - Identification of Relevant Samples Size from Population Database


Step 2 - Approaches for Defining Global Market Size (Value, Volume* & Price*)

Note*: In applicable scenarios
Step 3 - Data Sources
Primary Research
- Web Analytics
- Survey Reports
- Research Institute
- Latest Research Reports
- Opinion Leaders
Secondary Research
- Annual Reports
- White Paper
- Latest Press Release
- Industry Association
- Paid Database
- Investor Presentations

Step 4 - Data Triangulation
Involves using different sources of information in order to increase the validity of a study
These sources are likely to be stakeholders in a program - participants, other researchers, program staff, other community members, and so on.
Then we put all data in single framework & apply various statistical tools to find out the dynamic on the market.
During the analysis stage, feedback from the stakeholder groups would be compared to determine areas of agreement as well as areas of divergence
