

Key Insights
The global Gas Chromatography (GC) market is projected to reach $4.43 billion by 2025, with a Compound Annual Growth Rate (CAGR) of 6.6% from 2025 to 2033. Key growth drivers include the expanding pharmaceutical and biopharmaceutical sectors' demand for advanced analytical solutions in quality control and R&D. The increasing global burden of chronic diseases also necessitates rapid and accurate drug development, further stimulating market expansion. Technological innovations, such as miniaturized GC systems and highly sensitive detectors, are pivotal to this growth. Additionally, the expanding applications in environmental monitoring and food safety testing are broadening the market's scope. Despite challenges like the high cost of advanced GC instrumentation and competition from techniques like mass spectrometry, the market is poised for strong growth, particularly in industrialized emerging economies with burgeoning healthcare sectors.
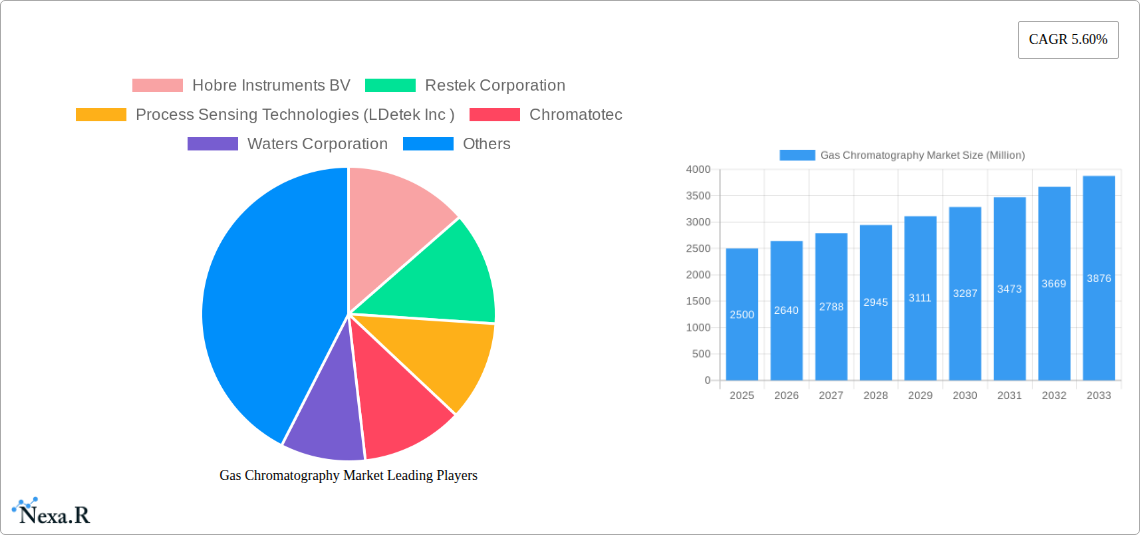
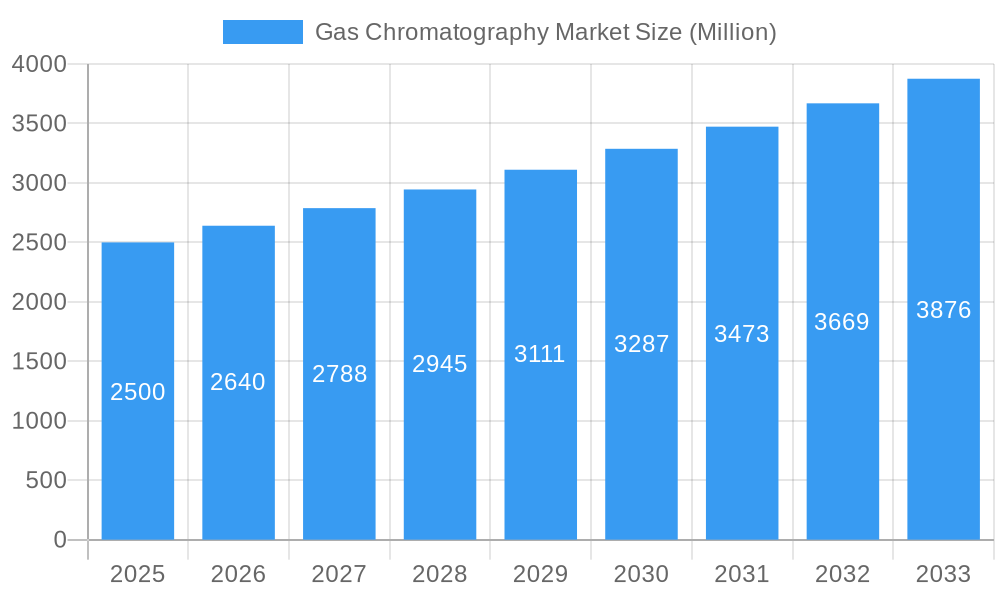
Gas Chromatography Market Market Size (In Billion)
The pharmaceutical and biopharmaceutical industries represent a substantial market segment, underscoring their critical reliance on precise analytical methods for drug discovery and assurance. Academic research institutions also contribute significantly due to ongoing scientific investigations. In terms of product segmentation, systems and detectors command the largest share, forming the core components of GC analysis. Geographically, North America and Europe currently lead the market, benefiting from established industry players and stringent regulatory environments. However, the Asia-Pacific region is expected to experience accelerated growth, driven by increased investment in healthcare infrastructure and heightened environmental regulatory awareness. Leading companies such as Agilent Technologies, Thermo Fisher Scientific, and Waters Corporation are strategically positioned to leverage these trends through innovation and partnerships. The competitive landscape is dynamic, featuring both established leaders and emerging entrants.
Gas Chromatography Market Company Market Share
This report offers a comprehensive analysis of the Gas Chromatography (GC) market, covering market dynamics, growth trajectories, regional segmentation, product segmentation, key industry players, and future projections. The analysis period spans from 2019 to 2033, with 2025 designated as the base year. This research is indispensable for industry professionals, investors, and researchers seeking to understand this critical analytical technology market. The market is forecast to reach substantial value by 2033.
Gas Chromatography Market Dynamics & Structure
This section analyzes the competitive landscape of the Gas Chromatography market, considering market concentration, technological advancements, regulatory influence, and market dynamics. The report delves into the parent market of analytical instruments and the child market of gas chromatography, providing a comprehensive understanding of the market's structure. We examine the impact of mergers and acquisitions (M&A) activities on market consolidation, analyzing deal volumes and their implications for market share distribution.
- Market Concentration: The GC market exhibits a moderately concentrated structure, with key players holding significant market share. The report quantifies this concentration using metrics like the Herfindahl-Hirschman Index (HHI) and assesses the potential for future consolidation. xx% of the market is currently dominated by the top 5 players.
- Technological Innovation: Continuous advancements in detector technology, miniaturization, and automation are driving market growth. We identify key innovation barriers and analyze their impact on market expansion.
- Regulatory Framework: The influence of regulatory bodies on the adoption of GC technology across various industries is evaluated, considering factors like safety standards and environmental regulations.
- Competitive Substitutes: The report explores alternative analytical techniques and their competitive impact on the GC market. The adoption of mass spectrometry (MS) coupled with GC is also analyzed.
- End-User Demographics: The report segments the end-user market into Pharmaceutical and Biopharmaceutical Industries, Academic Research Institutes, and Other End-Users, analyzing their respective market shares and growth prospects.
- M&A Trends: The report analyzes recent M&A activity in the GC market, identifying key drivers and their influence on market concentration and innovation. An estimated xx M&A deals occurred in the period 2019-2024.
Gas Chromatography Market Growth Trends & Insights
This section presents a comprehensive analysis of the Gas Chromatography market's growth trajectory, leveraging robust data and insightful trends to illustrate market size evolution, adoption rates, transformative technological disruptions, and crucial shifts in consumer behavior. The report projects a Compound Annual Growth Rate (CAGR) of [Insert Specific CAGR Here]% during the forecast period (2025-2033).
The global Gas Chromatography market size is anticipated to expand from approximately [Insert Specific Market Size 2025 Million Here] Million in 2025 to an estimated [Insert Specific Market Size 2033 Million Here] Million by 2033. This significant growth is propelled by an escalating demand from the pharmaceutical sector, coupled with the relentless development and adoption of high-throughput screening methods across various analytical applications. The report delves into the market penetration of advanced GC systems across diverse application areas, pinpointing regions and specific segments that are demonstrating exceptional growth potential. Furthermore, it critically examines the impact of groundbreaking technological disruptions, such as the advent of novel detector technologies and sophisticated software advancements, on the overall market dynamics. In tandem, evolving consumer behavior, characterized by an increasing preference for highly automated systems and enhanced throughput capabilities, is analyzed in detail for its profound influence on market demand.
Dominant Regions, Countries, or Segments in Gas Chromatography Market
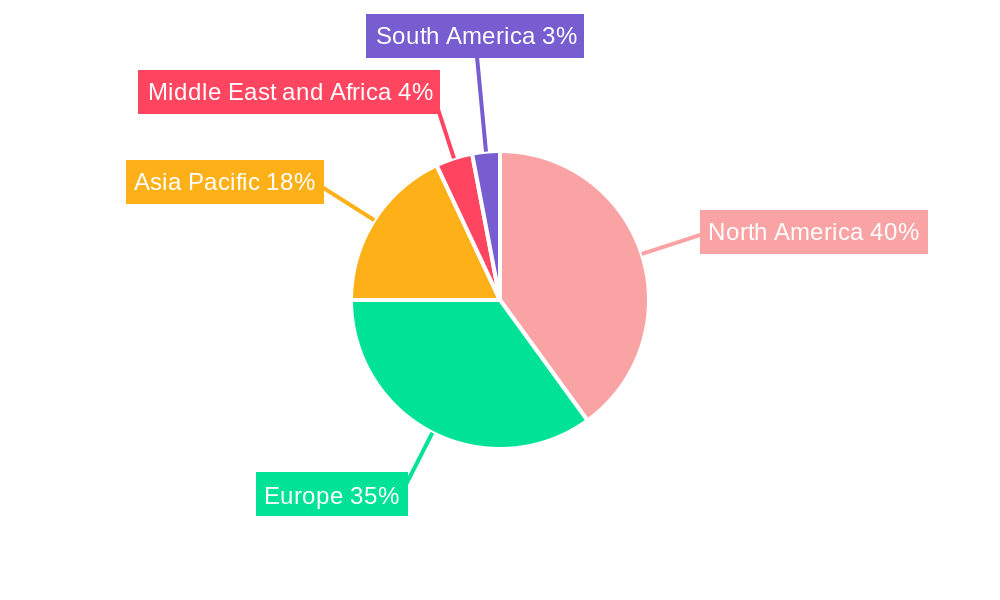
This section meticulously identifies the leading regions, countries, and pivotal segments (categorized by Product and End-User) that are currently driving the substantial growth within the Gas Chromatography market. North America presently commands the largest market share, closely followed by the dynamic markets of Europe and the rapidly expanding Asia Pacific region.
- Product Segment: The Systems segment is projected to maintain its dominance, fueled by the increasing global demand for comprehensive and integrated GC solutions. Concurrently, the Detectors segment is poised for remarkable growth, largely attributed to ongoing innovations and advancements in detector technology that enhance sensitivity and specificity.
- End-User Segment: The Pharmaceutical and Biopharmaceutical Industries segment stands out as the largest and most influential end-user category. This dominance is a direct consequence of stringent regulatory requirements for quality control and the unwavering need for highly precise analytical measurements in drug discovery, development, and manufacturing. The Academic Research Institutes segment also plays a crucial role as a significant contributor, driven by extensive research and development activities pushing the boundaries of scientific discovery.
- Geographic Dominance: North America is strategically positioned to sustain its leadership in the Gas Chromatography market, underpinned by its well-established research infrastructure, a robust ecosystem of key market players, and significant investment in scientific innovation.
Key catalysts underpinning regional dominance include supportive government policies fostering scientific advancement, robust economic growth fueling investment in analytical technologies, and a highly developed infrastructure dedicated to research and development activities.
Gas Chromatography Market Product Landscape
The Gas Chromatography market offers a wide range of products, including systems, detectors, autosamplers, fraction collectors, and other related accessories. Recent innovations focus on enhanced sensitivity, improved automation, and reduced analysis time. New detectors with enhanced selectivity and sensitivity continue to emerge, alongside software advancements that improve data analysis and reporting. Key selling propositions include ease of use, robust performance, and compatibility with various sample matrices. Technological advancements, such as the integration of artificial intelligence and machine learning, are improving data interpretation and automating workflow processes.
Key Drivers, Barriers & Challenges in Gas Chromatography Market
Key Drivers:
- Increasing demand from pharmaceutical and biopharmaceutical industries for quality control and analysis.
- Growing applications in environmental monitoring and food safety testing.
- Advancements in detector technology leading to improved sensitivity and selectivity.
- Growing adoption of GC-MS and other hyphenated techniques.
Key Challenges and Restraints:
- High initial investment costs associated with purchasing GC systems.
- Complex operation and maintenance requirements.
- The emergence of alternative analytical techniques.
- Supply chain disruptions impacting the availability of components and consumables. The impact of these disruptions is estimated to reduce market growth by approximately xx% in 2024.
Emerging Opportunities in Gas Chromatography Market
Emerging opportunities in the Gas Chromatography market include:
- Expanding applications in emerging markets such as those in developing countries where the infrastructure for analytical testing is still underdeveloped.
- Development of portable and miniaturized GC systems for on-site analysis.
- Integration of GC with other analytical techniques such as mass spectrometry (MS) and high-performance liquid chromatography (HPLC).
- Increasing demand for specialized GC applications in various fields like forensic science and petrochemical analysis.
Growth Accelerators in the Gas Chromatography Market Industry
Long-term growth in the Gas Chromatography market will be driven by several factors, including technological breakthroughs like the development of new detectors with enhanced sensitivity and selectivity. Strategic partnerships between instrument manufacturers and software developers can result in efficient data handling and analysis. Continued expansion into emerging markets, driven by growing awareness of the importance of analytical testing, will further fuel market growth.
Key Players Shaping the Gas Chromatography Market Market
Notable Milestones in Gas Chromatography Market Sector
- March 2022: Thermo Fisher Scientific launched a collection of new gas chromatography (GC) and GC-MS instruments offering innovative hardware and software updates. This significantly enhanced the capabilities of existing GC systems, improving analysis speed, sensitivity, and data handling.
- June 2022: PerkinElmer, Inc. launched the GC 2400 Platform, an advanced, automated gas chromatography (GC), headspace sampler, and GC-MS solution. This integrated platform streamlined workflows and improved precision, impacting lab operations and driving adoption.
In-Depth Gas Chromatography Market Market Outlook
The Gas Chromatography market is poised for sustained growth, driven by continued technological advancements, expanding applications across various industries, and increasing demand from emerging economies. Strategic acquisitions and partnerships among key players will further shape market dynamics. The focus on developing user-friendly, automated, and high-throughput systems will play a vital role in driving future market expansion. The predicted market value reflects a strong upward trend, presenting significant opportunities for investment and growth in the coming years.
Gas Chromatography Market Segmentation
-
1. Product
- 1.1. Systems
- 1.2. Detectors
- 1.3. Auto-samplers
- 1.4. Fraction Collectors
- 1.5. Other Products
-
2. End-User
- 2.1. Pharmaceutical and Biopharmaceutical Industries
- 2.2. Academic Research Institutes
- 2.3. Other End-Users
Gas Chromatography Market Segmentation By Geography
-
1. North America
- 1.1. United States
- 1.2. Canada
- 1.3. Mexico
-
2. Europe
- 2.1. Germany
- 2.2. United Kingdom
- 2.3. France
- 2.4. Italy
- 2.5. Spain
- 2.6. Rest of Europe
-
3. Asia Pacific
- 3.1. China
- 3.2. Japan
- 3.3. India
- 3.4. Australia
- 3.5. South korea
- 3.6. Rest of Asia Pacific
-
4. Middle East and Africa
- 4.1. GCC
- 4.2. South Africa
- 4.3. Rest of Middle East and Africa
-
5. South America
- 5.1. Brazil
- 5.2. Argentina
- 5.3. Rest of South America
Gas Chromatography Market Regional Market Share
Geographic Coverage of Gas Chromatography Market
Gas Chromatography Market REPORT HIGHLIGHTS
| Aspects | Details |
|---|---|
| Study Period | 2020-2034 |
| Base Year | 2025 |
| Estimated Year | 2026 |
| Forecast Period | 2026-2034 |
| Historical Period | 2020-2025 |
| Growth Rate | CAGR of 6.6% from 2020-2034 |
| Segmentation |
|
Table of Contents
- 1. Introduction
- 1.1. Research Scope
- 1.2. Market Segmentation
- 1.3. Research Objective
- 1.4. Definitions and Assumptions
- 2. Executive Summary
- 2.1. Market Snapshot
- 3. Market Dynamics
- 3.1. Market Drivers
- 3.2. Market Restrains
- 3.3. Market Trends
- 3.4. Market Opportunities
- 4. Market Factor Analysis
- 4.1. Porters Five Forces
- 4.1.1. Bargaining Power of Suppliers
- 4.1.2. Bargaining Power of Buyers
- 4.1.3. Threat of New Entrants
- 4.1.4. Threat of Substitutes
- 4.1.5. Competitive Rivalry
- 4.2. PESTEL analysis
- 4.3. BCG Analysis
- 4.3.1. Stars (High Growth, High Market Share)
- 4.3.2. Cash Cows (Low Growth, High Market Share)
- 4.3.3. Question Mark (High Growth, Low Market Share)
- 4.3.4. Dogs (Low Growth, Low Market Share)
- 4.4. Ansoff Matrix Analysis
- 4.5. Supply Chain Analysis
- 4.6. Regulatory Landscape
- 4.7. Current Market Potential and Opportunity Assessment (TAM–SAM–SOM Framework)
- 4.8. NRP Analyst Note
- 4.1. Porters Five Forces
- 5. Market Analysis, Insights and Forecast 2021-2033
- 5.1. Market Analysis, Insights and Forecast - by Product
- 5.1.1. Systems
- 5.1.2. Detectors
- 5.1.3. Auto-samplers
- 5.1.4. Fraction Collectors
- 5.1.5. Other Products
- 5.2. Market Analysis, Insights and Forecast - by End-User
- 5.2.1. Pharmaceutical and Biopharmaceutical Industries
- 5.2.2. Academic Research Institutes
- 5.2.3. Other End-Users
- 5.3. Market Analysis, Insights and Forecast - by Region
- 5.3.1. North America
- 5.3.2. Europe
- 5.3.3. Asia Pacific
- 5.3.4. Middle East and Africa
- 5.3.5. South America
- 5.1. Market Analysis, Insights and Forecast - by Product
- 6. Global Gas Chromatography Market Analysis, Insights and Forecast, 2021-2033
- 6.1. Market Analysis, Insights and Forecast - by Product
- 6.1.1. Systems
- 6.1.2. Detectors
- 6.1.3. Auto-samplers
- 6.1.4. Fraction Collectors
- 6.1.5. Other Products
- 6.2. Market Analysis, Insights and Forecast - by End-User
- 6.2.1. Pharmaceutical and Biopharmaceutical Industries
- 6.2.2. Academic Research Institutes
- 6.2.3. Other End-Users
- 6.1. Market Analysis, Insights and Forecast - by Product
- 7. North America Gas Chromatography Market Analysis, Insights and Forecast, 2020-2032
- 7.1. Market Analysis, Insights and Forecast - by Product
- 7.1.1. Systems
- 7.1.2. Detectors
- 7.1.3. Auto-samplers
- 7.1.4. Fraction Collectors
- 7.1.5. Other Products
- 7.2. Market Analysis, Insights and Forecast - by End-User
- 7.2.1. Pharmaceutical and Biopharmaceutical Industries
- 7.2.2. Academic Research Institutes
- 7.2.3. Other End-Users
- 7.1. Market Analysis, Insights and Forecast - by Product
- 8. Europe Gas Chromatography Market Analysis, Insights and Forecast, 2020-2032
- 8.1. Market Analysis, Insights and Forecast - by Product
- 8.1.1. Systems
- 8.1.2. Detectors
- 8.1.3. Auto-samplers
- 8.1.4. Fraction Collectors
- 8.1.5. Other Products
- 8.2. Market Analysis, Insights and Forecast - by End-User
- 8.2.1. Pharmaceutical and Biopharmaceutical Industries
- 8.2.2. Academic Research Institutes
- 8.2.3. Other End-Users
- 8.1. Market Analysis, Insights and Forecast - by Product
- 9. Asia Pacific Gas Chromatography Market Analysis, Insights and Forecast, 2020-2032
- 9.1. Market Analysis, Insights and Forecast - by Product
- 9.1.1. Systems
- 9.1.2. Detectors
- 9.1.3. Auto-samplers
- 9.1.4. Fraction Collectors
- 9.1.5. Other Products
- 9.2. Market Analysis, Insights and Forecast - by End-User
- 9.2.1. Pharmaceutical and Biopharmaceutical Industries
- 9.2.2. Academic Research Institutes
- 9.2.3. Other End-Users
- 9.1. Market Analysis, Insights and Forecast - by Product
- 10. Middle East and Africa Gas Chromatography Market Analysis, Insights and Forecast, 2020-2032
- 10.1. Market Analysis, Insights and Forecast - by Product
- 10.1.1. Systems
- 10.1.2. Detectors
- 10.1.3. Auto-samplers
- 10.1.4. Fraction Collectors
- 10.1.5. Other Products
- 10.2. Market Analysis, Insights and Forecast - by End-User
- 10.2.1. Pharmaceutical and Biopharmaceutical Industries
- 10.2.2. Academic Research Institutes
- 10.2.3. Other End-Users
- 10.1. Market Analysis, Insights and Forecast - by Product
- 11. South America Gas Chromatography Market Analysis, Insights and Forecast, 2020-2032
- 11.1. Market Analysis, Insights and Forecast - by Product
- 11.1.1. Systems
- 11.1.2. Detectors
- 11.1.3. Auto-samplers
- 11.1.4. Fraction Collectors
- 11.1.5. Other Products
- 11.2. Market Analysis, Insights and Forecast - by End-User
- 11.2.1. Pharmaceutical and Biopharmaceutical Industries
- 11.2.2. Academic Research Institutes
- 11.2.3. Other End-Users
- 11.1. Market Analysis, Insights and Forecast - by Product
- 12. Competitive Analysis
- 12.1. Company Profiles
- 12.1.1 Hobre Instruments BV
- 12.1.1.1. Company Overview
- 12.1.1.2. Products
- 12.1.1.3. Company Financials
- 12.1.1.4. SWOT Analysis
- 12.1.2 Restek Corporation
- 12.1.2.1. Company Overview
- 12.1.2.2. Products
- 12.1.2.3. Company Financials
- 12.1.2.4. SWOT Analysis
- 12.1.3 Process Sensing Technologies (LDetek Inc )
- 12.1.3.1. Company Overview
- 12.1.3.2. Products
- 12.1.3.3. Company Financials
- 12.1.3.4. SWOT Analysis
- 12.1.4 Chromatotec
- 12.1.4.1. Company Overview
- 12.1.4.2. Products
- 12.1.4.3. Company Financials
- 12.1.4.4. SWOT Analysis
- 12.1.5 Waters Corporation
- 12.1.5.1. Company Overview
- 12.1.5.2. Products
- 12.1.5.3. Company Financials
- 12.1.5.4. SWOT Analysis
- 12.1.6 Thermo Fisher Scientific Inc
- 12.1.6.1. Company Overview
- 12.1.6.2. Products
- 12.1.6.3. Company Financials
- 12.1.6.4. SWOT Analysis
- 12.1.7 Danaher Corporation
- 12.1.7.1. Company Overview
- 12.1.7.2. Products
- 12.1.7.3. Company Financials
- 12.1.7.4. SWOT Analysis
- 12.1.8 Agilent Technologies Inc
- 12.1.8.1. Company Overview
- 12.1.8.2. Products
- 12.1.8.3. Company Financials
- 12.1.8.4. SWOT Analysis
- 12.1.9 Sartorius
- 12.1.9.1. Company Overview
- 12.1.9.2. Products
- 12.1.9.3. Company Financials
- 12.1.9.4. SWOT Analysis
- 12.1.10 Merck KgaA
- 12.1.10.1. Company Overview
- 12.1.10.2. Products
- 12.1.10.3. Company Financials
- 12.1.10.4. SWOT Analysis
- 12.1.11 PerkinElmer Inc
- 12.1.11.1. Company Overview
- 12.1.11.2. Products
- 12.1.11.3. Company Financials
- 12.1.11.4. SWOT Analysis
- 12.1.12 Scion Instruments
- 12.1.12.1. Company Overview
- 12.1.12.2. Products
- 12.1.12.3. Company Financials
- 12.1.12.4. SWOT Analysis
- 12.1.13 Air Liquide
- 12.1.13.1. Company Overview
- 12.1.13.2. Products
- 12.1.13.3. Company Financials
- 12.1.13.4. SWOT Analysis
- 12.1.14 Teledyne Technologies
- 12.1.14.1. Company Overview
- 12.1.14.2. Products
- 12.1.14.3. Company Financials
- 12.1.14.4. SWOT Analysis
- 12.1.15 Shimadzu Corporation
- 12.1.15.1. Company Overview
- 12.1.15.2. Products
- 12.1.15.3. Company Financials
- 12.1.15.4. SWOT Analysis
- 12.1.1 Hobre Instruments BV
- 12.2. Market Entropy
- 12.2.1 Company's Key Areas Served
- 12.2.2 Recent Developments
- 12.3. Company Market Share Analysis 2025
- 12.3.1 Top 5 Companies Market Share Analysis
- 12.3.2 Top 3 Companies Market Share Analysis
- 12.4. List of Potential Customers
- 13. Research Methodology
List of Figures
- Figure 1: Global Gas Chromatography Market Revenue Breakdown (billion, %) by Region 2025 & 2033
- Figure 2: Global Gas Chromatography Market Volume Breakdown (K Unit, %) by Region 2025 & 2033
- Figure 3: North America Gas Chromatography Market Revenue (billion), by Product 2025 & 2033
- Figure 4: North America Gas Chromatography Market Volume (K Unit), by Product 2025 & 2033
- Figure 5: North America Gas Chromatography Market Revenue Share (%), by Product 2025 & 2033
- Figure 6: North America Gas Chromatography Market Volume Share (%), by Product 2025 & 2033
- Figure 7: North America Gas Chromatography Market Revenue (billion), by End-User 2025 & 2033
- Figure 8: North America Gas Chromatography Market Volume (K Unit), by End-User 2025 & 2033
- Figure 9: North America Gas Chromatography Market Revenue Share (%), by End-User 2025 & 2033
- Figure 10: North America Gas Chromatography Market Volume Share (%), by End-User 2025 & 2033
- Figure 11: North America Gas Chromatography Market Revenue (billion), by Country 2025 & 2033
- Figure 12: North America Gas Chromatography Market Volume (K Unit), by Country 2025 & 2033
- Figure 13: North America Gas Chromatography Market Revenue Share (%), by Country 2025 & 2033
- Figure 14: North America Gas Chromatography Market Volume Share (%), by Country 2025 & 2033
- Figure 15: Europe Gas Chromatography Market Revenue (billion), by Product 2025 & 2033
- Figure 16: Europe Gas Chromatography Market Volume (K Unit), by Product 2025 & 2033
- Figure 17: Europe Gas Chromatography Market Revenue Share (%), by Product 2025 & 2033
- Figure 18: Europe Gas Chromatography Market Volume Share (%), by Product 2025 & 2033
- Figure 19: Europe Gas Chromatography Market Revenue (billion), by End-User 2025 & 2033
- Figure 20: Europe Gas Chromatography Market Volume (K Unit), by End-User 2025 & 2033
- Figure 21: Europe Gas Chromatography Market Revenue Share (%), by End-User 2025 & 2033
- Figure 22: Europe Gas Chromatography Market Volume Share (%), by End-User 2025 & 2033
- Figure 23: Europe Gas Chromatography Market Revenue (billion), by Country 2025 & 2033
- Figure 24: Europe Gas Chromatography Market Volume (K Unit), by Country 2025 & 2033
- Figure 25: Europe Gas Chromatography Market Revenue Share (%), by Country 2025 & 2033
- Figure 26: Europe Gas Chromatography Market Volume Share (%), by Country 2025 & 2033
- Figure 27: Asia Pacific Gas Chromatography Market Revenue (billion), by Product 2025 & 2033
- Figure 28: Asia Pacific Gas Chromatography Market Volume (K Unit), by Product 2025 & 2033
- Figure 29: Asia Pacific Gas Chromatography Market Revenue Share (%), by Product 2025 & 2033
- Figure 30: Asia Pacific Gas Chromatography Market Volume Share (%), by Product 2025 & 2033
- Figure 31: Asia Pacific Gas Chromatography Market Revenue (billion), by End-User 2025 & 2033
- Figure 32: Asia Pacific Gas Chromatography Market Volume (K Unit), by End-User 2025 & 2033
- Figure 33: Asia Pacific Gas Chromatography Market Revenue Share (%), by End-User 2025 & 2033
- Figure 34: Asia Pacific Gas Chromatography Market Volume Share (%), by End-User 2025 & 2033
- Figure 35: Asia Pacific Gas Chromatography Market Revenue (billion), by Country 2025 & 2033
- Figure 36: Asia Pacific Gas Chromatography Market Volume (K Unit), by Country 2025 & 2033
- Figure 37: Asia Pacific Gas Chromatography Market Revenue Share (%), by Country 2025 & 2033
- Figure 38: Asia Pacific Gas Chromatography Market Volume Share (%), by Country 2025 & 2033
- Figure 39: Middle East and Africa Gas Chromatography Market Revenue (billion), by Product 2025 & 2033
- Figure 40: Middle East and Africa Gas Chromatography Market Volume (K Unit), by Product 2025 & 2033
- Figure 41: Middle East and Africa Gas Chromatography Market Revenue Share (%), by Product 2025 & 2033
- Figure 42: Middle East and Africa Gas Chromatography Market Volume Share (%), by Product 2025 & 2033
- Figure 43: Middle East and Africa Gas Chromatography Market Revenue (billion), by End-User 2025 & 2033
- Figure 44: Middle East and Africa Gas Chromatography Market Volume (K Unit), by End-User 2025 & 2033
- Figure 45: Middle East and Africa Gas Chromatography Market Revenue Share (%), by End-User 2025 & 2033
- Figure 46: Middle East and Africa Gas Chromatography Market Volume Share (%), by End-User 2025 & 2033
- Figure 47: Middle East and Africa Gas Chromatography Market Revenue (billion), by Country 2025 & 2033
- Figure 48: Middle East and Africa Gas Chromatography Market Volume (K Unit), by Country 2025 & 2033
- Figure 49: Middle East and Africa Gas Chromatography Market Revenue Share (%), by Country 2025 & 2033
- Figure 50: Middle East and Africa Gas Chromatography Market Volume Share (%), by Country 2025 & 2033
- Figure 51: South America Gas Chromatography Market Revenue (billion), by Product 2025 & 2033
- Figure 52: South America Gas Chromatography Market Volume (K Unit), by Product 2025 & 2033
- Figure 53: South America Gas Chromatography Market Revenue Share (%), by Product 2025 & 2033
- Figure 54: South America Gas Chromatography Market Volume Share (%), by Product 2025 & 2033
- Figure 55: South America Gas Chromatography Market Revenue (billion), by End-User 2025 & 2033
- Figure 56: South America Gas Chromatography Market Volume (K Unit), by End-User 2025 & 2033
- Figure 57: South America Gas Chromatography Market Revenue Share (%), by End-User 2025 & 2033
- Figure 58: South America Gas Chromatography Market Volume Share (%), by End-User 2025 & 2033
- Figure 59: South America Gas Chromatography Market Revenue (billion), by Country 2025 & 2033
- Figure 60: South America Gas Chromatography Market Volume (K Unit), by Country 2025 & 2033
- Figure 61: South America Gas Chromatography Market Revenue Share (%), by Country 2025 & 2033
- Figure 62: South America Gas Chromatography Market Volume Share (%), by Country 2025 & 2033
List of Tables
- Table 1: Global Gas Chromatography Market Revenue billion Forecast, by Product 2020 & 2033
- Table 2: Global Gas Chromatography Market Volume K Unit Forecast, by Product 2020 & 2033
- Table 3: Global Gas Chromatography Market Revenue billion Forecast, by End-User 2020 & 2033
- Table 4: Global Gas Chromatography Market Volume K Unit Forecast, by End-User 2020 & 2033
- Table 5: Global Gas Chromatography Market Revenue billion Forecast, by Region 2020 & 2033
- Table 6: Global Gas Chromatography Market Volume K Unit Forecast, by Region 2020 & 2033
- Table 7: Global Gas Chromatography Market Revenue billion Forecast, by Product 2020 & 2033
- Table 8: Global Gas Chromatography Market Volume K Unit Forecast, by Product 2020 & 2033
- Table 9: Global Gas Chromatography Market Revenue billion Forecast, by End-User 2020 & 2033
- Table 10: Global Gas Chromatography Market Volume K Unit Forecast, by End-User 2020 & 2033
- Table 11: Global Gas Chromatography Market Revenue billion Forecast, by Country 2020 & 2033
- Table 12: Global Gas Chromatography Market Volume K Unit Forecast, by Country 2020 & 2033
- Table 13: United States Gas Chromatography Market Revenue (billion) Forecast, by Application 2020 & 2033
- Table 14: United States Gas Chromatography Market Volume (K Unit) Forecast, by Application 2020 & 2033
- Table 15: Canada Gas Chromatography Market Revenue (billion) Forecast, by Application 2020 & 2033
- Table 16: Canada Gas Chromatography Market Volume (K Unit) Forecast, by Application 2020 & 2033
- Table 17: Mexico Gas Chromatography Market Revenue (billion) Forecast, by Application 2020 & 2033
- Table 18: Mexico Gas Chromatography Market Volume (K Unit) Forecast, by Application 2020 & 2033
- Table 19: Global Gas Chromatography Market Revenue billion Forecast, by Product 2020 & 2033
- Table 20: Global Gas Chromatography Market Volume K Unit Forecast, by Product 2020 & 2033
- Table 21: Global Gas Chromatography Market Revenue billion Forecast, by End-User 2020 & 2033
- Table 22: Global Gas Chromatography Market Volume K Unit Forecast, by End-User 2020 & 2033
- Table 23: Global Gas Chromatography Market Revenue billion Forecast, by Country 2020 & 2033
- Table 24: Global Gas Chromatography Market Volume K Unit Forecast, by Country 2020 & 2033
- Table 25: Germany Gas Chromatography Market Revenue (billion) Forecast, by Application 2020 & 2033
- Table 26: Germany Gas Chromatography Market Volume (K Unit) Forecast, by Application 2020 & 2033
- Table 27: United Kingdom Gas Chromatography Market Revenue (billion) Forecast, by Application 2020 & 2033
- Table 28: United Kingdom Gas Chromatography Market Volume (K Unit) Forecast, by Application 2020 & 2033
- Table 29: France Gas Chromatography Market Revenue (billion) Forecast, by Application 2020 & 2033
- Table 30: France Gas Chromatography Market Volume (K Unit) Forecast, by Application 2020 & 2033
- Table 31: Italy Gas Chromatography Market Revenue (billion) Forecast, by Application 2020 & 2033
- Table 32: Italy Gas Chromatography Market Volume (K Unit) Forecast, by Application 2020 & 2033
- Table 33: Spain Gas Chromatography Market Revenue (billion) Forecast, by Application 2020 & 2033
- Table 34: Spain Gas Chromatography Market Volume (K Unit) Forecast, by Application 2020 & 2033
- Table 35: Rest of Europe Gas Chromatography Market Revenue (billion) Forecast, by Application 2020 & 2033
- Table 36: Rest of Europe Gas Chromatography Market Volume (K Unit) Forecast, by Application 2020 & 2033
- Table 37: Global Gas Chromatography Market Revenue billion Forecast, by Product 2020 & 2033
- Table 38: Global Gas Chromatography Market Volume K Unit Forecast, by Product 2020 & 2033
- Table 39: Global Gas Chromatography Market Revenue billion Forecast, by End-User 2020 & 2033
- Table 40: Global Gas Chromatography Market Volume K Unit Forecast, by End-User 2020 & 2033
- Table 41: Global Gas Chromatography Market Revenue billion Forecast, by Country 2020 & 2033
- Table 42: Global Gas Chromatography Market Volume K Unit Forecast, by Country 2020 & 2033
- Table 43: China Gas Chromatography Market Revenue (billion) Forecast, by Application 2020 & 2033
- Table 44: China Gas Chromatography Market Volume (K Unit) Forecast, by Application 2020 & 2033
- Table 45: Japan Gas Chromatography Market Revenue (billion) Forecast, by Application 2020 & 2033
- Table 46: Japan Gas Chromatography Market Volume (K Unit) Forecast, by Application 2020 & 2033
- Table 47: India Gas Chromatography Market Revenue (billion) Forecast, by Application 2020 & 2033
- Table 48: India Gas Chromatography Market Volume (K Unit) Forecast, by Application 2020 & 2033
- Table 49: Australia Gas Chromatography Market Revenue (billion) Forecast, by Application 2020 & 2033
- Table 50: Australia Gas Chromatography Market Volume (K Unit) Forecast, by Application 2020 & 2033
- Table 51: South korea Gas Chromatography Market Revenue (billion) Forecast, by Application 2020 & 2033
- Table 52: South korea Gas Chromatography Market Volume (K Unit) Forecast, by Application 2020 & 2033
- Table 53: Rest of Asia Pacific Gas Chromatography Market Revenue (billion) Forecast, by Application 2020 & 2033
- Table 54: Rest of Asia Pacific Gas Chromatography Market Volume (K Unit) Forecast, by Application 2020 & 2033
- Table 55: Global Gas Chromatography Market Revenue billion Forecast, by Product 2020 & 2033
- Table 56: Global Gas Chromatography Market Volume K Unit Forecast, by Product 2020 & 2033
- Table 57: Global Gas Chromatography Market Revenue billion Forecast, by End-User 2020 & 2033
- Table 58: Global Gas Chromatography Market Volume K Unit Forecast, by End-User 2020 & 2033
- Table 59: Global Gas Chromatography Market Revenue billion Forecast, by Country 2020 & 2033
- Table 60: Global Gas Chromatography Market Volume K Unit Forecast, by Country 2020 & 2033
- Table 61: GCC Gas Chromatography Market Revenue (billion) Forecast, by Application 2020 & 2033
- Table 62: GCC Gas Chromatography Market Volume (K Unit) Forecast, by Application 2020 & 2033
- Table 63: South Africa Gas Chromatography Market Revenue (billion) Forecast, by Application 2020 & 2033
- Table 64: South Africa Gas Chromatography Market Volume (K Unit) Forecast, by Application 2020 & 2033
- Table 65: Rest of Middle East and Africa Gas Chromatography Market Revenue (billion) Forecast, by Application 2020 & 2033
- Table 66: Rest of Middle East and Africa Gas Chromatography Market Volume (K Unit) Forecast, by Application 2020 & 2033
- Table 67: Global Gas Chromatography Market Revenue billion Forecast, by Product 2020 & 2033
- Table 68: Global Gas Chromatography Market Volume K Unit Forecast, by Product 2020 & 2033
- Table 69: Global Gas Chromatography Market Revenue billion Forecast, by End-User 2020 & 2033
- Table 70: Global Gas Chromatography Market Volume K Unit Forecast, by End-User 2020 & 2033
- Table 71: Global Gas Chromatography Market Revenue billion Forecast, by Country 2020 & 2033
- Table 72: Global Gas Chromatography Market Volume K Unit Forecast, by Country 2020 & 2033
- Table 73: Brazil Gas Chromatography Market Revenue (billion) Forecast, by Application 2020 & 2033
- Table 74: Brazil Gas Chromatography Market Volume (K Unit) Forecast, by Application 2020 & 2033
- Table 75: Argentina Gas Chromatography Market Revenue (billion) Forecast, by Application 2020 & 2033
- Table 76: Argentina Gas Chromatography Market Volume (K Unit) Forecast, by Application 2020 & 2033
- Table 77: Rest of South America Gas Chromatography Market Revenue (billion) Forecast, by Application 2020 & 2033
- Table 78: Rest of South America Gas Chromatography Market Volume (K Unit) Forecast, by Application 2020 & 2033
Frequently Asked Questions
1. What is the projected Compound Annual Growth Rate (CAGR) of the Gas Chromatography Market?
The projected CAGR is approximately 6.6%.
2. Which companies are prominent players in the Gas Chromatography Market?
Key companies in the market include Hobre Instruments BV, Restek Corporation, Process Sensing Technologies (LDetek Inc ), Chromatotec, Waters Corporation, Thermo Fisher Scientific Inc, Danaher Corporation, Agilent Technologies Inc, Sartorius, Merck KgaA, PerkinElmer Inc, Scion Instruments, Air Liquide, Teledyne Technologies, Shimadzu Corporation.
3. What are the main segments of the Gas Chromatography Market?
The market segments include Product, End-User.
4. Can you provide details about the market size?
The market size is estimated to be USD 4.43 billion as of 2022.
5. What are some drivers contributing to market growth?
Growing Importance of Chromatography Tests in the Drug Approval Process; Rising Adoption of Gas Chromatography-Mass Spectroscopy (GC-MS).
6. What are the notable trends driving market growth?
Pharmaceutical and Bioindustries is Expected to Hold a Significant Market Share Over the Forecast Period.
7. Are there any restraints impacting market growth?
High Cost of Gas Chromatography Equipment; Lack of Skilled Professionals.
8. Can you provide examples of recent developments in the market?
June 2022: PerkinElmer, Inc. launched the GC 2400 Platform, an advanced, automated gas chromatography (GC), headspace sampler, and GC-MS solution designed to help lab teams simplify lab operations, drive precise results, and perform more flexible monitoring.
9. What pricing options are available for accessing the report?
Pricing options include single-user, multi-user, and enterprise licenses priced at USD 4750, USD 5250, and USD 8750 respectively.
10. Is the market size provided in terms of value or volume?
The market size is provided in terms of value, measured in billion and volume, measured in K Unit.
11. Are there any specific market keywords associated with the report?
Yes, the market keyword associated with the report is "Gas Chromatography Market," which aids in identifying and referencing the specific market segment covered.
12. How do I determine which pricing option suits my needs best?
The pricing options vary based on user requirements and access needs. Individual users may opt for single-user licenses, while businesses requiring broader access may choose multi-user or enterprise licenses for cost-effective access to the report.
13. Are there any additional resources or data provided in the Gas Chromatography Market report?
While the report offers comprehensive insights, it's advisable to review the specific contents or supplementary materials provided to ascertain if additional resources or data are available.
14. How can I stay updated on further developments or reports in the Gas Chromatography Market?
To stay informed about further developments, trends, and reports in the Gas Chromatography Market, consider subscribing to industry newsletters, following relevant companies and organizations, or regularly checking reputable industry news sources and publications.
Methodology
Step 1 - Identification of Relevant Samples Size from Population Database


Step 2 - Approaches for Defining Global Market Size (Value, Volume* & Price*)

Note*: In applicable scenarios
Step 3 - Data Sources
Primary Research
- Web Analytics
- Survey Reports
- Research Institute
- Latest Research Reports
- Opinion Leaders
Secondary Research
- Annual Reports
- White Paper
- Latest Press Release
- Industry Association
- Paid Database
- Investor Presentations

Step 4 - Data Triangulation
Involves using different sources of information in order to increase the validity of a study
These sources are likely to be stakeholders in a program - participants, other researchers, program staff, other community members, and so on.
Then we put all data in single framework & apply various statistical tools to find out the dynamic on the market.
During the analysis stage, feedback from the stakeholder groups would be compared to determine areas of agreement as well as areas of divergence