

Key Insights
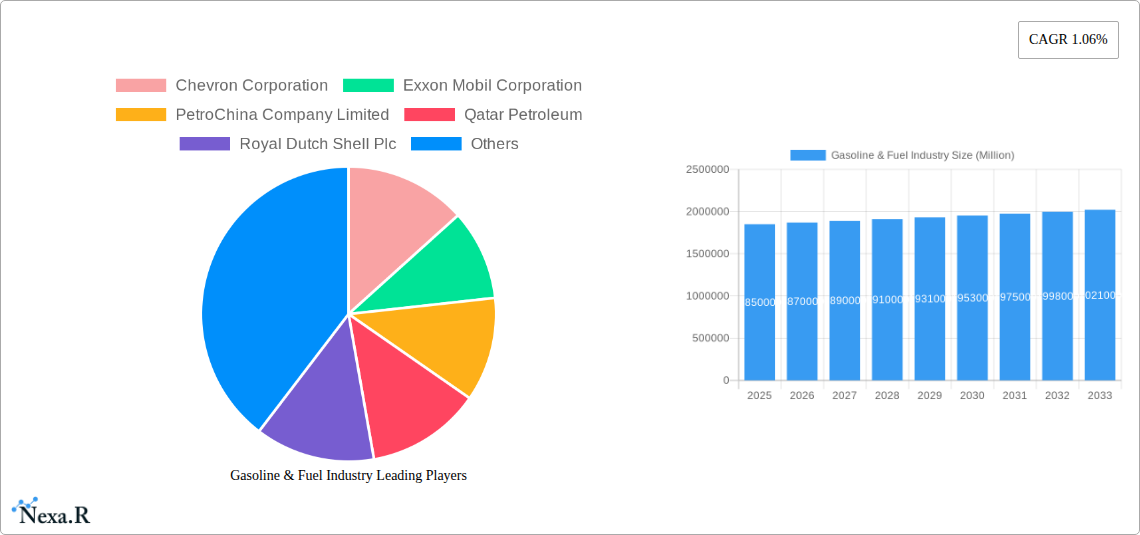
The global gasoline and fuel industry, valued at $1.85 trillion in 2025, is projected to experience steady growth, driven by increasing global energy demand, particularly in developing economies experiencing rapid industrialization and motorization. While a CAGR of 1.06% indicates moderate expansion, this figure likely underrepresents the dynamism within the sector. Specific growth segments, such as premium fuels and biofuels, will likely exhibit higher growth rates than the overall market, reflecting consumer preferences for higher-performance and environmentally conscious options. Conversely, constraints include fluctuating crude oil prices, government regulations aimed at reducing carbon emissions, and the ongoing transition toward electric vehicles. The competitive landscape is dominated by major integrated oil and gas companies like Chevron, ExxonMobil, and Shell, alongside significant players in emerging markets such as Reliance Industries and Saudi Aramco. These companies are actively investing in refining capacity, research and development of alternative fuels, and strategic partnerships to navigate the evolving market landscape. The industry faces a complex interplay of factors, necessitating strategic adaptation to maintain profitability and market share in the long term.
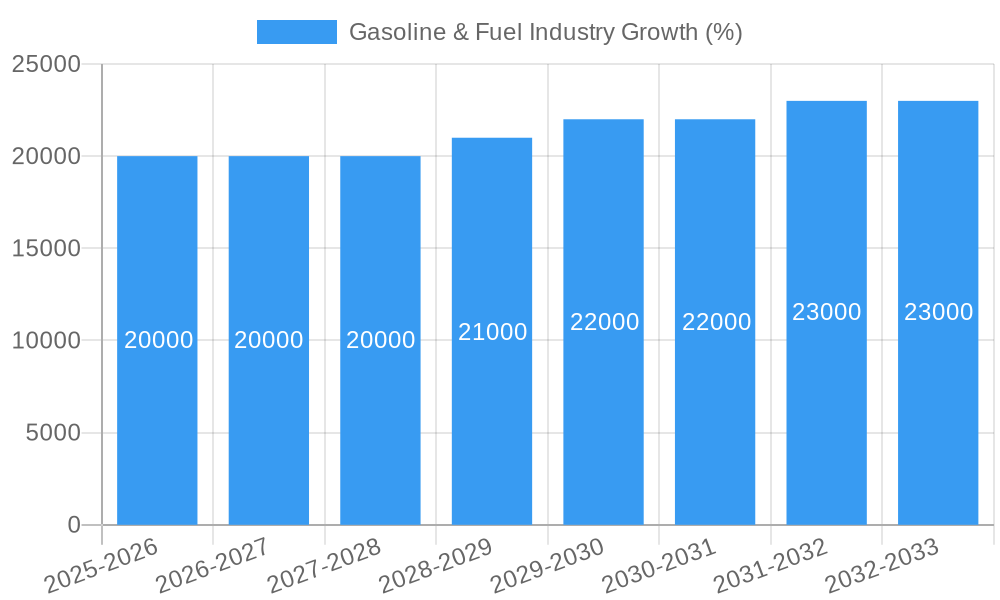
The forecast period of 2025-2033 will witness continued expansion, albeit at a potentially moderate pace. Several factors will shape this growth. Firstly, global economic growth, while subject to fluctuations, will remain a key driver. Secondly, government policies regarding fuel efficiency standards and the adoption of renewable energy sources will exert considerable influence. This includes mandates for the blending of biofuels and the continued development of electric vehicle infrastructure. Lastly, technological advancements in refining processes and fuel formulations will play a crucial role in determining efficiency and profitability. The market segmentation will likely shift, with growth in specialized fuel segments and a gradual decline in the demand for conventional gasoline, leading to strategic shifts within the industry toward diversification and sustainable practices.
Gasoline & Fuel Industry Market Report: 2019-2033
This comprehensive report provides an in-depth analysis of the global gasoline & fuel industry, encompassing market dynamics, growth trends, regional dominance, product landscapes, and key player strategies. The report covers the period 2019-2033, with a focus on the forecast period 2025-2033 and base year 2025. This analysis considers both the parent market (energy sector) and the child market (refined petroleum products). Market values are presented in million units.
Gasoline & Fuel Industry Market Dynamics & Structure
This section analyzes the market structure, focusing on concentration, innovation, regulation, competition, end-users, and M&A activity. The global gasoline and fuel market is characterized by high concentration, with a few multinational players holding significant market share. Technological innovations, such as the development of biofuels and synthetic fuels, are reshaping the industry, though adoption faces challenges like high initial investment costs and infrastructural limitations. Stringent environmental regulations are driving the shift towards cleaner fuels, while the rise of electric vehicles presents a significant competitive threat.
- Market Concentration: The top 10 players hold approximately xx% of the global market share in 2025.
- M&A Activity: A total of xx M&A deals were recorded between 2019 and 2024, valued at xx million units.
- Technological Innovation: Significant R&D investment in biofuels and synthetic fuels, although high initial costs present barriers to widespread adoption.
- Regulatory Framework: Stringent emission standards and carbon tax policies are influencing fuel production and consumption patterns.
- Competitive Substitutes: Electric vehicles and alternative fuels (e.g., hydrogen) pose increasing competition to traditional gasoline and diesel fuels.
- End-User Demographics: Demand is largely driven by transportation, but industrial applications and power generation also contribute significantly.
Gasoline & Fuel Industry Growth Trends & Insights
The global gasoline & fuel market exhibited a CAGR of xx% during 2019-2024, reaching xx million units in 2024. This growth is attributed to increasing vehicle ownership, particularly in emerging economies, and the continuous demand from industrial and power generation sectors. However, the market is experiencing a slowdown due to the adoption of electric vehicles and stricter environmental regulations. The forecast period (2025-2033) projects a CAGR of xx%, reaching xx million units by 2033. Technological disruptions, such as the development of advanced biofuels and synthetic fuels, are expected to influence market growth and diversification. Consumer behavior is shifting towards more sustainable fuel options, driving the growth of alternative fuel markets. Market penetration of alternative fuels remains low (xx%), but it is expected to increase significantly in the coming years.
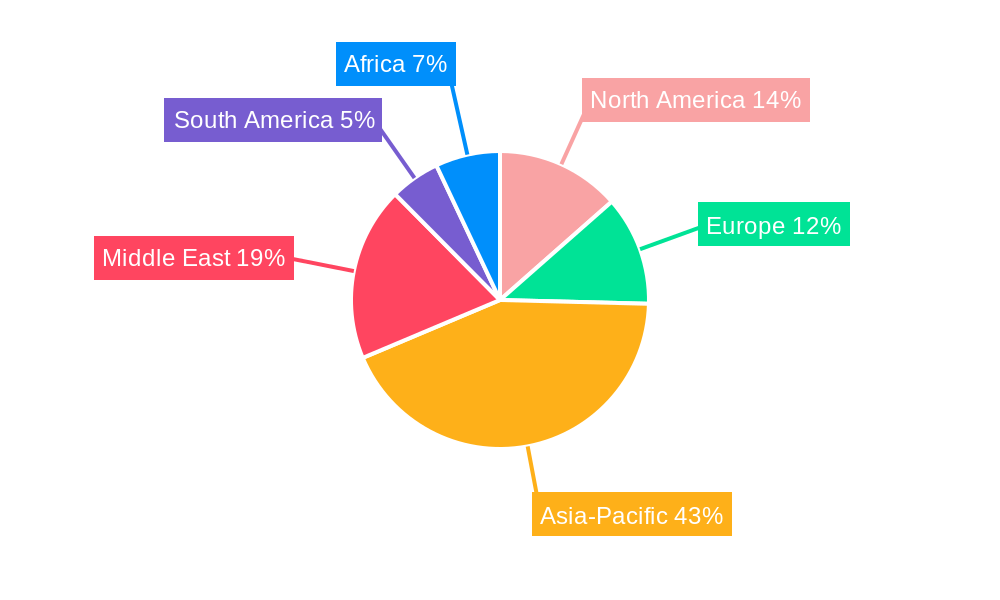
Dominant Regions, Countries, or Segments in Gasoline & Fuel Industry
The North American and Asia-Pacific regions are projected to be the dominant market segments throughout the forecast period.
- North America: Strong automotive sector, robust infrastructure, and significant investment in biofuel technologies are driving factors.
- Asia-Pacific: Rapid economic growth, rising vehicle ownership, and expanding industrial sectors are fueling demand.
- Europe: Stringent environmental regulations and government initiatives promoting renewable fuels are influencing market dynamics.
- Market Share: North America accounts for approximately xx% of global market share in 2025, while Asia-Pacific holds approximately xx%.
Gasoline & Fuel Industry Product Landscape
The gasoline and fuel product landscape is diversifying, with a focus on improving efficiency, reducing emissions, and enhancing performance. Innovations include the development of higher-octane fuels, blended fuels with biocomponents, and synthetic fuels produced from renewable sources. These products cater to specific applications, like improving engine performance in high-performance vehicles or reducing emissions in heavy-duty vehicles. Unique selling propositions center on enhanced fuel efficiency, lower emissions, and improved engine performance compared to conventional fuels.
Key Drivers, Barriers & Challenges in Gasoline & Fuel Industry
Key Drivers:
- Increasing global vehicle ownership.
- Growth of industrial and power generation sectors.
- Investment in infrastructure for fuel distribution.
Key Challenges:
- Fluctuating crude oil prices.
- Stringent environmental regulations and carbon emission targets.
- The rise of electric vehicles and alternative fuels poses a significant competitive threat. This has resulted in a xx% decline in gasoline consumption in some developed markets over the past few years.
- Supply chain disruptions and geopolitical instability impacting fuel availability and prices.
Emerging Opportunities in Gasoline & Fuel Industry
- Growing demand for sustainable and renewable fuels.
- Development of advanced biofuels and synthetic fuels.
- Expansion into untapped markets in developing economies.
Growth Accelerators in the Gasoline & Fuel Industry
Technological breakthroughs in biofuel production, coupled with strategic partnerships to develop sustainable fuel solutions, will accelerate long-term growth. The expansion into new markets and the development of tailored fuel solutions for specific applications will create significant opportunities.
Key Players Shaping the Gasoline & Fuel Industry Market
- Chevron Corporation
- Exxon Mobil Corporation
- PetroChina Company Limited
- Qatar Petroleum
- Royal Dutch Shell Plc
- Reliance Industries Ltd
- Saudi Arabian Oil Co
- SK energy Co Ltd
- NK Rosneft' PAO
- BP plc
- *List Not Exhaustive
Notable Milestones in Gasoline & Fuel Industry Sector
- October 2023: Aramco and ENOWA sign a joint development agreement to construct a synthetic electro-fuel demonstration plant, signifying a major step towards low-carbon fuel production.
- July 2022: The U.S. Department of Energy awards contracts for crude oil purchase from the Strategic Petroleum Reserve, a response to global supply disruptions.
In-Depth Gasoline & Fuel Industry Market Outlook
The future of the gasoline and fuel industry is shaped by the ongoing shift towards sustainable and renewable energy sources. Despite challenges posed by electric vehicles and alternative fuels, opportunities exist for companies that invest in innovative technologies, develop sustainable fuel solutions, and adapt to evolving consumer preferences. The market will likely witness consolidation and strategic alliances as companies seek to strengthen their position in a rapidly evolving landscape. The long-term potential remains significant, driven by the continued demand for transportation fuels, even with the rise of EVs, especially in developing economies.
Gasoline & Fuel Industry Segmentation
-
1. End-User
- 1.1. Transporation
- 1.2. Power Generation
- 1.3. Others
Gasoline & Fuel Industry Segmentation By Geography
-
1. North America
- 1.1. United States
- 1.2. Canada
- 1.3. Rest of North America
-
2. Europe
- 2.1. Germany
- 2.2. France
- 2.3. United Kingdom
- 2.4. Rest of Europe
-
3. Asia Pacific
- 3.1. China
- 3.2. India
- 3.3. Japan
- 3.4. South Korea
- 3.5. Rest of Asia Pacific
-
4. South America
- 4.1. Brazil
- 4.2. Argentina
- 4.3. Rest of South America
-
5. Middle East and Africa
- 5.1. Saudi Arabia
- 5.2. United Arab Emirates
- 5.3. South Africa
- 5.4. Rest of Middle East and Africa
Gasoline & Fuel Industry REPORT HIGHLIGHTS
| Aspects | Details |
|---|---|
| Study Period | 2019-2033 |
| Base Year | 2024 |
| Estimated Year | 2025 |
| Forecast Period | 2025-2033 |
| Historical Period | 2019-2024 |
| Growth Rate | CAGR of 1.06% from 2019-2033 |
| Segmentation |
|
Table of Contents
- 1. Introduction
- 1.1. Research Scope
- 1.2. Market Segmentation
- 1.3. Research Methodology
- 1.4. Definitions and Assumptions
- 2. Executive Summary
- 2.1. Introduction
- 3. Market Dynamics
- 3.1. Introduction
- 3.2. Market Drivers
- 3.2.1 4.; Rising Adoption of Automobiles such as Passenger Cars
- 3.2.2 Motorcycles Across the World4.; Easy Availability of Gasoline
- 3.3. Market Restrains
- 3.3.1 4.; Rising Adoption of Automobiles such as Passenger Cars
- 3.3.2 Motorcycles Across the World4.; Easy Availability of Gasoline
- 3.4. Market Trends
- 3.4.1. Transportation Segment is Expected to Dominate in the Market
- 4. Market Factor Analysis
- 4.1. Porters Five Forces
- 4.2. Supply/Value Chain
- 4.3. PESTEL analysis
- 4.4. Market Entropy
- 4.5. Patent/Trademark Analysis
- 5. Global Gasoline & Fuel Industry Analysis, Insights and Forecast, 2019-2031
- 5.1. Market Analysis, Insights and Forecast - by End-User
- 5.1.1. Transporation
- 5.1.2. Power Generation
- 5.1.3. Others
- 5.2. Market Analysis, Insights and Forecast - by Region
- 5.2.1. North America
- 5.2.2. Europe
- 5.2.3. Asia Pacific
- 5.2.4. South America
- 5.2.5. Middle East and Africa
- 5.1. Market Analysis, Insights and Forecast - by End-User
- 6. North America Gasoline & Fuel Industry Analysis, Insights and Forecast, 2019-2031
- 6.1. Market Analysis, Insights and Forecast - by End-User
- 6.1.1. Transporation
- 6.1.2. Power Generation
- 6.1.3. Others
- 6.1. Market Analysis, Insights and Forecast - by End-User
- 7. Europe Gasoline & Fuel Industry Analysis, Insights and Forecast, 2019-2031
- 7.1. Market Analysis, Insights and Forecast - by End-User
- 7.1.1. Transporation
- 7.1.2. Power Generation
- 7.1.3. Others
- 7.1. Market Analysis, Insights and Forecast - by End-User
- 8. Asia Pacific Gasoline & Fuel Industry Analysis, Insights and Forecast, 2019-2031
- 8.1. Market Analysis, Insights and Forecast - by End-User
- 8.1.1. Transporation
- 8.1.2. Power Generation
- 8.1.3. Others
- 8.1. Market Analysis, Insights and Forecast - by End-User
- 9. South America Gasoline & Fuel Industry Analysis, Insights and Forecast, 2019-2031
- 9.1. Market Analysis, Insights and Forecast - by End-User
- 9.1.1. Transporation
- 9.1.2. Power Generation
- 9.1.3. Others
- 9.1. Market Analysis, Insights and Forecast - by End-User
- 10. Middle East and Africa Gasoline & Fuel Industry Analysis, Insights and Forecast, 2019-2031
- 10.1. Market Analysis, Insights and Forecast - by End-User
- 10.1.1. Transporation
- 10.1.2. Power Generation
- 10.1.3. Others
- 10.1. Market Analysis, Insights and Forecast - by End-User
- 11. Competitive Analysis
- 11.1. Global Market Share Analysis 2024
- 11.2. Company Profiles
- 11.2.1 Chevron Corporation
- 11.2.1.1. Overview
- 11.2.1.2. Products
- 11.2.1.3. SWOT Analysis
- 11.2.1.4. Recent Developments
- 11.2.1.5. Financials (Based on Availability)
- 11.2.2 Exxon Mobil Corporation
- 11.2.2.1. Overview
- 11.2.2.2. Products
- 11.2.2.3. SWOT Analysis
- 11.2.2.4. Recent Developments
- 11.2.2.5. Financials (Based on Availability)
- 11.2.3 PetroChina Company Limited
- 11.2.3.1. Overview
- 11.2.3.2. Products
- 11.2.3.3. SWOT Analysis
- 11.2.3.4. Recent Developments
- 11.2.3.5. Financials (Based on Availability)
- 11.2.4 Qatar Petroleum
- 11.2.4.1. Overview
- 11.2.4.2. Products
- 11.2.4.3. SWOT Analysis
- 11.2.4.4. Recent Developments
- 11.2.4.5. Financials (Based on Availability)
- 11.2.5 Royal Dutch Shell Plc
- 11.2.5.1. Overview
- 11.2.5.2. Products
- 11.2.5.3. SWOT Analysis
- 11.2.5.4. Recent Developments
- 11.2.5.5. Financials (Based on Availability)
- 11.2.6 Reliance Industries Ltd
- 11.2.6.1. Overview
- 11.2.6.2. Products
- 11.2.6.3. SWOT Analysis
- 11.2.6.4. Recent Developments
- 11.2.6.5. Financials (Based on Availability)
- 11.2.7 Saudi Arabian Oil Co
- 11.2.7.1. Overview
- 11.2.7.2. Products
- 11.2.7.3. SWOT Analysis
- 11.2.7.4. Recent Developments
- 11.2.7.5. Financials (Based on Availability)
- 11.2.8 SK energy Co Ltd
- 11.2.8.1. Overview
- 11.2.8.2. Products
- 11.2.8.3. SWOT Analysis
- 11.2.8.4. Recent Developments
- 11.2.8.5. Financials (Based on Availability)
- 11.2.9 NK Rosneft' PAO
- 11.2.9.1. Overview
- 11.2.9.2. Products
- 11.2.9.3. SWOT Analysis
- 11.2.9.4. Recent Developments
- 11.2.9.5. Financials (Based on Availability)
- 11.2.10 BP plc*List Not Exhaustive
- 11.2.10.1. Overview
- 11.2.10.2. Products
- 11.2.10.3. SWOT Analysis
- 11.2.10.4. Recent Developments
- 11.2.10.5. Financials (Based on Availability)
- 11.2.1 Chevron Corporation
List of Figures
- Figure 1: Global Gasoline & Fuel Industry Revenue Breakdown (Million, %) by Region 2024 & 2032
- Figure 2: Global Gasoline & Fuel Industry Volume Breakdown (Trillion, %) by Region 2024 & 2032
- Figure 3: North America Gasoline & Fuel Industry Revenue (Million), by End-User 2024 & 2032
- Figure 4: North America Gasoline & Fuel Industry Volume (Trillion), by End-User 2024 & 2032
- Figure 5: North America Gasoline & Fuel Industry Revenue Share (%), by End-User 2024 & 2032
- Figure 6: North America Gasoline & Fuel Industry Volume Share (%), by End-User 2024 & 2032
- Figure 7: North America Gasoline & Fuel Industry Revenue (Million), by Country 2024 & 2032
- Figure 8: North America Gasoline & Fuel Industry Volume (Trillion), by Country 2024 & 2032
- Figure 9: North America Gasoline & Fuel Industry Revenue Share (%), by Country 2024 & 2032
- Figure 10: North America Gasoline & Fuel Industry Volume Share (%), by Country 2024 & 2032
- Figure 11: Europe Gasoline & Fuel Industry Revenue (Million), by End-User 2024 & 2032
- Figure 12: Europe Gasoline & Fuel Industry Volume (Trillion), by End-User 2024 & 2032
- Figure 13: Europe Gasoline & Fuel Industry Revenue Share (%), by End-User 2024 & 2032
- Figure 14: Europe Gasoline & Fuel Industry Volume Share (%), by End-User 2024 & 2032
- Figure 15: Europe Gasoline & Fuel Industry Revenue (Million), by Country 2024 & 2032
- Figure 16: Europe Gasoline & Fuel Industry Volume (Trillion), by Country 2024 & 2032
- Figure 17: Europe Gasoline & Fuel Industry Revenue Share (%), by Country 2024 & 2032
- Figure 18: Europe Gasoline & Fuel Industry Volume Share (%), by Country 2024 & 2032
- Figure 19: Asia Pacific Gasoline & Fuel Industry Revenue (Million), by End-User 2024 & 2032
- Figure 20: Asia Pacific Gasoline & Fuel Industry Volume (Trillion), by End-User 2024 & 2032
- Figure 21: Asia Pacific Gasoline & Fuel Industry Revenue Share (%), by End-User 2024 & 2032
- Figure 22: Asia Pacific Gasoline & Fuel Industry Volume Share (%), by End-User 2024 & 2032
- Figure 23: Asia Pacific Gasoline & Fuel Industry Revenue (Million), by Country 2024 & 2032
- Figure 24: Asia Pacific Gasoline & Fuel Industry Volume (Trillion), by Country 2024 & 2032
- Figure 25: Asia Pacific Gasoline & Fuel Industry Revenue Share (%), by Country 2024 & 2032
- Figure 26: Asia Pacific Gasoline & Fuel Industry Volume Share (%), by Country 2024 & 2032
- Figure 27: South America Gasoline & Fuel Industry Revenue (Million), by End-User 2024 & 2032
- Figure 28: South America Gasoline & Fuel Industry Volume (Trillion), by End-User 2024 & 2032
- Figure 29: South America Gasoline & Fuel Industry Revenue Share (%), by End-User 2024 & 2032
- Figure 30: South America Gasoline & Fuel Industry Volume Share (%), by End-User 2024 & 2032
- Figure 31: South America Gasoline & Fuel Industry Revenue (Million), by Country 2024 & 2032
- Figure 32: South America Gasoline & Fuel Industry Volume (Trillion), by Country 2024 & 2032
- Figure 33: South America Gasoline & Fuel Industry Revenue Share (%), by Country 2024 & 2032
- Figure 34: South America Gasoline & Fuel Industry Volume Share (%), by Country 2024 & 2032
- Figure 35: Middle East and Africa Gasoline & Fuel Industry Revenue (Million), by End-User 2024 & 2032
- Figure 36: Middle East and Africa Gasoline & Fuel Industry Volume (Trillion), by End-User 2024 & 2032
- Figure 37: Middle East and Africa Gasoline & Fuel Industry Revenue Share (%), by End-User 2024 & 2032
- Figure 38: Middle East and Africa Gasoline & Fuel Industry Volume Share (%), by End-User 2024 & 2032
- Figure 39: Middle East and Africa Gasoline & Fuel Industry Revenue (Million), by Country 2024 & 2032
- Figure 40: Middle East and Africa Gasoline & Fuel Industry Volume (Trillion), by Country 2024 & 2032
- Figure 41: Middle East and Africa Gasoline & Fuel Industry Revenue Share (%), by Country 2024 & 2032
- Figure 42: Middle East and Africa Gasoline & Fuel Industry Volume Share (%), by Country 2024 & 2032
List of Tables
- Table 1: Global Gasoline & Fuel Industry Revenue Million Forecast, by Region 2019 & 2032
- Table 2: Global Gasoline & Fuel Industry Volume Trillion Forecast, by Region 2019 & 2032
- Table 3: Global Gasoline & Fuel Industry Revenue Million Forecast, by End-User 2019 & 2032
- Table 4: Global Gasoline & Fuel Industry Volume Trillion Forecast, by End-User 2019 & 2032
- Table 5: Global Gasoline & Fuel Industry Revenue Million Forecast, by Region 2019 & 2032
- Table 6: Global Gasoline & Fuel Industry Volume Trillion Forecast, by Region 2019 & 2032
- Table 7: Global Gasoline & Fuel Industry Revenue Million Forecast, by End-User 2019 & 2032
- Table 8: Global Gasoline & Fuel Industry Volume Trillion Forecast, by End-User 2019 & 2032
- Table 9: Global Gasoline & Fuel Industry Revenue Million Forecast, by Country 2019 & 2032
- Table 10: Global Gasoline & Fuel Industry Volume Trillion Forecast, by Country 2019 & 2032
- Table 11: United States Gasoline & Fuel Industry Revenue (Million) Forecast, by Application 2019 & 2032
- Table 12: United States Gasoline & Fuel Industry Volume (Trillion) Forecast, by Application 2019 & 2032
- Table 13: Canada Gasoline & Fuel Industry Revenue (Million) Forecast, by Application 2019 & 2032
- Table 14: Canada Gasoline & Fuel Industry Volume (Trillion) Forecast, by Application 2019 & 2032
- Table 15: Rest of North America Gasoline & Fuel Industry Revenue (Million) Forecast, by Application 2019 & 2032
- Table 16: Rest of North America Gasoline & Fuel Industry Volume (Trillion) Forecast, by Application 2019 & 2032
- Table 17: Global Gasoline & Fuel Industry Revenue Million Forecast, by End-User 2019 & 2032
- Table 18: Global Gasoline & Fuel Industry Volume Trillion Forecast, by End-User 2019 & 2032
- Table 19: Global Gasoline & Fuel Industry Revenue Million Forecast, by Country 2019 & 2032
- Table 20: Global Gasoline & Fuel Industry Volume Trillion Forecast, by Country 2019 & 2032
- Table 21: Germany Gasoline & Fuel Industry Revenue (Million) Forecast, by Application 2019 & 2032
- Table 22: Germany Gasoline & Fuel Industry Volume (Trillion) Forecast, by Application 2019 & 2032
- Table 23: France Gasoline & Fuel Industry Revenue (Million) Forecast, by Application 2019 & 2032
- Table 24: France Gasoline & Fuel Industry Volume (Trillion) Forecast, by Application 2019 & 2032
- Table 25: United Kingdom Gasoline & Fuel Industry Revenue (Million) Forecast, by Application 2019 & 2032
- Table 26: United Kingdom Gasoline & Fuel Industry Volume (Trillion) Forecast, by Application 2019 & 2032
- Table 27: Rest of Europe Gasoline & Fuel Industry Revenue (Million) Forecast, by Application 2019 & 2032
- Table 28: Rest of Europe Gasoline & Fuel Industry Volume (Trillion) Forecast, by Application 2019 & 2032
- Table 29: Global Gasoline & Fuel Industry Revenue Million Forecast, by End-User 2019 & 2032
- Table 30: Global Gasoline & Fuel Industry Volume Trillion Forecast, by End-User 2019 & 2032
- Table 31: Global Gasoline & Fuel Industry Revenue Million Forecast, by Country 2019 & 2032
- Table 32: Global Gasoline & Fuel Industry Volume Trillion Forecast, by Country 2019 & 2032
- Table 33: China Gasoline & Fuel Industry Revenue (Million) Forecast, by Application 2019 & 2032
- Table 34: China Gasoline & Fuel Industry Volume (Trillion) Forecast, by Application 2019 & 2032
- Table 35: India Gasoline & Fuel Industry Revenue (Million) Forecast, by Application 2019 & 2032
- Table 36: India Gasoline & Fuel Industry Volume (Trillion) Forecast, by Application 2019 & 2032
- Table 37: Japan Gasoline & Fuel Industry Revenue (Million) Forecast, by Application 2019 & 2032
- Table 38: Japan Gasoline & Fuel Industry Volume (Trillion) Forecast, by Application 2019 & 2032
- Table 39: South Korea Gasoline & Fuel Industry Revenue (Million) Forecast, by Application 2019 & 2032
- Table 40: South Korea Gasoline & Fuel Industry Volume (Trillion) Forecast, by Application 2019 & 2032
- Table 41: Rest of Asia Pacific Gasoline & Fuel Industry Revenue (Million) Forecast, by Application 2019 & 2032
- Table 42: Rest of Asia Pacific Gasoline & Fuel Industry Volume (Trillion) Forecast, by Application 2019 & 2032
- Table 43: Global Gasoline & Fuel Industry Revenue Million Forecast, by End-User 2019 & 2032
- Table 44: Global Gasoline & Fuel Industry Volume Trillion Forecast, by End-User 2019 & 2032
- Table 45: Global Gasoline & Fuel Industry Revenue Million Forecast, by Country 2019 & 2032
- Table 46: Global Gasoline & Fuel Industry Volume Trillion Forecast, by Country 2019 & 2032
- Table 47: Brazil Gasoline & Fuel Industry Revenue (Million) Forecast, by Application 2019 & 2032
- Table 48: Brazil Gasoline & Fuel Industry Volume (Trillion) Forecast, by Application 2019 & 2032
- Table 49: Argentina Gasoline & Fuel Industry Revenue (Million) Forecast, by Application 2019 & 2032
- Table 50: Argentina Gasoline & Fuel Industry Volume (Trillion) Forecast, by Application 2019 & 2032
- Table 51: Rest of South America Gasoline & Fuel Industry Revenue (Million) Forecast, by Application 2019 & 2032
- Table 52: Rest of South America Gasoline & Fuel Industry Volume (Trillion) Forecast, by Application 2019 & 2032
- Table 53: Global Gasoline & Fuel Industry Revenue Million Forecast, by End-User 2019 & 2032
- Table 54: Global Gasoline & Fuel Industry Volume Trillion Forecast, by End-User 2019 & 2032
- Table 55: Global Gasoline & Fuel Industry Revenue Million Forecast, by Country 2019 & 2032
- Table 56: Global Gasoline & Fuel Industry Volume Trillion Forecast, by Country 2019 & 2032
- Table 57: Saudi Arabia Gasoline & Fuel Industry Revenue (Million) Forecast, by Application 2019 & 2032
- Table 58: Saudi Arabia Gasoline & Fuel Industry Volume (Trillion) Forecast, by Application 2019 & 2032
- Table 59: United Arab Emirates Gasoline & Fuel Industry Revenue (Million) Forecast, by Application 2019 & 2032
- Table 60: United Arab Emirates Gasoline & Fuel Industry Volume (Trillion) Forecast, by Application 2019 & 2032
- Table 61: South Africa Gasoline & Fuel Industry Revenue (Million) Forecast, by Application 2019 & 2032
- Table 62: South Africa Gasoline & Fuel Industry Volume (Trillion) Forecast, by Application 2019 & 2032
- Table 63: Rest of Middle East and Africa Gasoline & Fuel Industry Revenue (Million) Forecast, by Application 2019 & 2032
- Table 64: Rest of Middle East and Africa Gasoline & Fuel Industry Volume (Trillion) Forecast, by Application 2019 & 2032
Frequently Asked Questions
1. What is the projected Compound Annual Growth Rate (CAGR) of the Gasoline & Fuel Industry?
The projected CAGR is approximately 1.06%.
2. Which companies are prominent players in the Gasoline & Fuel Industry?
Key companies in the market include Chevron Corporation, Exxon Mobil Corporation, PetroChina Company Limited, Qatar Petroleum, Royal Dutch Shell Plc, Reliance Industries Ltd, Saudi Arabian Oil Co, SK energy Co Ltd, NK Rosneft' PAO, BP plc*List Not Exhaustive.
3. What are the main segments of the Gasoline & Fuel Industry?
The market segments include End-User.
4. Can you provide details about the market size?
The market size is estimated to be USD 1.85 Million as of 2022.
5. What are some drivers contributing to market growth?
4.; Rising Adoption of Automobiles such as Passenger Cars. Motorcycles Across the World4.; Easy Availability of Gasoline.
6. What are the notable trends driving market growth?
Transportation Segment is Expected to Dominate in the Market.
7. Are there any restraints impacting market growth?
4.; Rising Adoption of Automobiles such as Passenger Cars. Motorcycles Across the World4.; Easy Availability of Gasoline.
8. Can you provide examples of recent developments in the market?
In October 2023, Aramco and ENOWA, NEOM’s energy and water company, have signed a joint development agreement to construct and establish a first-of-its-kind synthetic electro-fuel (e-fuel) demonstration plant aimed to display technological feasibility and commercial viability by developing thirty five barrels per day of low-carbon, synthetic gasoline from renewable-based hydrogen and captured carbon dioxide (CO2).
9. What pricing options are available for accessing the report?
Pricing options include single-user, multi-user, and enterprise licenses priced at USD 4750, USD 5250, and USD 8750 respectively.
10. Is the market size provided in terms of value or volume?
The market size is provided in terms of value, measured in Million and volume, measured in Trillion.
11. Are there any specific market keywords associated with the report?
Yes, the market keyword associated with the report is "Gasoline & Fuel Industry," which aids in identifying and referencing the specific market segment covered.
12. How do I determine which pricing option suits my needs best?
The pricing options vary based on user requirements and access needs. Individual users may opt for single-user licenses, while businesses requiring broader access may choose multi-user or enterprise licenses for cost-effective access to the report.
13. Are there any additional resources or data provided in the Gasoline & Fuel Industry report?
While the report offers comprehensive insights, it's advisable to review the specific contents or supplementary materials provided to ascertain if additional resources or data are available.
14. How can I stay updated on further developments or reports in the Gasoline & Fuel Industry?
To stay informed about further developments, trends, and reports in the Gasoline & Fuel Industry, consider subscribing to industry newsletters, following relevant companies and organizations, or regularly checking reputable industry news sources and publications.
Methodology
Step 1 - Identification of Relevant Samples Size from Population Database


Step 2 - Approaches for Defining Global Market Size (Value, Volume* & Price*)

Note*: In applicable scenarios
Step 3 - Data Sources
Primary Research
- Web Analytics
- Survey Reports
- Research Institute
- Latest Research Reports
- Opinion Leaders
Secondary Research
- Annual Reports
- White Paper
- Latest Press Release
- Industry Association
- Paid Database
- Investor Presentations

Step 4 - Data Triangulation
Involves using different sources of information in order to increase the validity of a study
These sources are likely to be stakeholders in a program - participants, other researchers, program staff, other community members, and so on.
Then we put all data in single framework & apply various statistical tools to find out the dynamic on the market.
During the analysis stage, feedback from the stakeholder groups would be compared to determine areas of agreement as well as areas of divergence
