

Key Insights
The global glass dental materials market is poised for substantial growth, propelled by increasing dental disease prevalence, heightened oral hygiene awareness, and the rising demand for aesthetic dentistry. Key drivers include the superior biocompatibility, strength, and esthetic appeal of glass ceramics over conventional materials. Innovations in glass-ceramic compositions offering enhanced translucency and fracture toughness further stimulate market expansion. The market is segmented by product type, including glass ionomer cements and glass ceramics; by application, such as restorations and prosthetics; and by end-user, encompassing dental clinics and laboratories. Leading companies like Schott, 3M, and Corning are actively investing in R&D to refine product offerings and expand market influence. The competitive environment features both major multinational corporations and niche manufacturers, contributing to a varied product landscape. While North America and Europe represent mature markets, the Asia-Pacific region presents significant growth opportunities due to increasing disposable incomes and developing healthcare infrastructure.
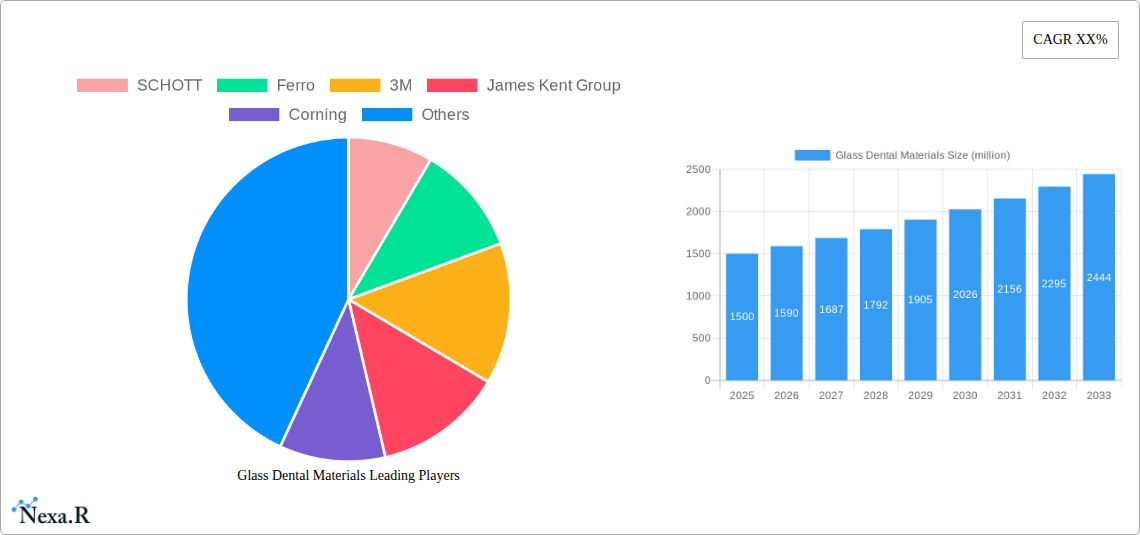
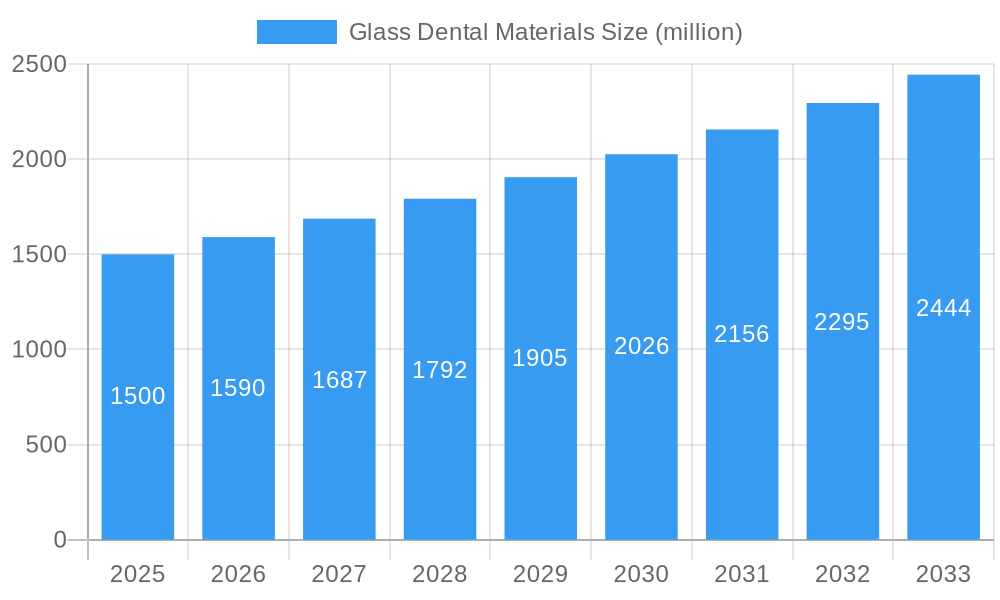
Glass Dental Materials Market Size (In Billion)
The forecast period (2025-2033) projects sustained market expansion, underpinned by the aforementioned growth factors. Potential restraints include stringent regulatory approvals and the high cost of advanced glass ceramic technologies. Despite these challenges, the outlook for the glass dental materials market remains positive, driven by continuous technological advancements and escalating demand for durable, esthetic, and biocompatible dental solutions. The market is anticipated to experience a consistent rise in the adoption of advanced materials, leading to a trend towards premium product offerings. Strategic alliances and collaborations between manufacturers and dental professionals are expected to be crucial to the market's development. The current market size is estimated at 13.84 billion, with a projected compound annual growth rate (CAGR) of 8.13% from the base year 2025.
Glass Dental Materials Company Market Share
Glass Dental Materials Market Report: 2019-2033
A comprehensive analysis of market dynamics, growth trends, key players, and future opportunities within the dental materials sector. This report provides in-depth insights into the Glass Dental Materials market, examining its evolution from 2019 to 2033, with a focus on the pivotal year 2025. The report covers various segments within the broader dental market, focusing on the parent market of dental materials and the child market of glass-based dental products. This data-driven analysis is essential for manufacturers, investors, and industry professionals seeking to understand and capitalize on this dynamic market.
Study Period: 2019–2033 | Base Year: 2025 | Estimated Year: 2025 | Forecast Period: 2025–2033 | Historical Period: 2019–2024
Glass Dental Materials Market Dynamics & Structure
The global glass dental materials market, valued at xx million units in 2024, is characterized by a moderately consolidated structure. Major players like 3M, Dentsply Sirona, and Schott hold significant market share, while smaller companies, particularly in regions like China (Shanghai Rongxiang Dental Material Co., Ltd, Shanghai New Century Dental Materials Co., Ltd), focus on niche applications or regional markets. Technological innovation, driven by the demand for improved aesthetics, biocompatibility, and longevity of dental restorations, is a primary growth driver. Stringent regulatory frameworks, particularly regarding biocompatibility and safety, influence market dynamics. The market faces competition from alternative materials, such as ceramics and composites, though glass-based materials retain a significant presence due to their established properties and cost-effectiveness in certain applications. Mergers and acquisitions (M&A) activity has been moderate, with larger players consolidating their positions and expanding their product portfolios. We estimate xx M&A deals in the period of 2019-2024.
- Market Concentration: Moderately consolidated, with top 5 players holding approximately xx% market share in 2024.
- Technological Innovation: Focus on improved strength, aesthetics, and biocompatibility.
- Regulatory Landscape: Stringent regulations regarding biocompatibility and safety standards.
- Competitive Substitutes: Ceramics, composites, and other advanced dental materials.
- End-User Demographics: Primarily dental professionals (dentists, dental technicians).
- M&A Activity: Moderate activity, with larger companies strategically acquiring smaller players.
Glass Dental Materials Growth Trends & Insights
The glass dental materials market exhibited a CAGR of xx% during the historical period (2019-2024), reaching an estimated value of xx million units in 2025. This growth is attributed to factors such as rising dental tourism, an aging global population with increased dental needs, and advancements in glass-ceramic technology that lead to enhanced material properties and aesthetic outcomes. Adoption rates are highest in developed regions with advanced dental infrastructure. However, increasing awareness of dental health, coupled with rising disposable incomes in developing economies, is driving market penetration in emerging markets. Technological disruptions, including the introduction of CAD/CAM technology and 3D printing for dental restorations, are transforming manufacturing processes and expanding the range of applications for glass-based materials. Consumer behavior shifts toward minimally invasive procedures and improved aesthetics further fuel market demand. We project a CAGR of xx% from 2025 to 2033, reaching a market value of xx million units by 2033.
Dominant Regions, Countries, or Segments in Glass Dental Materials
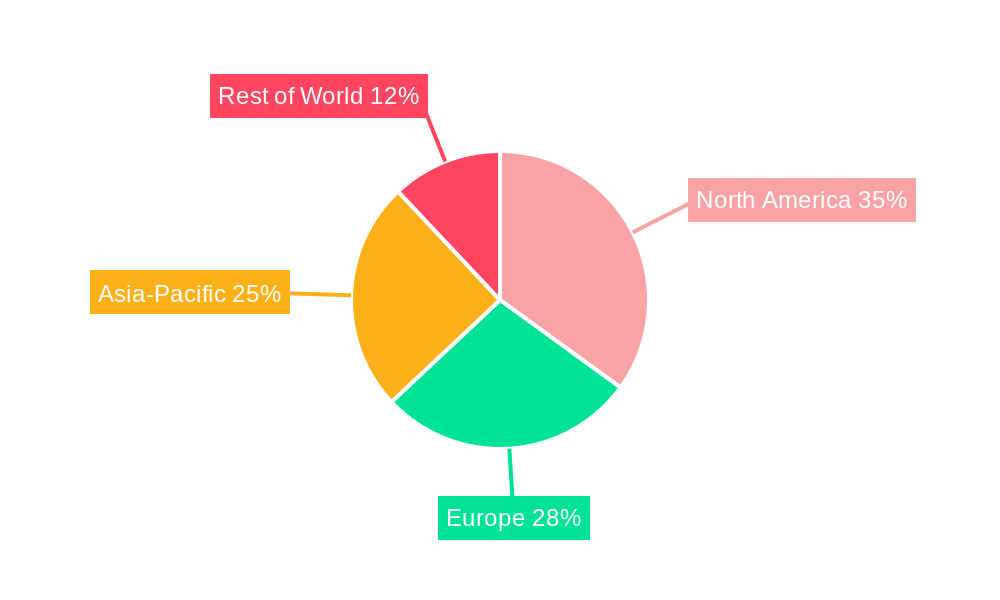
North America and Europe currently dominate the glass dental materials market, driven by established dental infrastructure, high healthcare expenditure, and a strong preference for advanced dental treatments. The high prevalence of dental diseases in these regions also contributes to significant demand. However, Asia-Pacific, particularly China and India, shows significant growth potential due to rapid economic development, rising disposable incomes, and increasing awareness of dental health.
- Key Drivers in North America: High healthcare expenditure, advanced dental infrastructure, strong regulatory frameworks.
- Key Drivers in Europe: Established dental infrastructure, high prevalence of dental diseases, strong research and development activity.
- Key Drivers in Asia-Pacific: Rising disposable incomes, increasing awareness of dental health, supportive government policies.
- Market Share: North America holds approximately xx% of the global market share in 2024, followed by Europe with xx%.
Glass Dental Materials Product Landscape
Glass dental materials encompass a wide range of products, including dental glass ionomers, glass ceramics, and other specialized glass-based composites. These materials are employed in diverse applications such as fillings, inlays, onlays, crowns, and bridges. Recent innovations focus on enhancing material strength, translucency, and biocompatibility. The incorporation of nanoparticles and surface modification techniques contributes to improved aesthetics and longevity of restorations. Key selling propositions include biocompatibility, cost-effectiveness, and ease of use.
Key Drivers, Barriers & Challenges in Glass Dental Materials
Key Drivers:
- Technological advancements in glass-ceramic formulations leading to improved strength and aesthetics.
- Rising prevalence of dental diseases globally.
- Growing demand for minimally invasive dental procedures.
Key Challenges & Restraints:
- Competition from alternative materials such as zirconia and composites.
- Price sensitivity in emerging markets.
- Potential supply chain disruptions affecting raw material availability. This is estimated to impact the market by xx% in 2027.
Emerging Opportunities in Glass Dental Materials
- Development of novel glass-based composites with enhanced properties.
- Expansion into emerging markets with increasing dental awareness.
- Exploring new applications, such as 3D-printed dental restorations using glass-based materials.
Growth Accelerators in the Glass Dental Materials Industry
Strategic partnerships between material manufacturers and dental equipment companies are expected to accelerate market growth. The integration of advanced manufacturing techniques, such as 3D printing and CAD/CAM technology, presents significant opportunities for innovation and market expansion. Continued research and development efforts focusing on improved biocompatibility and aesthetic properties will further drive market growth.
Key Players Shaping the Glass Dental Materials Market
- SCHOTT
- Ferro
- 3M
- James Kent Group
- Corning
- GC Corporation
- Ivoclar Vivadent AG
- Shofu
- DENTSPLY SIRONA
- Kerr
- DENTAURUM
- Prime Dental
- Promedica
- I-dental
- Shanghai Rongxiang Dental Material Co., Ltd
- Shanghai New Century Dental Materials Co., Ltd
Notable Milestones in Glass Dental Materials Sector
- 2020: Introduction of a new high-strength glass-ceramic by 3M.
- 2022: Acquisition of a smaller glass dental materials company by Dentsply Sirona.
- 2023: Launch of a biocompatible glass-ionomer cement with improved handling characteristics by GC Corporation.
- 2024: Approval of a novel glass-ceramic material for use in dental restorations by the FDA (hypothetical example).
In-Depth Glass Dental Materials Market Outlook
The future of the glass dental materials market looks promising, driven by ongoing technological advancements, increasing demand in emerging markets, and a growing focus on improved aesthetic outcomes. Strategic partnerships and innovations in manufacturing techniques will further propel market growth. The market is poised for substantial expansion in the coming years, with significant opportunities for players who can leverage technological advancements and cater to the evolving needs of dental professionals and patients. We anticipate that the market will reach xx million units by 2033.
Glass Dental Materials Segmentation
-
1. Application
- 1.1. Hospital
- 1.2. Dental Clinic
- 1.3. Others
-
2. Types
- 2.1. Leucite Based
- 2.2. Lithium Disilicate Based
- 2.3. Others
Glass Dental Materials Segmentation By Geography
-
1. North America
- 1.1. United States
- 1.2. Canada
- 1.3. Mexico
-
2. South America
- 2.1. Brazil
- 2.2. Argentina
- 2.3. Rest of South America
-
3. Europe
- 3.1. United Kingdom
- 3.2. Germany
- 3.3. France
- 3.4. Italy
- 3.5. Spain
- 3.6. Russia
- 3.7. Benelux
- 3.8. Nordics
- 3.9. Rest of Europe
-
4. Middle East & Africa
- 4.1. Turkey
- 4.2. Israel
- 4.3. GCC
- 4.4. North Africa
- 4.5. South Africa
- 4.6. Rest of Middle East & Africa
-
5. Asia Pacific
- 5.1. China
- 5.2. India
- 5.3. Japan
- 5.4. South Korea
- 5.5. ASEAN
- 5.6. Oceania
- 5.7. Rest of Asia Pacific
Glass Dental Materials Regional Market Share
Geographic Coverage of Glass Dental Materials
Glass Dental Materials REPORT HIGHLIGHTS
| Aspects | Details |
|---|---|
| Study Period | 2020-2034 |
| Base Year | 2025 |
| Estimated Year | 2026 |
| Forecast Period | 2026-2034 |
| Historical Period | 2020-2025 |
| Growth Rate | CAGR of 8.13% from 2020-2034 |
| Segmentation |
|
Table of Contents
- 1. Introduction
- 1.1. Research Scope
- 1.2. Market Segmentation
- 1.3. Research Objective
- 1.4. Definitions and Assumptions
- 2. Executive Summary
- 2.1. Market Snapshot
- 3. Market Dynamics
- 3.1. Market Drivers
- 3.2. Market Restrains
- 3.3. Market Trends
- 3.4. Market Opportunities
- 4. Market Factor Analysis
- 4.1. Porters Five Forces
- 4.1.1. Bargaining Power of Suppliers
- 4.1.2. Bargaining Power of Buyers
- 4.1.3. Threat of New Entrants
- 4.1.4. Threat of Substitutes
- 4.1.5. Competitive Rivalry
- 4.2. PESTEL analysis
- 4.3. BCG Analysis
- 4.3.1. Stars (High Growth, High Market Share)
- 4.3.2. Cash Cows (Low Growth, High Market Share)
- 4.3.3. Question Mark (High Growth, Low Market Share)
- 4.3.4. Dogs (Low Growth, Low Market Share)
- 4.4. Ansoff Matrix Analysis
- 4.5. Supply Chain Analysis
- 4.6. Regulatory Landscape
- 4.7. Current Market Potential and Opportunity Assessment (TAM–SAM–SOM Framework)
- 4.8. NRP Analyst Note
- 4.1. Porters Five Forces
- 5. Market Analysis, Insights and Forecast 2021-2033
- 5.1. Market Analysis, Insights and Forecast - by Application
- 5.1.1. Hospital
- 5.1.2. Dental Clinic
- 5.1.3. Others
- 5.2. Market Analysis, Insights and Forecast - by Types
- 5.2.1. Leucite Based
- 5.2.2. Lithium Disilicate Based
- 5.2.3. Others
- 5.3. Market Analysis, Insights and Forecast - by Region
- 5.3.1. North America
- 5.3.2. South America
- 5.3.3. Europe
- 5.3.4. Middle East & Africa
- 5.3.5. Asia Pacific
- 5.1. Market Analysis, Insights and Forecast - by Application
- 6. Global Glass Dental Materials Analysis, Insights and Forecast, 2021-2033
- 6.1. Market Analysis, Insights and Forecast - by Application
- 6.1.1. Hospital
- 6.1.2. Dental Clinic
- 6.1.3. Others
- 6.2. Market Analysis, Insights and Forecast - by Types
- 6.2.1. Leucite Based
- 6.2.2. Lithium Disilicate Based
- 6.2.3. Others
- 6.1. Market Analysis, Insights and Forecast - by Application
- 7. North America Glass Dental Materials Analysis, Insights and Forecast, 2020-2032
- 7.1. Market Analysis, Insights and Forecast - by Application
- 7.1.1. Hospital
- 7.1.2. Dental Clinic
- 7.1.3. Others
- 7.2. Market Analysis, Insights and Forecast - by Types
- 7.2.1. Leucite Based
- 7.2.2. Lithium Disilicate Based
- 7.2.3. Others
- 7.1. Market Analysis, Insights and Forecast - by Application
- 8. South America Glass Dental Materials Analysis, Insights and Forecast, 2020-2032
- 8.1. Market Analysis, Insights and Forecast - by Application
- 8.1.1. Hospital
- 8.1.2. Dental Clinic
- 8.1.3. Others
- 8.2. Market Analysis, Insights and Forecast - by Types
- 8.2.1. Leucite Based
- 8.2.2. Lithium Disilicate Based
- 8.2.3. Others
- 8.1. Market Analysis, Insights and Forecast - by Application
- 9. Europe Glass Dental Materials Analysis, Insights and Forecast, 2020-2032
- 9.1. Market Analysis, Insights and Forecast - by Application
- 9.1.1. Hospital
- 9.1.2. Dental Clinic
- 9.1.3. Others
- 9.2. Market Analysis, Insights and Forecast - by Types
- 9.2.1. Leucite Based
- 9.2.2. Lithium Disilicate Based
- 9.2.3. Others
- 9.1. Market Analysis, Insights and Forecast - by Application
- 10. Middle East & Africa Glass Dental Materials Analysis, Insights and Forecast, 2020-2032
- 10.1. Market Analysis, Insights and Forecast - by Application
- 10.1.1. Hospital
- 10.1.2. Dental Clinic
- 10.1.3. Others
- 10.2. Market Analysis, Insights and Forecast - by Types
- 10.2.1. Leucite Based
- 10.2.2. Lithium Disilicate Based
- 10.2.3. Others
- 10.1. Market Analysis, Insights and Forecast - by Application
- 11. Asia Pacific Glass Dental Materials Analysis, Insights and Forecast, 2020-2032
- 11.1. Market Analysis, Insights and Forecast - by Application
- 11.1.1. Hospital
- 11.1.2. Dental Clinic
- 11.1.3. Others
- 11.2. Market Analysis, Insights and Forecast - by Types
- 11.2.1. Leucite Based
- 11.2.2. Lithium Disilicate Based
- 11.2.3. Others
- 11.1. Market Analysis, Insights and Forecast - by Application
- 12. Competitive Analysis
- 12.1. Company Profiles
- 12.1.1 SCHOTT
- 12.1.1.1. Company Overview
- 12.1.1.2. Products
- 12.1.1.3. Company Financials
- 12.1.1.4. SWOT Analysis
- 12.1.2 Ferro
- 12.1.2.1. Company Overview
- 12.1.2.2. Products
- 12.1.2.3. Company Financials
- 12.1.2.4. SWOT Analysis
- 12.1.3 3M
- 12.1.3.1. Company Overview
- 12.1.3.2. Products
- 12.1.3.3. Company Financials
- 12.1.3.4. SWOT Analysis
- 12.1.4 James Kent Group
- 12.1.4.1. Company Overview
- 12.1.4.2. Products
- 12.1.4.3. Company Financials
- 12.1.4.4. SWOT Analysis
- 12.1.5 Corning
- 12.1.5.1. Company Overview
- 12.1.5.2. Products
- 12.1.5.3. Company Financials
- 12.1.5.4. SWOT Analysis
- 12.1.6 GC Corporation
- 12.1.6.1. Company Overview
- 12.1.6.2. Products
- 12.1.6.3. Company Financials
- 12.1.6.4. SWOT Analysis
- 12.1.7 Ivoclar Vivadent AG
- 12.1.7.1. Company Overview
- 12.1.7.2. Products
- 12.1.7.3. Company Financials
- 12.1.7.4. SWOT Analysis
- 12.1.8 Shofu
- 12.1.8.1. Company Overview
- 12.1.8.2. Products
- 12.1.8.3. Company Financials
- 12.1.8.4. SWOT Analysis
- 12.1.9 DENTSPLY SIRONA
- 12.1.9.1. Company Overview
- 12.1.9.2. Products
- 12.1.9.3. Company Financials
- 12.1.9.4. SWOT Analysis
- 12.1.10 Kerr
- 12.1.10.1. Company Overview
- 12.1.10.2. Products
- 12.1.10.3. Company Financials
- 12.1.10.4. SWOT Analysis
- 12.1.11 DENTAURUM
- 12.1.11.1. Company Overview
- 12.1.11.2. Products
- 12.1.11.3. Company Financials
- 12.1.11.4. SWOT Analysis
- 12.1.12 Prime Dental
- 12.1.12.1. Company Overview
- 12.1.12.2. Products
- 12.1.12.3. Company Financials
- 12.1.12.4. SWOT Analysis
- 12.1.13 Promedica
- 12.1.13.1. Company Overview
- 12.1.13.2. Products
- 12.1.13.3. Company Financials
- 12.1.13.4. SWOT Analysis
- 12.1.14 I-dental
- 12.1.14.1. Company Overview
- 12.1.14.2. Products
- 12.1.14.3. Company Financials
- 12.1.14.4. SWOT Analysis
- 12.1.15 Shanghai Rongxiang Dental Material Co.
- 12.1.15.1. Company Overview
- 12.1.15.2. Products
- 12.1.15.3. Company Financials
- 12.1.15.4. SWOT Analysis
- 12.1.16 Ltd
- 12.1.16.1. Company Overview
- 12.1.16.2. Products
- 12.1.16.3. Company Financials
- 12.1.16.4. SWOT Analysis
- 12.1.17 Shanghai New Century Dental Materials Co.
- 12.1.17.1. Company Overview
- 12.1.17.2. Products
- 12.1.17.3. Company Financials
- 12.1.17.4. SWOT Analysis
- 12.1.18 Ltd
- 12.1.18.1. Company Overview
- 12.1.18.2. Products
- 12.1.18.3. Company Financials
- 12.1.18.4. SWOT Analysis
- 12.1.1 SCHOTT
- 12.2. Market Entropy
- 12.2.1 Company's Key Areas Served
- 12.2.2 Recent Developments
- 12.3. Company Market Share Analysis 2025
- 12.3.1 Top 5 Companies Market Share Analysis
- 12.3.2 Top 3 Companies Market Share Analysis
- 12.4. List of Potential Customers
- 13. Research Methodology
List of Figures
- Figure 1: Global Glass Dental Materials Revenue Breakdown (billion, %) by Region 2025 & 2033
- Figure 2: North America Glass Dental Materials Revenue (billion), by Application 2025 & 2033
- Figure 3: North America Glass Dental Materials Revenue Share (%), by Application 2025 & 2033
- Figure 4: North America Glass Dental Materials Revenue (billion), by Types 2025 & 2033
- Figure 5: North America Glass Dental Materials Revenue Share (%), by Types 2025 & 2033
- Figure 6: North America Glass Dental Materials Revenue (billion), by Country 2025 & 2033
- Figure 7: North America Glass Dental Materials Revenue Share (%), by Country 2025 & 2033
- Figure 8: South America Glass Dental Materials Revenue (billion), by Application 2025 & 2033
- Figure 9: South America Glass Dental Materials Revenue Share (%), by Application 2025 & 2033
- Figure 10: South America Glass Dental Materials Revenue (billion), by Types 2025 & 2033
- Figure 11: South America Glass Dental Materials Revenue Share (%), by Types 2025 & 2033
- Figure 12: South America Glass Dental Materials Revenue (billion), by Country 2025 & 2033
- Figure 13: South America Glass Dental Materials Revenue Share (%), by Country 2025 & 2033
- Figure 14: Europe Glass Dental Materials Revenue (billion), by Application 2025 & 2033
- Figure 15: Europe Glass Dental Materials Revenue Share (%), by Application 2025 & 2033
- Figure 16: Europe Glass Dental Materials Revenue (billion), by Types 2025 & 2033
- Figure 17: Europe Glass Dental Materials Revenue Share (%), by Types 2025 & 2033
- Figure 18: Europe Glass Dental Materials Revenue (billion), by Country 2025 & 2033
- Figure 19: Europe Glass Dental Materials Revenue Share (%), by Country 2025 & 2033
- Figure 20: Middle East & Africa Glass Dental Materials Revenue (billion), by Application 2025 & 2033
- Figure 21: Middle East & Africa Glass Dental Materials Revenue Share (%), by Application 2025 & 2033
- Figure 22: Middle East & Africa Glass Dental Materials Revenue (billion), by Types 2025 & 2033
- Figure 23: Middle East & Africa Glass Dental Materials Revenue Share (%), by Types 2025 & 2033
- Figure 24: Middle East & Africa Glass Dental Materials Revenue (billion), by Country 2025 & 2033
- Figure 25: Middle East & Africa Glass Dental Materials Revenue Share (%), by Country 2025 & 2033
- Figure 26: Asia Pacific Glass Dental Materials Revenue (billion), by Application 2025 & 2033
- Figure 27: Asia Pacific Glass Dental Materials Revenue Share (%), by Application 2025 & 2033
- Figure 28: Asia Pacific Glass Dental Materials Revenue (billion), by Types 2025 & 2033
- Figure 29: Asia Pacific Glass Dental Materials Revenue Share (%), by Types 2025 & 2033
- Figure 30: Asia Pacific Glass Dental Materials Revenue (billion), by Country 2025 & 2033
- Figure 31: Asia Pacific Glass Dental Materials Revenue Share (%), by Country 2025 & 2033
List of Tables
- Table 1: Global Glass Dental Materials Revenue billion Forecast, by Application 2020 & 2033
- Table 2: Global Glass Dental Materials Revenue billion Forecast, by Types 2020 & 2033
- Table 3: Global Glass Dental Materials Revenue billion Forecast, by Region 2020 & 2033
- Table 4: Global Glass Dental Materials Revenue billion Forecast, by Application 2020 & 2033
- Table 5: Global Glass Dental Materials Revenue billion Forecast, by Types 2020 & 2033
- Table 6: Global Glass Dental Materials Revenue billion Forecast, by Country 2020 & 2033
- Table 7: United States Glass Dental Materials Revenue (billion) Forecast, by Application 2020 & 2033
- Table 8: Canada Glass Dental Materials Revenue (billion) Forecast, by Application 2020 & 2033
- Table 9: Mexico Glass Dental Materials Revenue (billion) Forecast, by Application 2020 & 2033
- Table 10: Global Glass Dental Materials Revenue billion Forecast, by Application 2020 & 2033
- Table 11: Global Glass Dental Materials Revenue billion Forecast, by Types 2020 & 2033
- Table 12: Global Glass Dental Materials Revenue billion Forecast, by Country 2020 & 2033
- Table 13: Brazil Glass Dental Materials Revenue (billion) Forecast, by Application 2020 & 2033
- Table 14: Argentina Glass Dental Materials Revenue (billion) Forecast, by Application 2020 & 2033
- Table 15: Rest of South America Glass Dental Materials Revenue (billion) Forecast, by Application 2020 & 2033
- Table 16: Global Glass Dental Materials Revenue billion Forecast, by Application 2020 & 2033
- Table 17: Global Glass Dental Materials Revenue billion Forecast, by Types 2020 & 2033
- Table 18: Global Glass Dental Materials Revenue billion Forecast, by Country 2020 & 2033
- Table 19: United Kingdom Glass Dental Materials Revenue (billion) Forecast, by Application 2020 & 2033
- Table 20: Germany Glass Dental Materials Revenue (billion) Forecast, by Application 2020 & 2033
- Table 21: France Glass Dental Materials Revenue (billion) Forecast, by Application 2020 & 2033
- Table 22: Italy Glass Dental Materials Revenue (billion) Forecast, by Application 2020 & 2033
- Table 23: Spain Glass Dental Materials Revenue (billion) Forecast, by Application 2020 & 2033
- Table 24: Russia Glass Dental Materials Revenue (billion) Forecast, by Application 2020 & 2033
- Table 25: Benelux Glass Dental Materials Revenue (billion) Forecast, by Application 2020 & 2033
- Table 26: Nordics Glass Dental Materials Revenue (billion) Forecast, by Application 2020 & 2033
- Table 27: Rest of Europe Glass Dental Materials Revenue (billion) Forecast, by Application 2020 & 2033
- Table 28: Global Glass Dental Materials Revenue billion Forecast, by Application 2020 & 2033
- Table 29: Global Glass Dental Materials Revenue billion Forecast, by Types 2020 & 2033
- Table 30: Global Glass Dental Materials Revenue billion Forecast, by Country 2020 & 2033
- Table 31: Turkey Glass Dental Materials Revenue (billion) Forecast, by Application 2020 & 2033
- Table 32: Israel Glass Dental Materials Revenue (billion) Forecast, by Application 2020 & 2033
- Table 33: GCC Glass Dental Materials Revenue (billion) Forecast, by Application 2020 & 2033
- Table 34: North Africa Glass Dental Materials Revenue (billion) Forecast, by Application 2020 & 2033
- Table 35: South Africa Glass Dental Materials Revenue (billion) Forecast, by Application 2020 & 2033
- Table 36: Rest of Middle East & Africa Glass Dental Materials Revenue (billion) Forecast, by Application 2020 & 2033
- Table 37: Global Glass Dental Materials Revenue billion Forecast, by Application 2020 & 2033
- Table 38: Global Glass Dental Materials Revenue billion Forecast, by Types 2020 & 2033
- Table 39: Global Glass Dental Materials Revenue billion Forecast, by Country 2020 & 2033
- Table 40: China Glass Dental Materials Revenue (billion) Forecast, by Application 2020 & 2033
- Table 41: India Glass Dental Materials Revenue (billion) Forecast, by Application 2020 & 2033
- Table 42: Japan Glass Dental Materials Revenue (billion) Forecast, by Application 2020 & 2033
- Table 43: South Korea Glass Dental Materials Revenue (billion) Forecast, by Application 2020 & 2033
- Table 44: ASEAN Glass Dental Materials Revenue (billion) Forecast, by Application 2020 & 2033
- Table 45: Oceania Glass Dental Materials Revenue (billion) Forecast, by Application 2020 & 2033
- Table 46: Rest of Asia Pacific Glass Dental Materials Revenue (billion) Forecast, by Application 2020 & 2033
Frequently Asked Questions
1. What is the projected Compound Annual Growth Rate (CAGR) of the Glass Dental Materials?
The projected CAGR is approximately 8.13%.
2. Which companies are prominent players in the Glass Dental Materials?
Key companies in the market include SCHOTT, Ferro, 3M, James Kent Group, Corning, GC Corporation, Ivoclar Vivadent AG, Shofu, DENTSPLY SIRONA, Kerr, DENTAURUM, Prime Dental, Promedica, I-dental, Shanghai Rongxiang Dental Material Co., Ltd, Shanghai New Century Dental Materials Co., Ltd.
3. What are the main segments of the Glass Dental Materials?
The market segments include Application, Types.
4. Can you provide details about the market size?
The market size is estimated to be USD 13.84 billion as of 2022.
5. What are some drivers contributing to market growth?
N/A
6. What are the notable trends driving market growth?
N/A
7. Are there any restraints impacting market growth?
N/A
8. Can you provide examples of recent developments in the market?
N/A
9. What pricing options are available for accessing the report?
Pricing options include single-user, multi-user, and enterprise licenses priced at USD 4900.00, USD 7350.00, and USD 9800.00 respectively.
10. Is the market size provided in terms of value or volume?
The market size is provided in terms of value, measured in billion.
11. Are there any specific market keywords associated with the report?
Yes, the market keyword associated with the report is "Glass Dental Materials," which aids in identifying and referencing the specific market segment covered.
12. How do I determine which pricing option suits my needs best?
The pricing options vary based on user requirements and access needs. Individual users may opt for single-user licenses, while businesses requiring broader access may choose multi-user or enterprise licenses for cost-effective access to the report.
13. Are there any additional resources or data provided in the Glass Dental Materials report?
While the report offers comprehensive insights, it's advisable to review the specific contents or supplementary materials provided to ascertain if additional resources or data are available.
14. How can I stay updated on further developments or reports in the Glass Dental Materials?
To stay informed about further developments, trends, and reports in the Glass Dental Materials, consider subscribing to industry newsletters, following relevant companies and organizations, or regularly checking reputable industry news sources and publications.
Methodology
Step 1 - Identification of Relevant Samples Size from Population Database


Step 2 - Approaches for Defining Global Market Size (Value, Volume* & Price*)

Note*: In applicable scenarios
Step 3 - Data Sources
Primary Research
- Web Analytics
- Survey Reports
- Research Institute
- Latest Research Reports
- Opinion Leaders
Secondary Research
- Annual Reports
- White Paper
- Latest Press Release
- Industry Association
- Paid Database
- Investor Presentations

Step 4 - Data Triangulation
Involves using different sources of information in order to increase the validity of a study
These sources are likely to be stakeholders in a program - participants, other researchers, program staff, other community members, and so on.
Then we put all data in single framework & apply various statistical tools to find out the dynamic on the market.
During the analysis stage, feedback from the stakeholder groups would be compared to determine areas of agreement as well as areas of divergence