

Key Insights
The global optical genome mapping market is experiencing robust growth, projected to reach a substantial size with a Compound Annual Growth Rate (CAGR) of 18.50% from 2025 to 2033. This expansion is fueled by several key drivers. Firstly, the increasing prevalence of genetic disorders and the rising demand for accurate and efficient genome analysis are significantly boosting market adoption. Advances in optical genome mapping technology, offering higher resolution and throughput compared to traditional methods, are further accelerating market growth. The technology's ability to detect structural variations in the genome, which are often missed by other techniques, is proving invaluable in various applications, including cancer research, diagnostics, and drug development. Furthermore, increasing research funding allocated to genomics and the growing adoption of personalized medicine strategies are contributing to market expansion. The market is segmented by product type (instruments and consumables) and end-user (biotechnology and pharmaceutical companies, research and academic institutions, and others). Biotechnology and pharmaceutical companies are the major consumers, driving significant demand for both instruments and consumables.
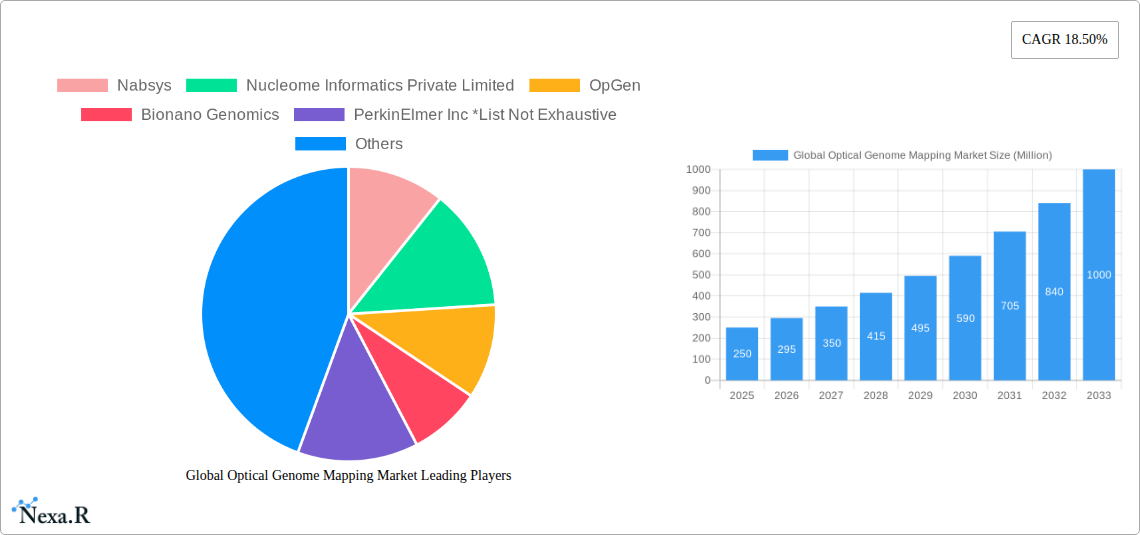
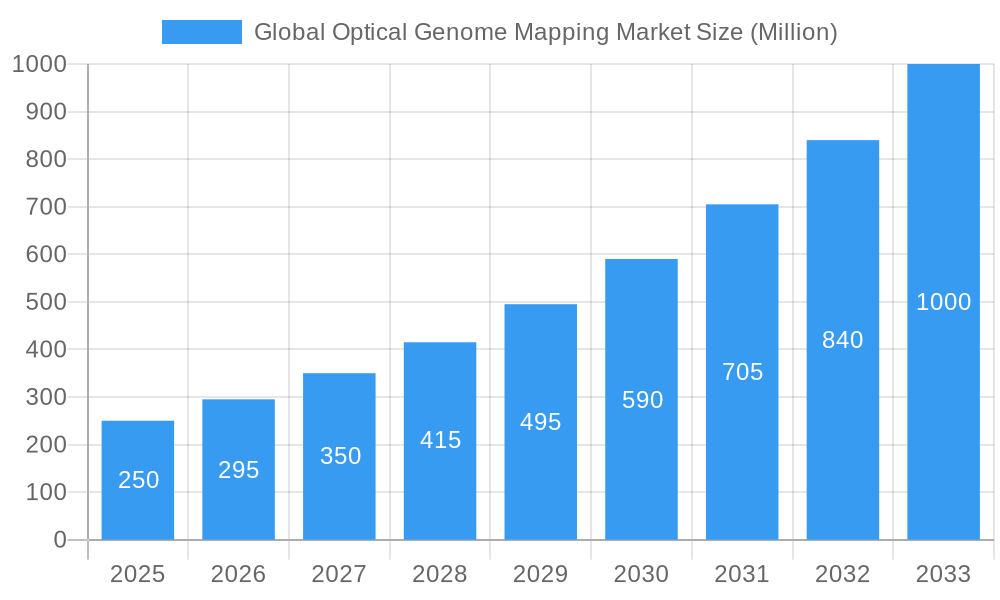
Global Optical Genome Mapping Market Market Size (In Million)
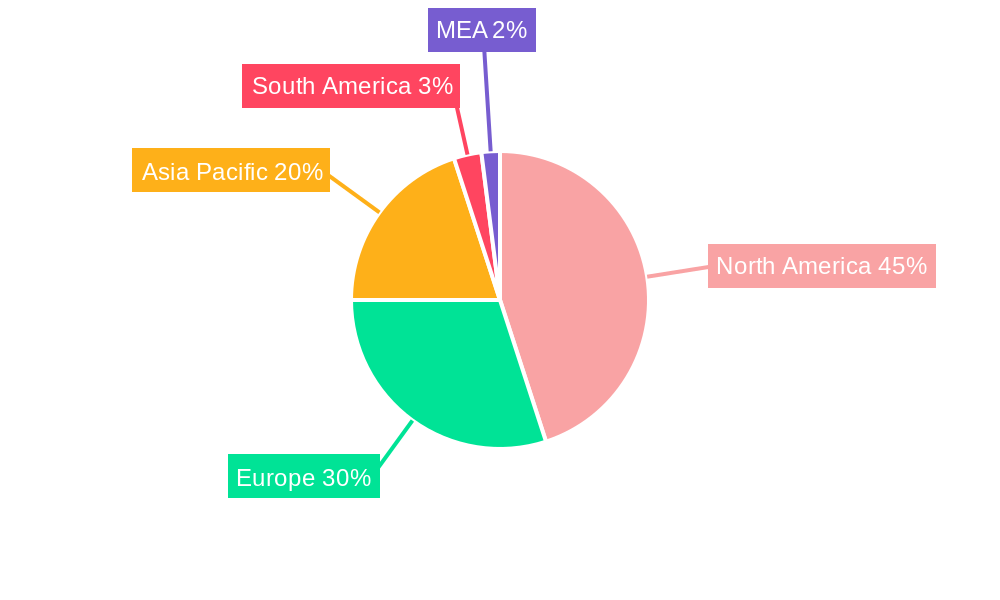
The market's growth trajectory is influenced by several trends. The development of more user-friendly and cost-effective optical genome mapping systems is making the technology more accessible to a broader range of researchers and clinicians. Furthermore, strategic collaborations between technology providers and research institutions are accelerating technological advancements and expanding market applications. Despite the positive outlook, the market faces some restraints. The high initial investment required for purchasing optical genome mapping instruments can be a barrier for smaller research institutions and laboratories. Moreover, the need for specialized expertise and training to operate these sophisticated instruments could limit wider adoption. However, the overall market outlook remains optimistic, driven by ongoing technological innovation and the increasing importance of genome mapping in diverse healthcare and research applications. The North American market currently holds a significant share, driven by strong research infrastructure and early adoption of advanced technologies. However, the Asia Pacific region is anticipated to exhibit rapid growth in the coming years, fueled by expanding healthcare expenditure and increasing investments in genomic research.
Global Optical Genome Mapping Market Company Market Share
Global Optical Genome Mapping Market: A Comprehensive Report (2019-2033)
This comprehensive report provides an in-depth analysis of the global optical genome mapping market, encompassing market dynamics, growth trends, regional analysis, competitive landscape, and future outlook. The study period covers 2019-2033, with 2025 as the base and estimated year. The forecast period spans 2025-2033, and the historical period encompasses 2019-2024. This report is an essential resource for industry professionals, investors, and researchers seeking to understand this rapidly evolving market. The parent market is the Genomics market and the child market is Optical Genome Mapping.
Global Optical Genome Mapping Market Market Dynamics & Structure
The global optical genome mapping market is characterized by moderate concentration, with key players such as Bionano Genomics, OpGen, and PerkinElmer Inc. holding significant market share. The market size in 2025 is estimated at $XX million. The market exhibits a competitive landscape driven by continuous technological innovation, particularly in instrument sensitivity and throughput. Stringent regulatory frameworks governing diagnostic applications pose challenges, while the availability of alternative technologies, such as next-generation sequencing, presents competitive substitution. The end-user segment is primarily comprised of biotechnology and pharmaceutical companies, research institutions, and hospitals. M&A activity has been relatively limited in recent years, with approximately xx deals recorded in the historical period, resulting in a xx% market share consolidation.
- Market Concentration: Moderately concentrated, with top 5 players holding approximately xx% market share in 2025.
- Technological Innovation: Focus on improving image resolution, data analysis algorithms, and workflow efficiency.
- Regulatory Framework: Stringent regulations particularly for clinical diagnostic applications in key regions.
- Competitive Substitutes: Next-generation sequencing (NGS) and other genomic analysis techniques.
- End-User Demographics: Dominated by biotechnology & pharmaceutical companies, followed by research institutions.
- M&A Trends: Limited activity in recent years, with xx deals recorded during 2019-2024, leading to a xx% increase in market concentration.
Global Optical Genome Mapping Market Growth Trends & Insights
The global optical genome mapping market is projected to experience robust growth throughout the forecast period, with a CAGR of xx% from 2025 to 2033. This growth is primarily driven by increasing demand for accurate and high-throughput genome analysis, coupled with technological advancements that are improving the cost-effectiveness and speed of optical genome mapping. Market penetration is currently estimated at xx%, with significant untapped potential in emerging economies. The adoption of optical genome mapping is being driven by its ability to detect structural variations with higher resolution than alternative technologies. This is leading to increased adoption in various applications, including cancer research, infectious disease diagnostics, and plant breeding.
The market size is expected to reach $xx million by 2033, driven by factors such as increasing research funding in genomics, growing prevalence of genetic disorders, and rising demand for personalized medicine. Technological advancements, such as improved instrument design and automation, are expected to drive further market expansion.
Dominant Regions, Countries, or Segments in Global Optical Genome Mapping Market
North America currently dominates the global optical genome mapping market, holding a xx% market share in 2025, driven by the presence of major market players, robust research infrastructure, and high healthcare spending. Within product types, the instruments segment holds the largest share, at approximately xx%, due to high initial investment and recurring consumable sales. Biotechnology and pharmaceutical companies represent the largest end-user segment, accounting for approximately xx% of the market, driven by the demand for rapid and accurate genome analysis in drug discovery and development.
- North America: High market share driven by robust R&D spending and presence of key players.
- Europe: Significant growth potential due to increasing adoption in research institutions.
- Asia Pacific: Fastest-growing region due to rising healthcare spending and increasing government investments in genomics research.
- Instruments Segment: Largest market share driven by high initial investment and consumable sales.
- Biotechnology & Pharmaceutical Companies: Largest end-user segment due to the extensive use of optical genome mapping in drug discovery.
Global Optical Genome Mapping Market Product Landscape
Optical genome mapping systems are sophisticated instruments used to analyze the genome at high resolution. Recent innovations have focused on enhancing throughput, improving image quality, and reducing cost. Advancements in data analysis algorithms have streamlined the workflow and reduced error rates. Key features include automated sample preparation, high-throughput capabilities, and user-friendly software. Unique selling propositions include the ability to detect structural variations and large-scale rearrangements with unparalleled accuracy, enabling a better understanding of genetic diseases and other genomic disorders.
Key Drivers, Barriers & Challenges in Global Optical Genome Mapping Market
Key Drivers:
- Increasing demand for high-resolution genome analysis in research and clinical applications.
- Advancements in instrument technology, leading to higher throughput and lower costs.
- Growing adoption of personalized medicine and growing awareness of genetic disorders.
Key Barriers & Challenges:
- High initial investment costs associated with optical genome mapping systems, impacting affordability.
- Complexity of data analysis algorithms, requiring specialized training and expertise.
- Competition from other genomic analysis technologies, such as NGS.
- Regulatory hurdles for clinical applications in certain regions.
Emerging Opportunities in Global Optical Genome Mapping Market
- Expansion into emerging markets with growing healthcare budgets and genomic research programs.
- Development of new applications in areas like infectious disease diagnostics and plant breeding.
- Integration with other genomics technologies to offer comprehensive solutions.
- Development of user-friendly software and improved data analysis tools.
Growth Accelerators in the Global Optical Genome Mapping Market Industry
Technological advancements, particularly in automated sample preparation, improved image analysis algorithms and reduced costs of reagents, are key growth accelerators. Strategic partnerships between instrument manufacturers and diagnostic companies are expanding the market reach, while increasing government funding for genomic research is further fueling market expansion. Expansion into new therapeutic areas such as oncology and infectious diseases, is also creating opportunities for growth.
Key Players Shaping the Global Optical Genome Mapping Market Market
- Nabsys
- Nucleome Informatics Private Limited
- OpGen
- Bionano Genomics
- PerkinElmer Inc
- List Not Exhaustive
Notable Milestones in Global Optical Genome Mapping Market Sector
- 2020: Bionano Genomics launches the Saphyr system, significantly improving throughput and data quality.
- 2022: OpGen receives FDA clearance for a new diagnostic assay using optical genome mapping technology.
- 2023: Several key partnerships announced between optical genome mapping companies and pharmaceutical firms for drug development. (Specific details are not available and therefore replaced with "Several key partnerships")
- XX: (Insert significant milestone with date, if available)
In-Depth Global Optical Genome Mapping Market Market Outlook
The global optical genome mapping market is poised for significant growth in the coming years, driven by continuous technological innovation, increasing demand for high-resolution genome analysis, and the expansion of applications into new therapeutic areas. Strategic collaborations between technology providers and end-users are further accelerating market adoption. The long-term market potential is substantial, particularly in developing regions with growing healthcare spending and increased awareness of the value of genomic information. Opportunities exist for companies to develop cost-effective solutions, user-friendly software and to expand into untapped markets globally.
Global Optical Genome Mapping Market Segmentation
-
1. Product Type
- 1.1. Instruments(Optical Genome Mapping Instrument)
- 1.2. Consumables
-
2. End-User
- 2.1. Biotechnology & Pharmaceutical Companies
- 2.2. Research & Academic Institutions
- 2.3. Others
Global Optical Genome Mapping Market Segmentation By Geography
-
1. North America
- 1.1. United States
- 1.2. Canada
- 1.3. Mexico
-
2. Europe
- 2.1. Germany
- 2.2. United Kingdom
- 2.3. France
- 2.4. Italy
- 2.5. Spain
- 2.6. Rest of Europe
-
3. Asia Pacific
- 3.1. China
- 3.2. Japan
- 3.3. India
- 3.4. Australia
- 3.5. South Korea
- 3.6. Rest of Asia Pacific
- 4. Rest of World
Global Optical Genome Mapping Market Regional Market Share
Geographic Coverage of Global Optical Genome Mapping Market
Global Optical Genome Mapping Market REPORT HIGHLIGHTS
| Aspects | Details |
|---|---|
| Study Period | 2020-2034 |
| Base Year | 2025 |
| Estimated Year | 2026 |
| Forecast Period | 2026-2034 |
| Historical Period | 2020-2025 |
| Growth Rate | CAGR of 26.8% from 2020-2034 |
| Segmentation |
|
Table of Contents
- 1. Introduction
- 1.1. Research Scope
- 1.2. Market Segmentation
- 1.3. Research Objective
- 1.4. Definitions and Assumptions
- 2. Executive Summary
- 2.1. Market Snapshot
- 3. Market Dynamics
- 3.1. Market Drivers
- 3.2. Market Restrains
- 3.3. Market Trends
- 3.4. Market Opportunities
- 4. Market Factor Analysis
- 4.1. Porters Five Forces
- 4.1.1. Bargaining Power of Suppliers
- 4.1.2. Bargaining Power of Buyers
- 4.1.3. Threat of New Entrants
- 4.1.4. Threat of Substitutes
- 4.1.5. Competitive Rivalry
- 4.2. PESTEL analysis
- 4.3. BCG Analysis
- 4.3.1. Stars (High Growth, High Market Share)
- 4.3.2. Cash Cows (Low Growth, High Market Share)
- 4.3.3. Question Mark (High Growth, Low Market Share)
- 4.3.4. Dogs (Low Growth, Low Market Share)
- 4.4. Ansoff Matrix Analysis
- 4.5. Supply Chain Analysis
- 4.6. Regulatory Landscape
- 4.7. Current Market Potential and Opportunity Assessment (TAM–SAM–SOM Framework)
- 4.8. NRP Analyst Note
- 4.1. Porters Five Forces
- 5. Market Analysis, Insights and Forecast 2021-2033
- 5.1. Market Analysis, Insights and Forecast - by Product Type
- 5.1.1. Instruments(Optical Genome Mapping Instrument)
- 5.1.2. Consumables
- 5.2. Market Analysis, Insights and Forecast - by End-User
- 5.2.1. Biotechnology & Pharmaceutical Companies
- 5.2.2. Research & Academic Institutions
- 5.2.3. Others
- 5.3. Market Analysis, Insights and Forecast - by Region
- 5.3.1. North America
- 5.3.2. Europe
- 5.3.3. Asia Pacific
- 5.3.4. Rest of World
- 5.1. Market Analysis, Insights and Forecast - by Product Type
- 6. Global Optical Genome Mapping Market Analysis, Insights and Forecast, 2021-2033
- 6.1. Market Analysis, Insights and Forecast - by Product Type
- 6.1.1. Instruments(Optical Genome Mapping Instrument)
- 6.1.2. Consumables
- 6.2. Market Analysis, Insights and Forecast - by End-User
- 6.2.1. Biotechnology & Pharmaceutical Companies
- 6.2.2. Research & Academic Institutions
- 6.2.3. Others
- 6.1. Market Analysis, Insights and Forecast - by Product Type
- 7. North America Global Optical Genome Mapping Market Analysis, Insights and Forecast, 2020-2032
- 7.1. Market Analysis, Insights and Forecast - by Product Type
- 7.1.1. Instruments(Optical Genome Mapping Instrument)
- 7.1.2. Consumables
- 7.2. Market Analysis, Insights and Forecast - by End-User
- 7.2.1. Biotechnology & Pharmaceutical Companies
- 7.2.2. Research & Academic Institutions
- 7.2.3. Others
- 7.1. Market Analysis, Insights and Forecast - by Product Type
- 8. Europe Global Optical Genome Mapping Market Analysis, Insights and Forecast, 2020-2032
- 8.1. Market Analysis, Insights and Forecast - by Product Type
- 8.1.1. Instruments(Optical Genome Mapping Instrument)
- 8.1.2. Consumables
- 8.2. Market Analysis, Insights and Forecast - by End-User
- 8.2.1. Biotechnology & Pharmaceutical Companies
- 8.2.2. Research & Academic Institutions
- 8.2.3. Others
- 8.1. Market Analysis, Insights and Forecast - by Product Type
- 9. Asia Pacific Global Optical Genome Mapping Market Analysis, Insights and Forecast, 2020-2032
- 9.1. Market Analysis, Insights and Forecast - by Product Type
- 9.1.1. Instruments(Optical Genome Mapping Instrument)
- 9.1.2. Consumables
- 9.2. Market Analysis, Insights and Forecast - by End-User
- 9.2.1. Biotechnology & Pharmaceutical Companies
- 9.2.2. Research & Academic Institutions
- 9.2.3. Others
- 9.1. Market Analysis, Insights and Forecast - by Product Type
- 10. Rest of World Global Optical Genome Mapping Market Analysis, Insights and Forecast, 2020-2032
- 10.1. Market Analysis, Insights and Forecast - by Product Type
- 10.1.1. Instruments(Optical Genome Mapping Instrument)
- 10.1.2. Consumables
- 10.2. Market Analysis, Insights and Forecast - by End-User
- 10.2.1. Biotechnology & Pharmaceutical Companies
- 10.2.2. Research & Academic Institutions
- 10.2.3. Others
- 10.1. Market Analysis, Insights and Forecast - by Product Type
- 11. Competitive Analysis
- 11.1. Company Profiles
- 11.1.1 Nabsys
- 11.1.1.1. Company Overview
- 11.1.1.2. Products
- 11.1.1.3. Company Financials
- 11.1.1.4. SWOT Analysis
- 11.1.2 Nucleome Informatics Private Limited
- 11.1.2.1. Company Overview
- 11.1.2.2. Products
- 11.1.2.3. Company Financials
- 11.1.2.4. SWOT Analysis
- 11.1.3 OpGen
- 11.1.3.1. Company Overview
- 11.1.3.2. Products
- 11.1.3.3. Company Financials
- 11.1.3.4. SWOT Analysis
- 11.1.4 Bionano Genomics
- 11.1.4.1. Company Overview
- 11.1.4.2. Products
- 11.1.4.3. Company Financials
- 11.1.4.4. SWOT Analysis
- 11.1.5 PerkinElmer Inc *List Not Exhaustive
- 11.1.5.1. Company Overview
- 11.1.5.2. Products
- 11.1.5.3. Company Financials
- 11.1.5.4. SWOT Analysis
- 11.1.1 Nabsys
- 11.2. Market Entropy
- 11.2.1 Company's Key Areas Served
- 11.2.2 Recent Developments
- 11.3. Company Market Share Analysis 2025
- 11.3.1 Top 5 Companies Market Share Analysis
- 11.3.2 Top 3 Companies Market Share Analysis
- 11.4. List of Potential Customers
- 12. Research Methodology
List of Figures
- Figure 1: Global Global Optical Genome Mapping Market Revenue Breakdown (million, %) by Region 2025 & 2033
- Figure 2: North America Global Optical Genome Mapping Market Revenue (million), by Product Type 2025 & 2033
- Figure 3: North America Global Optical Genome Mapping Market Revenue Share (%), by Product Type 2025 & 2033
- Figure 4: North America Global Optical Genome Mapping Market Revenue (million), by End-User 2025 & 2033
- Figure 5: North America Global Optical Genome Mapping Market Revenue Share (%), by End-User 2025 & 2033
- Figure 6: North America Global Optical Genome Mapping Market Revenue (million), by Country 2025 & 2033
- Figure 7: North America Global Optical Genome Mapping Market Revenue Share (%), by Country 2025 & 2033
- Figure 8: Europe Global Optical Genome Mapping Market Revenue (million), by Product Type 2025 & 2033
- Figure 9: Europe Global Optical Genome Mapping Market Revenue Share (%), by Product Type 2025 & 2033
- Figure 10: Europe Global Optical Genome Mapping Market Revenue (million), by End-User 2025 & 2033
- Figure 11: Europe Global Optical Genome Mapping Market Revenue Share (%), by End-User 2025 & 2033
- Figure 12: Europe Global Optical Genome Mapping Market Revenue (million), by Country 2025 & 2033
- Figure 13: Europe Global Optical Genome Mapping Market Revenue Share (%), by Country 2025 & 2033
- Figure 14: Asia Pacific Global Optical Genome Mapping Market Revenue (million), by Product Type 2025 & 2033
- Figure 15: Asia Pacific Global Optical Genome Mapping Market Revenue Share (%), by Product Type 2025 & 2033
- Figure 16: Asia Pacific Global Optical Genome Mapping Market Revenue (million), by End-User 2025 & 2033
- Figure 17: Asia Pacific Global Optical Genome Mapping Market Revenue Share (%), by End-User 2025 & 2033
- Figure 18: Asia Pacific Global Optical Genome Mapping Market Revenue (million), by Country 2025 & 2033
- Figure 19: Asia Pacific Global Optical Genome Mapping Market Revenue Share (%), by Country 2025 & 2033
- Figure 20: Rest of World Global Optical Genome Mapping Market Revenue (million), by Product Type 2025 & 2033
- Figure 21: Rest of World Global Optical Genome Mapping Market Revenue Share (%), by Product Type 2025 & 2033
- Figure 22: Rest of World Global Optical Genome Mapping Market Revenue (million), by End-User 2025 & 2033
- Figure 23: Rest of World Global Optical Genome Mapping Market Revenue Share (%), by End-User 2025 & 2033
- Figure 24: Rest of World Global Optical Genome Mapping Market Revenue (million), by Country 2025 & 2033
- Figure 25: Rest of World Global Optical Genome Mapping Market Revenue Share (%), by Country 2025 & 2033
List of Tables
- Table 1: Global Optical Genome Mapping Market Revenue million Forecast, by Product Type 2020 & 2033
- Table 2: Global Optical Genome Mapping Market Revenue million Forecast, by End-User 2020 & 2033
- Table 3: Global Optical Genome Mapping Market Revenue million Forecast, by Region 2020 & 2033
- Table 4: Global Optical Genome Mapping Market Revenue million Forecast, by Product Type 2020 & 2033
- Table 5: Global Optical Genome Mapping Market Revenue million Forecast, by End-User 2020 & 2033
- Table 6: Global Optical Genome Mapping Market Revenue million Forecast, by Country 2020 & 2033
- Table 7: United States Global Optical Genome Mapping Market Revenue (million) Forecast, by Application 2020 & 2033
- Table 8: Canada Global Optical Genome Mapping Market Revenue (million) Forecast, by Application 2020 & 2033
- Table 9: Mexico Global Optical Genome Mapping Market Revenue (million) Forecast, by Application 2020 & 2033
- Table 10: Global Optical Genome Mapping Market Revenue million Forecast, by Product Type 2020 & 2033
- Table 11: Global Optical Genome Mapping Market Revenue million Forecast, by End-User 2020 & 2033
- Table 12: Global Optical Genome Mapping Market Revenue million Forecast, by Country 2020 & 2033
- Table 13: Germany Global Optical Genome Mapping Market Revenue (million) Forecast, by Application 2020 & 2033
- Table 14: United Kingdom Global Optical Genome Mapping Market Revenue (million) Forecast, by Application 2020 & 2033
- Table 15: France Global Optical Genome Mapping Market Revenue (million) Forecast, by Application 2020 & 2033
- Table 16: Italy Global Optical Genome Mapping Market Revenue (million) Forecast, by Application 2020 & 2033
- Table 17: Spain Global Optical Genome Mapping Market Revenue (million) Forecast, by Application 2020 & 2033
- Table 18: Rest of Europe Global Optical Genome Mapping Market Revenue (million) Forecast, by Application 2020 & 2033
- Table 19: Global Optical Genome Mapping Market Revenue million Forecast, by Product Type 2020 & 2033
- Table 20: Global Optical Genome Mapping Market Revenue million Forecast, by End-User 2020 & 2033
- Table 21: Global Optical Genome Mapping Market Revenue million Forecast, by Country 2020 & 2033
- Table 22: China Global Optical Genome Mapping Market Revenue (million) Forecast, by Application 2020 & 2033
- Table 23: Japan Global Optical Genome Mapping Market Revenue (million) Forecast, by Application 2020 & 2033
- Table 24: India Global Optical Genome Mapping Market Revenue (million) Forecast, by Application 2020 & 2033
- Table 25: Australia Global Optical Genome Mapping Market Revenue (million) Forecast, by Application 2020 & 2033
- Table 26: South Korea Global Optical Genome Mapping Market Revenue (million) Forecast, by Application 2020 & 2033
- Table 27: Rest of Asia Pacific Global Optical Genome Mapping Market Revenue (million) Forecast, by Application 2020 & 2033
- Table 28: Global Optical Genome Mapping Market Revenue million Forecast, by Product Type 2020 & 2033
- Table 29: Global Optical Genome Mapping Market Revenue million Forecast, by End-User 2020 & 2033
- Table 30: Global Optical Genome Mapping Market Revenue million Forecast, by Country 2020 & 2033
Frequently Asked Questions
1. What is the projected Compound Annual Growth Rate (CAGR) of the Global Optical Genome Mapping Market?
The projected CAGR is approximately 26.8%.
2. Which companies are prominent players in the Global Optical Genome Mapping Market?
Key companies in the market include Nabsys, Nucleome Informatics Private Limited, OpGen, Bionano Genomics, PerkinElmer Inc *List Not Exhaustive.
3. What are the main segments of the Global Optical Genome Mapping Market?
The market segments include Product Type, End-User.
4. Can you provide details about the market size?
The market size is estimated to be USD 130.53 million as of 2022.
5. What are some drivers contributing to market growth?
Rapidly Increasing Bio-Pharmaceutical Advances in Drug Development Coupled with Government Funding; Cost-effectiveness and Accuracy.
6. What are the notable trends driving market growth?
Optical Genome Mapping Instruments are Expected to Witness a Positive Growth Over the Forecast Period.
7. Are there any restraints impacting market growth?
Lack of Skilled Technicians & Complex Procedures.
8. Can you provide examples of recent developments in the market?
N/A
9. What pricing options are available for accessing the report?
Pricing options include single-user, multi-user, and enterprise licenses priced at USD 4750, USD 5250, and USD 8750 respectively.
10. Is the market size provided in terms of value or volume?
The market size is provided in terms of value, measured in million.
11. Are there any specific market keywords associated with the report?
Yes, the market keyword associated with the report is "Global Optical Genome Mapping Market," which aids in identifying and referencing the specific market segment covered.
12. How do I determine which pricing option suits my needs best?
The pricing options vary based on user requirements and access needs. Individual users may opt for single-user licenses, while businesses requiring broader access may choose multi-user or enterprise licenses for cost-effective access to the report.
13. Are there any additional resources or data provided in the Global Optical Genome Mapping Market report?
While the report offers comprehensive insights, it's advisable to review the specific contents or supplementary materials provided to ascertain if additional resources or data are available.
14. How can I stay updated on further developments or reports in the Global Optical Genome Mapping Market?
To stay informed about further developments, trends, and reports in the Global Optical Genome Mapping Market, consider subscribing to industry newsletters, following relevant companies and organizations, or regularly checking reputable industry news sources and publications.
Methodology
Step 1 - Identification of Relevant Samples Size from Population Database


Step 2 - Approaches for Defining Global Market Size (Value, Volume* & Price*)

Note*: In applicable scenarios
Step 3 - Data Sources
Primary Research
- Web Analytics
- Survey Reports
- Research Institute
- Latest Research Reports
- Opinion Leaders
Secondary Research
- Annual Reports
- White Paper
- Latest Press Release
- Industry Association
- Paid Database
- Investor Presentations

Step 4 - Data Triangulation
Involves using different sources of information in order to increase the validity of a study
These sources are likely to be stakeholders in a program - participants, other researchers, program staff, other community members, and so on.
Then we put all data in single framework & apply various statistical tools to find out the dynamic on the market.
During the analysis stage, feedback from the stakeholder groups would be compared to determine areas of agreement as well as areas of divergence