

Key Insights
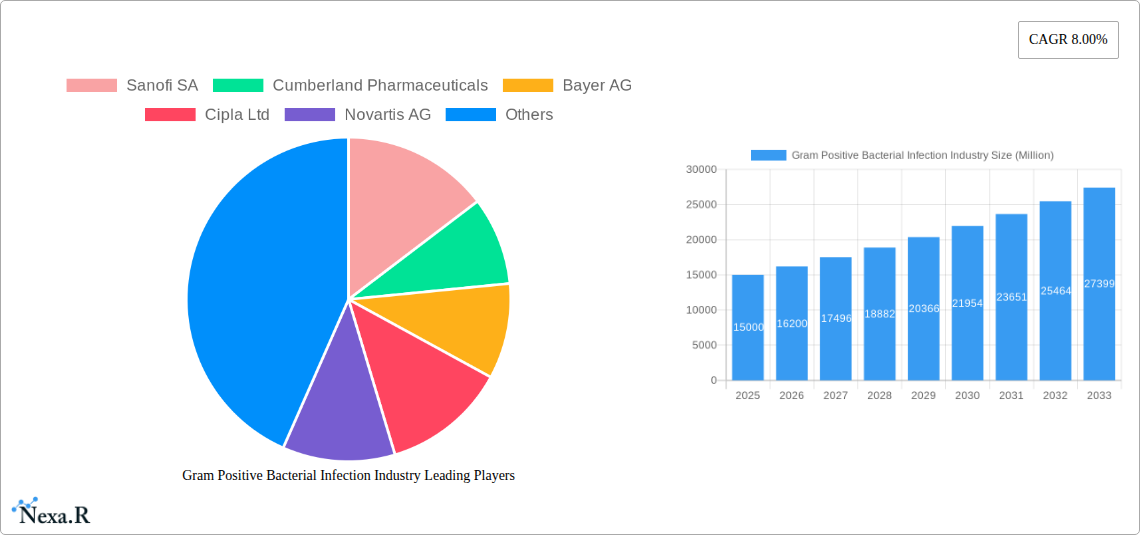
The Gram-positive bacterial infection treatment market, currently exhibiting robust growth, is projected to maintain a significant expansion trajectory throughout the forecast period (2025-2033). A compound annual growth rate (CAGR) of 8.00% indicates a substantial increase in market value, driven by several key factors. The rising prevalence of drug-resistant strains, particularly Methicillin-resistant Staphylococcus aureus (MRSA), necessitates the development and adoption of novel therapeutic strategies, fueling market growth. Furthermore, the increasing geriatric population, coupled with a growing incidence of chronic conditions that predispose individuals to gram-positive infections (like pneumonia and sepsis), contributes to escalating market demand. Technological advancements in diagnostics and treatment options, including the development of advanced antimicrobial agents and vaccines, also contribute positively to market expansion. The market is segmented by drug type (beta-lactams, fluoroquinolones, penicillins, cephalosporins, RNA Immunoprecipitation [RIP] based therapies, vaccines, and others), disease type (pneumonia, sepsis, pharyngitis, MRSA infections, endocarditis, meningitis, and others), and distribution channel (hospital, retail, and online pharmacies). The significant presence of major pharmaceutical companies like Sanofi, Bayer, Pfizer, and others ensures a competitive landscape driving innovation and accessibility of treatment options.
However, several restraints pose challenges to market growth. The high cost of novel antimicrobial agents and the emergence of resistance to existing therapies are notable concerns. Regulatory hurdles and lengthy approval processes for new drugs also contribute to market limitations. Geographical variations in healthcare infrastructure and access to quality healthcare further impact market penetration, especially in developing regions. Despite these limitations, the persistent threat of drug-resistant infections, coupled with ongoing research and development efforts, indicates a promising future for this market. Effective strategies to combat antimicrobial resistance, improved healthcare access, and the development of cost-effective treatment solutions are crucial for optimizing market potential. The continued focus on prevention strategies, like improved hygiene and vaccination campaigns, also plays a vital role in mitigating the burden of gram-positive bacterial infections and ultimately influencing market dynamics.
This comprehensive report provides a detailed analysis of the Gram Positive Bacterial Infection industry, encompassing market dynamics, growth trends, regional dominance, product landscape, key players, and future outlook. With a study period spanning 2019-2033, a base year of 2025, and a forecast period of 2025-2033, this report is an invaluable resource for industry professionals, investors, and researchers seeking to understand and navigate this crucial sector. The market is segmented by drug type, disease, and distribution channel, providing granular insights into its multifaceted structure. The total market value in 2025 is estimated at xx Million.
Gram Positive Bacterial Infection Industry Market Dynamics & Structure
The Gram Positive Bacterial Infection market is characterized by a moderately concentrated landscape with several major players competing for market share. Technological innovation, primarily focused on developing novel antibiotics and improving existing treatments, is a key driver. Stringent regulatory frameworks, including FDA approvals and international guidelines, significantly influence market entry and product development. The rise of antibiotic resistance poses a major challenge, driving demand for novel treatment options. Competitive product substitutes, such as alternative therapies and preventative measures, also impact market growth. The end-user demographic encompasses a wide range of patients across different age groups and health conditions. Mergers and acquisitions (M&A) activity remains relatively active, with larger pharmaceutical companies acquiring smaller biotech firms to expand their portfolios and gain access to new technologies.
- Market Concentration: Moderately concentrated, with top 10 players holding approximately xx% market share in 2025.
- Technological Innovation: Focus on novel antibiotics, personalized medicine, and improved diagnostics.
- Regulatory Framework: Stringent FDA approvals and international guidelines impacting market access.
- Competitive Substitutes: Alternative therapies and preventative measures influencing market demand.
- M&A Activity: xx major deals recorded between 2019 and 2024, indicative of industry consolidation.
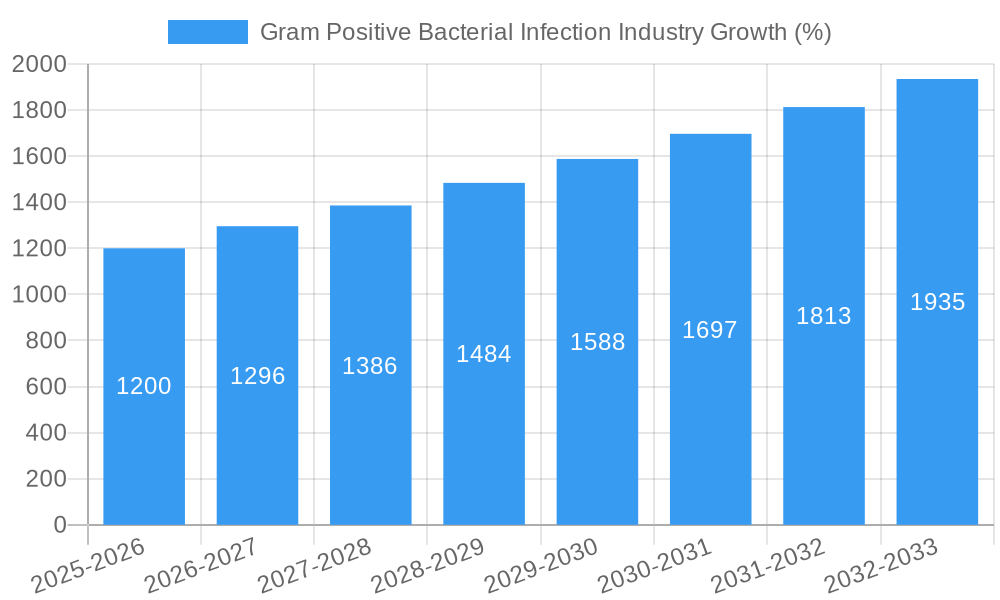
Gram Positive Bacterial Infection Industry Growth Trends & Insights
The Gram Positive Bacterial Infection market has experienced steady growth over the historical period (2019-2024), driven by factors such as the increasing prevalence of bacterial infections, rising healthcare expenditure, and technological advancements in diagnostic and treatment modalities. The market is projected to witness a Compound Annual Growth Rate (CAGR) of xx% during the forecast period (2025-2033), reaching an estimated value of xx Million by 2033. This growth is attributed to several key factors: the emergence of new treatment options, expanding healthcare infrastructure in developing countries, and a growing awareness among patients about the importance of early diagnosis and treatment. Adoption rates of new drugs vary based on efficacy and safety profiles. Technological disruptions, particularly in diagnostics, are accelerating treatment speed and improving patient outcomes. Consumer behavior shifts toward preventive healthcare and personalized medicine contribute to market growth.
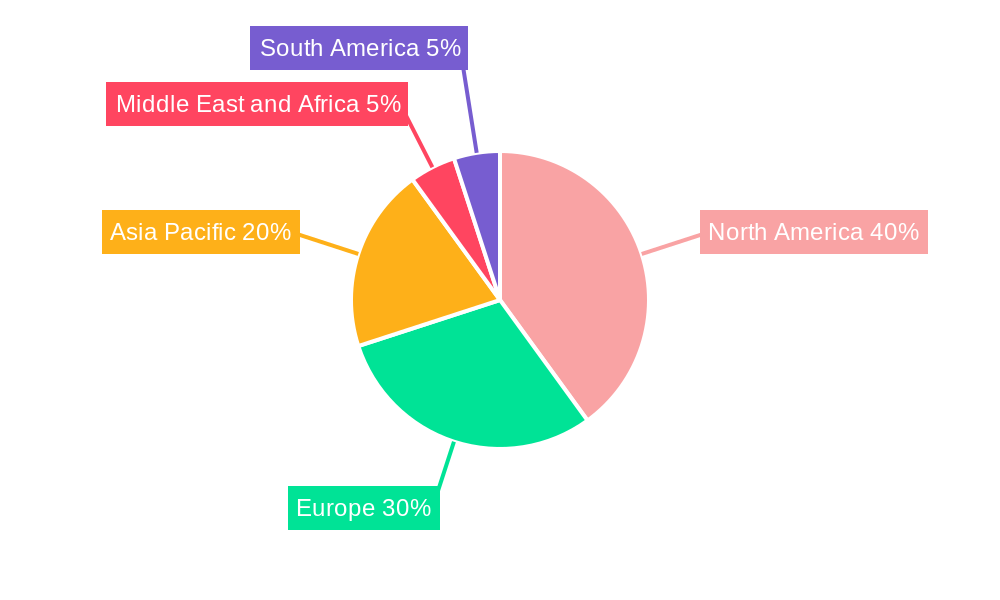
Dominant Regions, Countries, or Segments in Gram Positive Bacterial Infection Industry
North America currently holds the largest market share in the Gram Positive Bacterial Infection industry, driven by factors such as high healthcare spending, advanced medical infrastructure, and a high prevalence of bacterial infections. Europe is another significant market, with similar drivers. Within the segments:
By Drug Type: Beta-Lactam Antimicrobials and Cephalosporins represent the largest segments, driven by their widespread use and established efficacy.
By Disease: Pneumonia and MRSA infections account for significant market share due to their high prevalence and severity.
By Distribution Channel: Hospital pharmacies dominate the distribution channel, reflecting the high proportion of inpatient treatment for severe bacterial infections.
- North America: High healthcare expenditure, advanced infrastructure, and high prevalence of infections drive market dominance.
- Europe: Similar factors to North America contribute to significant market presence.
- Asia-Pacific: Rapidly growing market due to increasing healthcare spending and rising prevalence of infections.
- Beta-Lactam Antimicrobials: Largest segment due to widespread use and established efficacy.
- Pneumonia: Highest prevalence among diseases, driving significant market demand.
- Hospital Pharmacies: Primary distribution channel due to inpatient treatment needs.
Gram Positive Bacterial Infection Industry Product Landscape
The Gram Positive Bacterial Infection product landscape is dynamic, with ongoing innovation in antibiotic development. New drugs are constantly being developed to combat antibiotic resistance, and advancements in delivery mechanisms (e.g., targeted drug delivery) are improving efficacy and reducing side effects. Many products offer unique selling propositions based on broad-spectrum activity, improved pharmacokinetics, or reduced toxicity. Technological advancements in drug discovery and development are accelerating the pace of innovation.
Key Drivers, Barriers & Challenges in Gram Positive Bacterial Infection Industry
Key Drivers: The increasing prevalence of Gram-positive bacterial infections, particularly antibiotic-resistant strains, is the primary driver. Rising healthcare expenditure and advancements in diagnostic techniques contribute to growth. Government initiatives promoting antibiotic stewardship also play a role.
Challenges: The primary challenge is the growing threat of antibiotic resistance, which necessitates the development of novel antibiotics and improved treatment strategies. Regulatory hurdles and lengthy drug development processes pose significant barriers to market entry. High drug development costs and the potential for generic competition further constrain market growth. Supply chain disruptions can impact drug availability and affordability.
Emerging Opportunities in Gram Positive Bacterial Infection Industry
Emerging opportunities exist in the development of novel antibiotics targeting specific Gram-positive pathogens, the advancement of personalized medicine approaches tailored to individual patient characteristics, and the expansion into underserved markets in developing countries. The use of diagnostic tools to detect infections earlier can lead to improved outcomes.
Growth Accelerators in the Gram Positive Bacterial Infection Industry Industry
Long-term growth will be driven by continued technological advancements in antibiotic development, strategic partnerships between pharmaceutical companies and research institutions, and the increasing awareness of antibiotic resistance among healthcare professionals and the public. Expanding access to healthcare in developing regions will further stimulate market growth.
Key Players Shaping the Gram Positive Bacterial Infection Industry Market
- Sanofi SA
- Cumberland Pharmaceuticals
- Bayer AG
- Cipla Ltd
- Novartis AG
- Merck & Co Inc
- GlaxoSmithKline Plc
- AstraZeneca
- Johnson & Johnson Inc
- Sun Pharmaceutical Industries Ltd
- Bristol-Myers Squibb Company
- Pfizer Inc
Notable Milestones in Gram Positive Bacterial Infection Industry Sector
- September 2022: GSK plc and Spero Therapeutics, Inc. entered an exclusive license agreement for tebipenem HBr, a potential oral carbapenem antibiotic for complicated urinary tract infections.
- September 2022: ImprimisRx launched Fortisite, a compounded combination of Tobramycin and Vancomycin.
In-Depth Gram Positive Bacterial Infection Industry Market Outlook
The future of the Gram Positive Bacterial Infection market holds significant potential for growth, driven by ongoing technological innovation, expansion into emerging markets, and increased focus on antibiotic stewardship. Strategic partnerships and collaborations will play a crucial role in accelerating the development of novel therapies and improving patient outcomes. The continued threat of antibiotic resistance will remain a key challenge, necessitating sustained investment in research and development.
Gram Positive Bacterial Infection Industry Segmentation
-
1. Drug Type
- 1.1. Beta-Lactam Antimicrobials
- 1.2. Fluoroquinolones
- 1.3. Penicillin
- 1.4. Cephalosporins
- 1.5. RNA Immunoprecipitation (RIP)
- 1.6. Vaccine
- 1.7. Others Drugs
-
2. Disease
- 2.1. Pneumonia
- 2.2. Sepsis
- 2.3. Pharyngitis
- 2.4. Methicil
- 2.5. Endocarditis
- 2.6. Meningitis
- 2.7. Other Diseases
-
3. Distribution Channel
- 3.1. Hospital Pharmacies
- 3.2. Retail Pharmacies
- 3.3. Online Pharmacies
Gram Positive Bacterial Infection Industry Segmentation By Geography
-
1. North America
- 1.1. United States
- 1.2. Canada
- 1.3. Mexico
-
2. Europe
- 2.1. Germany
- 2.2. United Kingdom
- 2.3. France
- 2.4. Italy
- 2.5. Spain
- 2.6. Rest of Europe
-
3. Asia Pacific
- 3.1. China
- 3.2. Japan
- 3.3. India
- 3.4. Australia
- 3.5. South Korea
- 3.6. Rest of Asia Pacific
-
4. Middle East and Africa
- 4.1. GCC
- 4.2. South Africa
- 4.3. Rest of Middle East and Africa
-
5. South America
- 5.1. Brazil
- 5.2. Argentina
- 5.3. Rest of South America
Gram Positive Bacterial Infection Industry REPORT HIGHLIGHTS
| Aspects | Details |
|---|---|
| Study Period | 2019-2033 |
| Base Year | 2024 |
| Estimated Year | 2025 |
| Forecast Period | 2025-2033 |
| Historical Period | 2019-2024 |
| Growth Rate | CAGR of 8.00% from 2019-2033 |
| Segmentation |
|
Table of Contents
- 1. Introduction
- 1.1. Research Scope
- 1.2. Market Segmentation
- 1.3. Research Methodology
- 1.4. Definitions and Assumptions
- 2. Executive Summary
- 2.1. Introduction
- 3. Market Dynamics
- 3.1. Introduction
- 3.2. Market Drivers
- 3.2.1. Rising Prevalence of Gram-positive Bacterial Infections; Increasing Number of Drug Approvals
- 3.3. Market Restrains
- 3.3.1. Antibiotic Resistance
- 3.4. Market Trends
- 3.4.1. Cephalosporins Segment is Expected to Witness Significant Growth over the Forecast Period.
- 4. Market Factor Analysis
- 4.1. Porters Five Forces
- 4.2. Supply/Value Chain
- 4.3. PESTEL analysis
- 4.4. Market Entropy
- 4.5. Patent/Trademark Analysis
- 5. Global Gram Positive Bacterial Infection Industry Analysis, Insights and Forecast, 2019-2031
- 5.1. Market Analysis, Insights and Forecast - by Drug Type
- 5.1.1. Beta-Lactam Antimicrobials
- 5.1.2. Fluoroquinolones
- 5.1.3. Penicillin
- 5.1.4. Cephalosporins
- 5.1.5. RNA Immunoprecipitation (RIP)
- 5.1.6. Vaccine
- 5.1.7. Others Drugs
- 5.2. Market Analysis, Insights and Forecast - by Disease
- 5.2.1. Pneumonia
- 5.2.2. Sepsis
- 5.2.3. Pharyngitis
- 5.2.4. Methicil
- 5.2.5. Endocarditis
- 5.2.6. Meningitis
- 5.2.7. Other Diseases
- 5.3. Market Analysis, Insights and Forecast - by Distribution Channel
- 5.3.1. Hospital Pharmacies
- 5.3.2. Retail Pharmacies
- 5.3.3. Online Pharmacies
- 5.4. Market Analysis, Insights and Forecast - by Region
- 5.4.1. North America
- 5.4.2. Europe
- 5.4.3. Asia Pacific
- 5.4.4. Middle East and Africa
- 5.4.5. South America
- 5.1. Market Analysis, Insights and Forecast - by Drug Type
- 6. North America Gram Positive Bacterial Infection Industry Analysis, Insights and Forecast, 2019-2031
- 6.1. Market Analysis, Insights and Forecast - by Drug Type
- 6.1.1. Beta-Lactam Antimicrobials
- 6.1.2. Fluoroquinolones
- 6.1.3. Penicillin
- 6.1.4. Cephalosporins
- 6.1.5. RNA Immunoprecipitation (RIP)
- 6.1.6. Vaccine
- 6.1.7. Others Drugs
- 6.2. Market Analysis, Insights and Forecast - by Disease
- 6.2.1. Pneumonia
- 6.2.2. Sepsis
- 6.2.3. Pharyngitis
- 6.2.4. Methicil
- 6.2.5. Endocarditis
- 6.2.6. Meningitis
- 6.2.7. Other Diseases
- 6.3. Market Analysis, Insights and Forecast - by Distribution Channel
- 6.3.1. Hospital Pharmacies
- 6.3.2. Retail Pharmacies
- 6.3.3. Online Pharmacies
- 6.1. Market Analysis, Insights and Forecast - by Drug Type
- 7. Europe Gram Positive Bacterial Infection Industry Analysis, Insights and Forecast, 2019-2031
- 7.1. Market Analysis, Insights and Forecast - by Drug Type
- 7.1.1. Beta-Lactam Antimicrobials
- 7.1.2. Fluoroquinolones
- 7.1.3. Penicillin
- 7.1.4. Cephalosporins
- 7.1.5. RNA Immunoprecipitation (RIP)
- 7.1.6. Vaccine
- 7.1.7. Others Drugs
- 7.2. Market Analysis, Insights and Forecast - by Disease
- 7.2.1. Pneumonia
- 7.2.2. Sepsis
- 7.2.3. Pharyngitis
- 7.2.4. Methicil
- 7.2.5. Endocarditis
- 7.2.6. Meningitis
- 7.2.7. Other Diseases
- 7.3. Market Analysis, Insights and Forecast - by Distribution Channel
- 7.3.1. Hospital Pharmacies
- 7.3.2. Retail Pharmacies
- 7.3.3. Online Pharmacies
- 7.1. Market Analysis, Insights and Forecast - by Drug Type
- 8. Asia Pacific Gram Positive Bacterial Infection Industry Analysis, Insights and Forecast, 2019-2031
- 8.1. Market Analysis, Insights and Forecast - by Drug Type
- 8.1.1. Beta-Lactam Antimicrobials
- 8.1.2. Fluoroquinolones
- 8.1.3. Penicillin
- 8.1.4. Cephalosporins
- 8.1.5. RNA Immunoprecipitation (RIP)
- 8.1.6. Vaccine
- 8.1.7. Others Drugs
- 8.2. Market Analysis, Insights and Forecast - by Disease
- 8.2.1. Pneumonia
- 8.2.2. Sepsis
- 8.2.3. Pharyngitis
- 8.2.4. Methicil
- 8.2.5. Endocarditis
- 8.2.6. Meningitis
- 8.2.7. Other Diseases
- 8.3. Market Analysis, Insights and Forecast - by Distribution Channel
- 8.3.1. Hospital Pharmacies
- 8.3.2. Retail Pharmacies
- 8.3.3. Online Pharmacies
- 8.1. Market Analysis, Insights and Forecast - by Drug Type
- 9. Middle East and Africa Gram Positive Bacterial Infection Industry Analysis, Insights and Forecast, 2019-2031
- 9.1. Market Analysis, Insights and Forecast - by Drug Type
- 9.1.1. Beta-Lactam Antimicrobials
- 9.1.2. Fluoroquinolones
- 9.1.3. Penicillin
- 9.1.4. Cephalosporins
- 9.1.5. RNA Immunoprecipitation (RIP)
- 9.1.6. Vaccine
- 9.1.7. Others Drugs
- 9.2. Market Analysis, Insights and Forecast - by Disease
- 9.2.1. Pneumonia
- 9.2.2. Sepsis
- 9.2.3. Pharyngitis
- 9.2.4. Methicil
- 9.2.5. Endocarditis
- 9.2.6. Meningitis
- 9.2.7. Other Diseases
- 9.3. Market Analysis, Insights and Forecast - by Distribution Channel
- 9.3.1. Hospital Pharmacies
- 9.3.2. Retail Pharmacies
- 9.3.3. Online Pharmacies
- 9.1. Market Analysis, Insights and Forecast - by Drug Type
- 10. South America Gram Positive Bacterial Infection Industry Analysis, Insights and Forecast, 2019-2031
- 10.1. Market Analysis, Insights and Forecast - by Drug Type
- 10.1.1. Beta-Lactam Antimicrobials
- 10.1.2. Fluoroquinolones
- 10.1.3. Penicillin
- 10.1.4. Cephalosporins
- 10.1.5. RNA Immunoprecipitation (RIP)
- 10.1.6. Vaccine
- 10.1.7. Others Drugs
- 10.2. Market Analysis, Insights and Forecast - by Disease
- 10.2.1. Pneumonia
- 10.2.2. Sepsis
- 10.2.3. Pharyngitis
- 10.2.4. Methicil
- 10.2.5. Endocarditis
- 10.2.6. Meningitis
- 10.2.7. Other Diseases
- 10.3. Market Analysis, Insights and Forecast - by Distribution Channel
- 10.3.1. Hospital Pharmacies
- 10.3.2. Retail Pharmacies
- 10.3.3. Online Pharmacies
- 10.1. Market Analysis, Insights and Forecast - by Drug Type
- 11. North America Gram Positive Bacterial Infection Industry Analysis, Insights and Forecast, 2019-2031
- 11.1. Market Analysis, Insights and Forecast - By Country/Sub-region
- 11.1.1 United States
- 11.1.2 Canada
- 11.1.3 Mexico
- 12. Europe Gram Positive Bacterial Infection Industry Analysis, Insights and Forecast, 2019-2031
- 12.1. Market Analysis, Insights and Forecast - By Country/Sub-region
- 12.1.1 Germany
- 12.1.2 United Kingdom
- 12.1.3 France
- 12.1.4 Italy
- 12.1.5 Spain
- 12.1.6 Rest of Europe
- 13. Asia Pacific Gram Positive Bacterial Infection Industry Analysis, Insights and Forecast, 2019-2031
- 13.1. Market Analysis, Insights and Forecast - By Country/Sub-region
- 13.1.1 China
- 13.1.2 Japan
- 13.1.3 India
- 13.1.4 Australia
- 13.1.5 South Korea
- 13.1.6 Rest of Asia Pacific
- 14. Middle East and Africa Gram Positive Bacterial Infection Industry Analysis, Insights and Forecast, 2019-2031
- 14.1. Market Analysis, Insights and Forecast - By Country/Sub-region
- 14.1.1 GCC
- 14.1.2 South Africa
- 14.1.3 Rest of Middle East and Africa
- 15. South America Gram Positive Bacterial Infection Industry Analysis, Insights and Forecast, 2019-2031
- 15.1. Market Analysis, Insights and Forecast - By Country/Sub-region
- 15.1.1 Brazil
- 15.1.2 Argentina
- 15.1.3 Rest of South America
- 16. Competitive Analysis
- 16.1. Global Market Share Analysis 2024
- 16.2. Company Profiles
- 16.2.1 Sanofi SA
- 16.2.1.1. Overview
- 16.2.1.2. Products
- 16.2.1.3. SWOT Analysis
- 16.2.1.4. Recent Developments
- 16.2.1.5. Financials (Based on Availability)
- 16.2.2 Cumberland Pharmaceuticals
- 16.2.2.1. Overview
- 16.2.2.2. Products
- 16.2.2.3. SWOT Analysis
- 16.2.2.4. Recent Developments
- 16.2.2.5. Financials (Based on Availability)
- 16.2.3 Bayer AG
- 16.2.3.1. Overview
- 16.2.3.2. Products
- 16.2.3.3. SWOT Analysis
- 16.2.3.4. Recent Developments
- 16.2.3.5. Financials (Based on Availability)
- 16.2.4 Cipla Ltd
- 16.2.4.1. Overview
- 16.2.4.2. Products
- 16.2.4.3. SWOT Analysis
- 16.2.4.4. Recent Developments
- 16.2.4.5. Financials (Based on Availability)
- 16.2.5 Novartis AG
- 16.2.5.1. Overview
- 16.2.5.2. Products
- 16.2.5.3. SWOT Analysis
- 16.2.5.4. Recent Developments
- 16.2.5.5. Financials (Based on Availability)
- 16.2.6 Merck & Co Inc
- 16.2.6.1. Overview
- 16.2.6.2. Products
- 16.2.6.3. SWOT Analysis
- 16.2.6.4. Recent Developments
- 16.2.6.5. Financials (Based on Availability)
- 16.2.7 GlaxoSmithKline Plc
- 16.2.7.1. Overview
- 16.2.7.2. Products
- 16.2.7.3. SWOT Analysis
- 16.2.7.4. Recent Developments
- 16.2.7.5. Financials (Based on Availability)
- 16.2.8 AstraZeneca
- 16.2.8.1. Overview
- 16.2.8.2. Products
- 16.2.8.3. SWOT Analysis
- 16.2.8.4. Recent Developments
- 16.2.8.5. Financials (Based on Availability)
- 16.2.9 Johnson & Johnson Inc
- 16.2.9.1. Overview
- 16.2.9.2. Products
- 16.2.9.3. SWOT Analysis
- 16.2.9.4. Recent Developments
- 16.2.9.5. Financials (Based on Availability)
- 16.2.10 Sun Pharmaceutical Industries Ltd
- 16.2.10.1. Overview
- 16.2.10.2. Products
- 16.2.10.3. SWOT Analysis
- 16.2.10.4. Recent Developments
- 16.2.10.5. Financials (Based on Availability)
- 16.2.11 Bristol-Myers Squibb Company*List Not Exhaustive
- 16.2.11.1. Overview
- 16.2.11.2. Products
- 16.2.11.3. SWOT Analysis
- 16.2.11.4. Recent Developments
- 16.2.11.5. Financials (Based on Availability)
- 16.2.12 Pfizer Inc
- 16.2.12.1. Overview
- 16.2.12.2. Products
- 16.2.12.3. SWOT Analysis
- 16.2.12.4. Recent Developments
- 16.2.12.5. Financials (Based on Availability)
- 16.2.1 Sanofi SA
List of Figures
- Figure 1: Global Gram Positive Bacterial Infection Industry Revenue Breakdown (Million, %) by Region 2024 & 2032
- Figure 2: North America Gram Positive Bacterial Infection Industry Revenue (Million), by Country 2024 & 2032
- Figure 3: North America Gram Positive Bacterial Infection Industry Revenue Share (%), by Country 2024 & 2032
- Figure 4: Europe Gram Positive Bacterial Infection Industry Revenue (Million), by Country 2024 & 2032
- Figure 5: Europe Gram Positive Bacterial Infection Industry Revenue Share (%), by Country 2024 & 2032
- Figure 6: Asia Pacific Gram Positive Bacterial Infection Industry Revenue (Million), by Country 2024 & 2032
- Figure 7: Asia Pacific Gram Positive Bacterial Infection Industry Revenue Share (%), by Country 2024 & 2032
- Figure 8: Middle East and Africa Gram Positive Bacterial Infection Industry Revenue (Million), by Country 2024 & 2032
- Figure 9: Middle East and Africa Gram Positive Bacterial Infection Industry Revenue Share (%), by Country 2024 & 2032
- Figure 10: South America Gram Positive Bacterial Infection Industry Revenue (Million), by Country 2024 & 2032
- Figure 11: South America Gram Positive Bacterial Infection Industry Revenue Share (%), by Country 2024 & 2032
- Figure 12: North America Gram Positive Bacterial Infection Industry Revenue (Million), by Drug Type 2024 & 2032
- Figure 13: North America Gram Positive Bacterial Infection Industry Revenue Share (%), by Drug Type 2024 & 2032
- Figure 14: North America Gram Positive Bacterial Infection Industry Revenue (Million), by Disease 2024 & 2032
- Figure 15: North America Gram Positive Bacterial Infection Industry Revenue Share (%), by Disease 2024 & 2032
- Figure 16: North America Gram Positive Bacterial Infection Industry Revenue (Million), by Distribution Channel 2024 & 2032
- Figure 17: North America Gram Positive Bacterial Infection Industry Revenue Share (%), by Distribution Channel 2024 & 2032
- Figure 18: North America Gram Positive Bacterial Infection Industry Revenue (Million), by Country 2024 & 2032
- Figure 19: North America Gram Positive Bacterial Infection Industry Revenue Share (%), by Country 2024 & 2032
- Figure 20: Europe Gram Positive Bacterial Infection Industry Revenue (Million), by Drug Type 2024 & 2032
- Figure 21: Europe Gram Positive Bacterial Infection Industry Revenue Share (%), by Drug Type 2024 & 2032
- Figure 22: Europe Gram Positive Bacterial Infection Industry Revenue (Million), by Disease 2024 & 2032
- Figure 23: Europe Gram Positive Bacterial Infection Industry Revenue Share (%), by Disease 2024 & 2032
- Figure 24: Europe Gram Positive Bacterial Infection Industry Revenue (Million), by Distribution Channel 2024 & 2032
- Figure 25: Europe Gram Positive Bacterial Infection Industry Revenue Share (%), by Distribution Channel 2024 & 2032
- Figure 26: Europe Gram Positive Bacterial Infection Industry Revenue (Million), by Country 2024 & 2032
- Figure 27: Europe Gram Positive Bacterial Infection Industry Revenue Share (%), by Country 2024 & 2032
- Figure 28: Asia Pacific Gram Positive Bacterial Infection Industry Revenue (Million), by Drug Type 2024 & 2032
- Figure 29: Asia Pacific Gram Positive Bacterial Infection Industry Revenue Share (%), by Drug Type 2024 & 2032
- Figure 30: Asia Pacific Gram Positive Bacterial Infection Industry Revenue (Million), by Disease 2024 & 2032
- Figure 31: Asia Pacific Gram Positive Bacterial Infection Industry Revenue Share (%), by Disease 2024 & 2032
- Figure 32: Asia Pacific Gram Positive Bacterial Infection Industry Revenue (Million), by Distribution Channel 2024 & 2032
- Figure 33: Asia Pacific Gram Positive Bacterial Infection Industry Revenue Share (%), by Distribution Channel 2024 & 2032
- Figure 34: Asia Pacific Gram Positive Bacterial Infection Industry Revenue (Million), by Country 2024 & 2032
- Figure 35: Asia Pacific Gram Positive Bacterial Infection Industry Revenue Share (%), by Country 2024 & 2032
- Figure 36: Middle East and Africa Gram Positive Bacterial Infection Industry Revenue (Million), by Drug Type 2024 & 2032
- Figure 37: Middle East and Africa Gram Positive Bacterial Infection Industry Revenue Share (%), by Drug Type 2024 & 2032
- Figure 38: Middle East and Africa Gram Positive Bacterial Infection Industry Revenue (Million), by Disease 2024 & 2032
- Figure 39: Middle East and Africa Gram Positive Bacterial Infection Industry Revenue Share (%), by Disease 2024 & 2032
- Figure 40: Middle East and Africa Gram Positive Bacterial Infection Industry Revenue (Million), by Distribution Channel 2024 & 2032
- Figure 41: Middle East and Africa Gram Positive Bacterial Infection Industry Revenue Share (%), by Distribution Channel 2024 & 2032
- Figure 42: Middle East and Africa Gram Positive Bacterial Infection Industry Revenue (Million), by Country 2024 & 2032
- Figure 43: Middle East and Africa Gram Positive Bacterial Infection Industry Revenue Share (%), by Country 2024 & 2032
- Figure 44: South America Gram Positive Bacterial Infection Industry Revenue (Million), by Drug Type 2024 & 2032
- Figure 45: South America Gram Positive Bacterial Infection Industry Revenue Share (%), by Drug Type 2024 & 2032
- Figure 46: South America Gram Positive Bacterial Infection Industry Revenue (Million), by Disease 2024 & 2032
- Figure 47: South America Gram Positive Bacterial Infection Industry Revenue Share (%), by Disease 2024 & 2032
- Figure 48: South America Gram Positive Bacterial Infection Industry Revenue (Million), by Distribution Channel 2024 & 2032
- Figure 49: South America Gram Positive Bacterial Infection Industry Revenue Share (%), by Distribution Channel 2024 & 2032
- Figure 50: South America Gram Positive Bacterial Infection Industry Revenue (Million), by Country 2024 & 2032
- Figure 51: South America Gram Positive Bacterial Infection Industry Revenue Share (%), by Country 2024 & 2032
List of Tables
- Table 1: Global Gram Positive Bacterial Infection Industry Revenue Million Forecast, by Region 2019 & 2032
- Table 2: Global Gram Positive Bacterial Infection Industry Revenue Million Forecast, by Drug Type 2019 & 2032
- Table 3: Global Gram Positive Bacterial Infection Industry Revenue Million Forecast, by Disease 2019 & 2032
- Table 4: Global Gram Positive Bacterial Infection Industry Revenue Million Forecast, by Distribution Channel 2019 & 2032
- Table 5: Global Gram Positive Bacterial Infection Industry Revenue Million Forecast, by Region 2019 & 2032
- Table 6: Global Gram Positive Bacterial Infection Industry Revenue Million Forecast, by Country 2019 & 2032
- Table 7: United States Gram Positive Bacterial Infection Industry Revenue (Million) Forecast, by Application 2019 & 2032
- Table 8: Canada Gram Positive Bacterial Infection Industry Revenue (Million) Forecast, by Application 2019 & 2032
- Table 9: Mexico Gram Positive Bacterial Infection Industry Revenue (Million) Forecast, by Application 2019 & 2032
- Table 10: Global Gram Positive Bacterial Infection Industry Revenue Million Forecast, by Country 2019 & 2032
- Table 11: Germany Gram Positive Bacterial Infection Industry Revenue (Million) Forecast, by Application 2019 & 2032
- Table 12: United Kingdom Gram Positive Bacterial Infection Industry Revenue (Million) Forecast, by Application 2019 & 2032
- Table 13: France Gram Positive Bacterial Infection Industry Revenue (Million) Forecast, by Application 2019 & 2032
- Table 14: Italy Gram Positive Bacterial Infection Industry Revenue (Million) Forecast, by Application 2019 & 2032
- Table 15: Spain Gram Positive Bacterial Infection Industry Revenue (Million) Forecast, by Application 2019 & 2032
- Table 16: Rest of Europe Gram Positive Bacterial Infection Industry Revenue (Million) Forecast, by Application 2019 & 2032
- Table 17: Global Gram Positive Bacterial Infection Industry Revenue Million Forecast, by Country 2019 & 2032
- Table 18: China Gram Positive Bacterial Infection Industry Revenue (Million) Forecast, by Application 2019 & 2032
- Table 19: Japan Gram Positive Bacterial Infection Industry Revenue (Million) Forecast, by Application 2019 & 2032
- Table 20: India Gram Positive Bacterial Infection Industry Revenue (Million) Forecast, by Application 2019 & 2032
- Table 21: Australia Gram Positive Bacterial Infection Industry Revenue (Million) Forecast, by Application 2019 & 2032
- Table 22: South Korea Gram Positive Bacterial Infection Industry Revenue (Million) Forecast, by Application 2019 & 2032
- Table 23: Rest of Asia Pacific Gram Positive Bacterial Infection Industry Revenue (Million) Forecast, by Application 2019 & 2032
- Table 24: Global Gram Positive Bacterial Infection Industry Revenue Million Forecast, by Country 2019 & 2032
- Table 25: GCC Gram Positive Bacterial Infection Industry Revenue (Million) Forecast, by Application 2019 & 2032
- Table 26: South Africa Gram Positive Bacterial Infection Industry Revenue (Million) Forecast, by Application 2019 & 2032
- Table 27: Rest of Middle East and Africa Gram Positive Bacterial Infection Industry Revenue (Million) Forecast, by Application 2019 & 2032
- Table 28: Global Gram Positive Bacterial Infection Industry Revenue Million Forecast, by Country 2019 & 2032
- Table 29: Brazil Gram Positive Bacterial Infection Industry Revenue (Million) Forecast, by Application 2019 & 2032
- Table 30: Argentina Gram Positive Bacterial Infection Industry Revenue (Million) Forecast, by Application 2019 & 2032
- Table 31: Rest of South America Gram Positive Bacterial Infection Industry Revenue (Million) Forecast, by Application 2019 & 2032
- Table 32: Global Gram Positive Bacterial Infection Industry Revenue Million Forecast, by Drug Type 2019 & 2032
- Table 33: Global Gram Positive Bacterial Infection Industry Revenue Million Forecast, by Disease 2019 & 2032
- Table 34: Global Gram Positive Bacterial Infection Industry Revenue Million Forecast, by Distribution Channel 2019 & 2032
- Table 35: Global Gram Positive Bacterial Infection Industry Revenue Million Forecast, by Country 2019 & 2032
- Table 36: United States Gram Positive Bacterial Infection Industry Revenue (Million) Forecast, by Application 2019 & 2032
- Table 37: Canada Gram Positive Bacterial Infection Industry Revenue (Million) Forecast, by Application 2019 & 2032
- Table 38: Mexico Gram Positive Bacterial Infection Industry Revenue (Million) Forecast, by Application 2019 & 2032
- Table 39: Global Gram Positive Bacterial Infection Industry Revenue Million Forecast, by Drug Type 2019 & 2032
- Table 40: Global Gram Positive Bacterial Infection Industry Revenue Million Forecast, by Disease 2019 & 2032
- Table 41: Global Gram Positive Bacterial Infection Industry Revenue Million Forecast, by Distribution Channel 2019 & 2032
- Table 42: Global Gram Positive Bacterial Infection Industry Revenue Million Forecast, by Country 2019 & 2032
- Table 43: Germany Gram Positive Bacterial Infection Industry Revenue (Million) Forecast, by Application 2019 & 2032
- Table 44: United Kingdom Gram Positive Bacterial Infection Industry Revenue (Million) Forecast, by Application 2019 & 2032
- Table 45: France Gram Positive Bacterial Infection Industry Revenue (Million) Forecast, by Application 2019 & 2032
- Table 46: Italy Gram Positive Bacterial Infection Industry Revenue (Million) Forecast, by Application 2019 & 2032
- Table 47: Spain Gram Positive Bacterial Infection Industry Revenue (Million) Forecast, by Application 2019 & 2032
- Table 48: Rest of Europe Gram Positive Bacterial Infection Industry Revenue (Million) Forecast, by Application 2019 & 2032
- Table 49: Global Gram Positive Bacterial Infection Industry Revenue Million Forecast, by Drug Type 2019 & 2032
- Table 50: Global Gram Positive Bacterial Infection Industry Revenue Million Forecast, by Disease 2019 & 2032
- Table 51: Global Gram Positive Bacterial Infection Industry Revenue Million Forecast, by Distribution Channel 2019 & 2032
- Table 52: Global Gram Positive Bacterial Infection Industry Revenue Million Forecast, by Country 2019 & 2032
- Table 53: China Gram Positive Bacterial Infection Industry Revenue (Million) Forecast, by Application 2019 & 2032
- Table 54: Japan Gram Positive Bacterial Infection Industry Revenue (Million) Forecast, by Application 2019 & 2032
- Table 55: India Gram Positive Bacterial Infection Industry Revenue (Million) Forecast, by Application 2019 & 2032
- Table 56: Australia Gram Positive Bacterial Infection Industry Revenue (Million) Forecast, by Application 2019 & 2032
- Table 57: South Korea Gram Positive Bacterial Infection Industry Revenue (Million) Forecast, by Application 2019 & 2032
- Table 58: Rest of Asia Pacific Gram Positive Bacterial Infection Industry Revenue (Million) Forecast, by Application 2019 & 2032
- Table 59: Global Gram Positive Bacterial Infection Industry Revenue Million Forecast, by Drug Type 2019 & 2032
- Table 60: Global Gram Positive Bacterial Infection Industry Revenue Million Forecast, by Disease 2019 & 2032
- Table 61: Global Gram Positive Bacterial Infection Industry Revenue Million Forecast, by Distribution Channel 2019 & 2032
- Table 62: Global Gram Positive Bacterial Infection Industry Revenue Million Forecast, by Country 2019 & 2032
- Table 63: GCC Gram Positive Bacterial Infection Industry Revenue (Million) Forecast, by Application 2019 & 2032
- Table 64: South Africa Gram Positive Bacterial Infection Industry Revenue (Million) Forecast, by Application 2019 & 2032
- Table 65: Rest of Middle East and Africa Gram Positive Bacterial Infection Industry Revenue (Million) Forecast, by Application 2019 & 2032
- Table 66: Global Gram Positive Bacterial Infection Industry Revenue Million Forecast, by Drug Type 2019 & 2032
- Table 67: Global Gram Positive Bacterial Infection Industry Revenue Million Forecast, by Disease 2019 & 2032
- Table 68: Global Gram Positive Bacterial Infection Industry Revenue Million Forecast, by Distribution Channel 2019 & 2032
- Table 69: Global Gram Positive Bacterial Infection Industry Revenue Million Forecast, by Country 2019 & 2032
- Table 70: Brazil Gram Positive Bacterial Infection Industry Revenue (Million) Forecast, by Application 2019 & 2032
- Table 71: Argentina Gram Positive Bacterial Infection Industry Revenue (Million) Forecast, by Application 2019 & 2032
- Table 72: Rest of South America Gram Positive Bacterial Infection Industry Revenue (Million) Forecast, by Application 2019 & 2032
Frequently Asked Questions
1. What is the projected Compound Annual Growth Rate (CAGR) of the Gram Positive Bacterial Infection Industry?
The projected CAGR is approximately 8.00%.
2. Which companies are prominent players in the Gram Positive Bacterial Infection Industry?
Key companies in the market include Sanofi SA, Cumberland Pharmaceuticals, Bayer AG, Cipla Ltd, Novartis AG, Merck & Co Inc, GlaxoSmithKline Plc, AstraZeneca, Johnson & Johnson Inc, Sun Pharmaceutical Industries Ltd, Bristol-Myers Squibb Company*List Not Exhaustive, Pfizer Inc.
3. What are the main segments of the Gram Positive Bacterial Infection Industry?
The market segments include Drug Type, Disease, Distribution Channel.
4. Can you provide details about the market size?
The market size is estimated to be USD XX Million as of 2022.
5. What are some drivers contributing to market growth?
Rising Prevalence of Gram-positive Bacterial Infections; Increasing Number of Drug Approvals.
6. What are the notable trends driving market growth?
Cephalosporins Segment is Expected to Witness Significant Growth over the Forecast Period..
7. Are there any restraints impacting market growth?
Antibiotic Resistance.
8. Can you provide examples of recent developments in the market?
September 2022: GSK plc and Spero Therapeutics, Inc. received an exclusive license agreement for tebipenem pivoxil hydrobromide (tebipenem HBr), a late-stage antibiotic being developed by Spero, as the oral carbapenem antibiotic to potentially treat complicated urinary tract infections (cUTI), including pyelonephritis, caused by certain bacteria.
9. What pricing options are available for accessing the report?
Pricing options include single-user, multi-user, and enterprise licenses priced at USD 4750, USD 5250, and USD 8750 respectively.
10. Is the market size provided in terms of value or volume?
The market size is provided in terms of value, measured in Million.
11. Are there any specific market keywords associated with the report?
Yes, the market keyword associated with the report is "Gram Positive Bacterial Infection Industry," which aids in identifying and referencing the specific market segment covered.
12. How do I determine which pricing option suits my needs best?
The pricing options vary based on user requirements and access needs. Individual users may opt for single-user licenses, while businesses requiring broader access may choose multi-user or enterprise licenses for cost-effective access to the report.
13. Are there any additional resources or data provided in the Gram Positive Bacterial Infection Industry report?
While the report offers comprehensive insights, it's advisable to review the specific contents or supplementary materials provided to ascertain if additional resources or data are available.
14. How can I stay updated on further developments or reports in the Gram Positive Bacterial Infection Industry?
To stay informed about further developments, trends, and reports in the Gram Positive Bacterial Infection Industry, consider subscribing to industry newsletters, following relevant companies and organizations, or regularly checking reputable industry news sources and publications.
Methodology
Step 1 - Identification of Relevant Samples Size from Population Database


Step 2 - Approaches for Defining Global Market Size (Value, Volume* & Price*)

Note*: In applicable scenarios
Step 3 - Data Sources
Primary Research
- Web Analytics
- Survey Reports
- Research Institute
- Latest Research Reports
- Opinion Leaders
Secondary Research
- Annual Reports
- White Paper
- Latest Press Release
- Industry Association
- Paid Database
- Investor Presentations

Step 4 - Data Triangulation
Involves using different sources of information in order to increase the validity of a study
These sources are likely to be stakeholders in a program - participants, other researchers, program staff, other community members, and so on.
Then we put all data in single framework & apply various statistical tools to find out the dynamic on the market.
During the analysis stage, feedback from the stakeholder groups would be compared to determine areas of agreement as well as areas of divergence
