

Key Insights
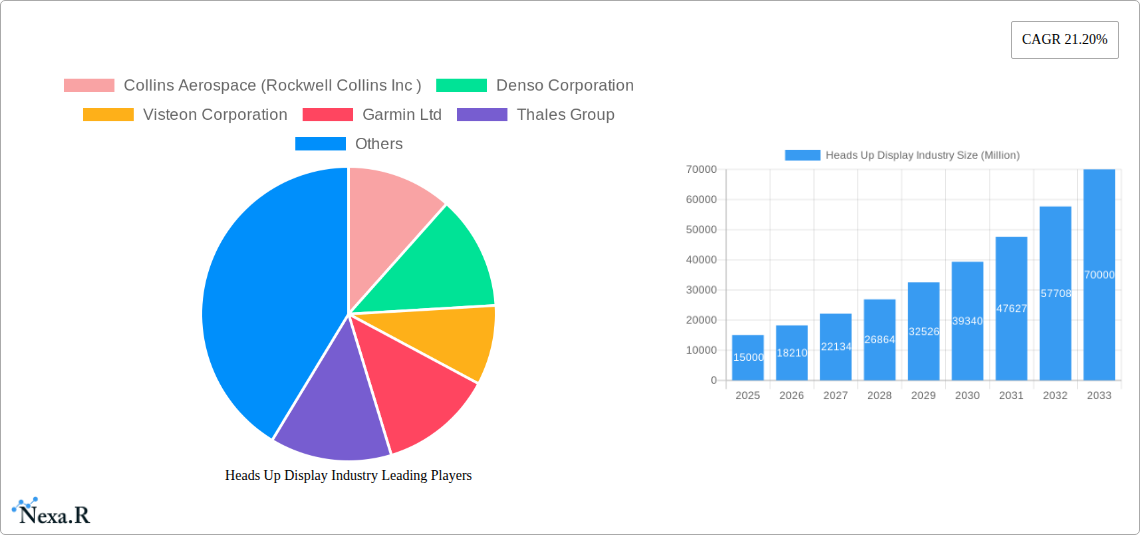
The Heads-Up Display (HUD) market is experiencing robust growth, driven by increasing demand for enhanced driver assistance systems and safety features in the automotive sector. The market's Compound Annual Growth Rate (CAGR) of 21.20% from 2019-2033 indicates a significant expansion, with the market size expected to reach substantial figures by 2033. This growth is fueled by several key factors, including the rising adoption of advanced driver-assistance systems (ADAS) in vehicles, the increasing integration of augmented reality (AR) features in HUDs, and the growing preference for improved driver experience and safety. The automotive segment currently dominates the market, followed by the military and civil aviation industries. Technological advancements, such as the development of more compact and energy-efficient HUDs, are further contributing to market expansion. The increasing popularity of combiner-based HUDs, offering a superior viewing experience, and the integration of AR capabilities, providing real-time information overlays, are major drivers.
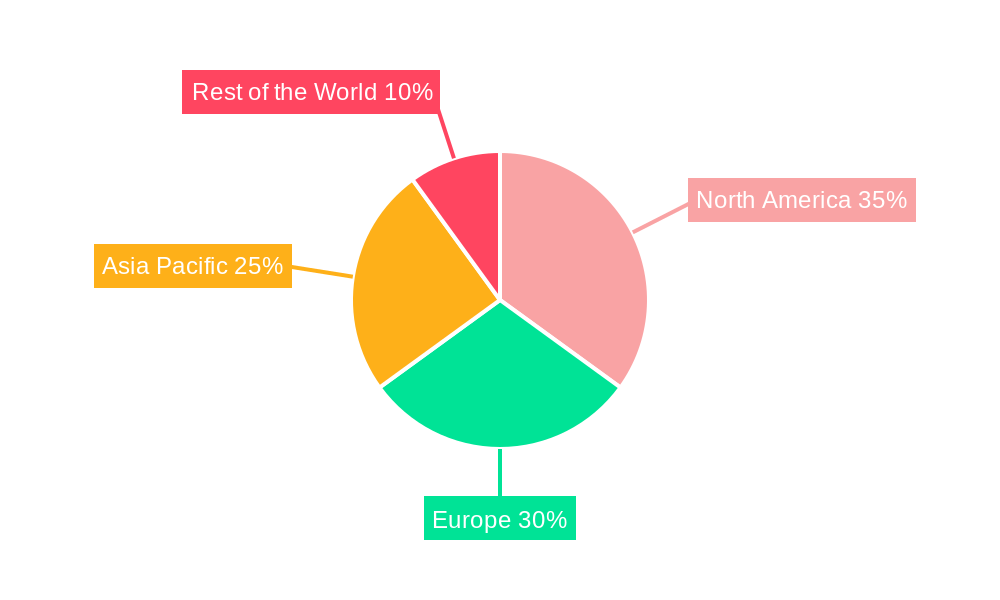
However, certain restraints are impacting market growth, including the high initial investment cost associated with HUD technology and the complexities involved in integrating HUD systems with existing vehicle infrastructure. Nevertheless, the ongoing technological advancements, coupled with the growing demand for safety and convenience features, are projected to overcome these challenges. The market segmentation by type (windshield-based, combiner-based, AR-based) and application (automotive, aviation, others) presents diverse growth opportunities for manufacturers. Key players like Collins Aerospace, Denso, Visteon, and Garmin are actively involved in developing innovative HUD technologies and expanding their market presence through strategic partnerships and collaborations, driving further market penetration. The Asia-Pacific region is expected to witness substantial growth owing to the burgeoning automotive sector and rising disposable incomes in developing countries. North America and Europe also retain strong market shares due to advanced automotive technologies and stringent safety regulations.
Heads Up Display (HUD) Industry Market Report: 2019-2033
This comprehensive report provides an in-depth analysis of the Heads Up Display (HUD) industry, encompassing market dynamics, growth trends, regional performance, and key players. The report covers the period from 2019 to 2033, with a focus on the forecast period of 2025-2033 and a base year of 2025. The study delves into the parent market of automotive and aviation technology and its child markets, offering invaluable insights for industry professionals, investors, and stakeholders.
Heads Up Display Industry Market Dynamics & Structure
The HUD market is characterized by moderate concentration, with several key players holding significant market share. Technological innovation, driven by advancements in augmented reality (AR) and improved display technologies, is a major growth catalyst. Stringent safety regulations in automotive and aviation sectors heavily influence market dynamics, while competitive pressures from alternative display solutions exist. End-user demographics are shifting towards a preference for enhanced driver assistance and improved pilot situational awareness. M&A activity has been moderate, with strategic acquisitions aiming to consolidate market positions and expand technological capabilities.
- Market Concentration: Moderately concentrated, with the top 5 players holding approximately xx% of the market share in 2024.
- Technological Innovation: AR-HUD and improved image projection systems are major innovation drivers.
- Regulatory Landscape: Stringent safety regulations in automotive and aviation sectors are crucial.
- Competitive Substitutes: Traditional instrument panels and other in-cabin display systems.
- End-User Demographics: Growing demand from automotive and aviation sectors.
- M&A Activity: xx major M&A deals recorded in the last five years.
Heads Up Display Industry Growth Trends & Insights
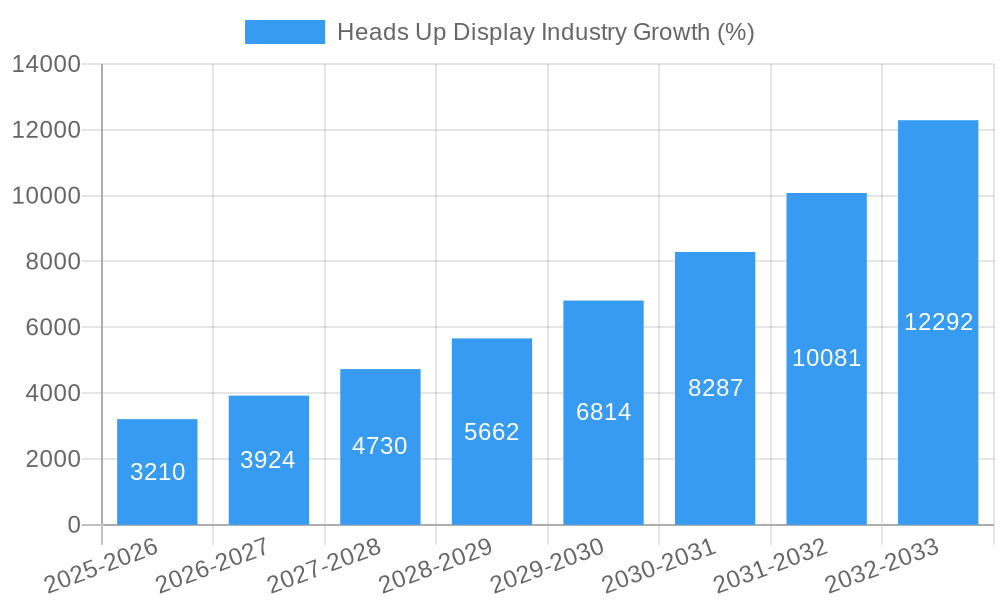
The HUD market exhibits robust growth, driven by increasing demand for advanced driver-assistance systems (ADAS) in the automotive sector and enhanced situational awareness in aviation. The market size is projected to reach xx million units by 2033, exhibiting a CAGR of xx% during the forecast period. This growth is fueled by technological advancements such as AR-HUD, which offers improved visualization and information overlay. Consumer behavior shifts toward premium vehicle features and safety enhancements further contribute to the market's expansion. Increased adoption rates are observed in developed regions, followed by developing economies. Technological disruptions, specifically the integration of AI and machine learning, will further boost market penetration.
Dominant Regions, Countries, or Segments in Heads Up Display Industry
North America and Europe currently dominate the HUD market, owing to higher vehicle penetration, stringent safety regulations, and early adoption of advanced technologies. However, Asia Pacific is projected to witness the highest growth rate due to burgeoning automotive production and rising disposable incomes. Within segments, the automotive application currently holds the largest market share, followed by the military and civil aviation industry. AR-based HUDs are gaining traction, driven by their superior visualization capabilities.
- Automotive: Largest segment by application, expected to reach xx million units by 2033.
- AR-Based HUD: Fastest-growing type, driven by superior visualization and information overlay.
- North America: Highest market share due to high vehicle penetration and technological advancements.
- Asia Pacific: Fastest-growing region due to rapid automotive production and increasing disposable income.
Heads Up Display Industry Product Landscape
HUD products are constantly evolving, with advancements in display technology, image projection, and augmented reality features. Windshield-based and combiner-based HUDs are established technologies while AR-HUD is gaining significant traction due to its ability to overlay information onto the driver's real-world view. Key performance metrics include field of view, brightness, resolution, and overall clarity. The unique selling propositions often center around enhanced safety, driver convenience, and immersive user experience. Miniaturization and cost reduction are ongoing improvements.
Key Drivers, Barriers & Challenges in Heads Up Display Industry
Key Drivers:
- Growing demand for enhanced safety features in vehicles and aircraft.
- Advancements in AR and display technologies.
- Increasing adoption of ADAS in the automotive sector.
Key Challenges and Restraints:
- High initial costs associated with AR-HUD implementation.
- Potential for driver distraction if not properly designed.
- Supply chain disruptions impacting production and availability.
Emerging Opportunities in Heads Up Display Industry
- Expansion into emerging markets with growing automotive sectors.
- Development of HUDs for non-automotive applications (e.g., medical, industrial).
- Integration of AI and machine learning for enhanced driver/pilot assistance.
Growth Accelerators in the Heads Up Display Industry
Technological advancements, strategic partnerships between automotive OEMs and HUD manufacturers, and government initiatives promoting ADAS adoption are accelerating market growth. Expansion into new applications beyond automotive and aviation is also a significant driver. The increasing demand for immersive and intuitive user experiences is further driving innovation.
Key Players Shaping the Heads Up Display Industry Market
- Collins Aerospace (Rockwell Collins Inc)
- Denso Corporation
- Visteon Corporation
- Garmin Ltd
- Thales Group
- BAE Systems PLC
- Nippon Seiki Co Ltd
- Elbit Systems
- Continental AG
- HUDWAY LLC
- Panasonic Automotive Systems (Panasonic Corporation)
- Saab AB
- Pioneer Corporation
Notable Milestones in Heads Up Display Industry Sector
- June 2021: Hyundai Mobis launches a clusterless HUD for gas and electric vehicles.
- September 2021: Airbus partners with Collins Aerospace to develop an enhanced flight vision system (EFVS) incorporating HUD technology.
- January 2022: CY Vision announces automotive 3D Augmented Reality Head-Up Displays (3D AR-HUD) with a wide field of view.
In-Depth Heads Up Display Industry Market Outlook
The HUD market presents significant growth potential, driven by continuous technological advancements and the increasing demand for enhanced safety and driver assistance features. Strategic partnerships and investments in R&D will be crucial for companies to capture market share. Focus on cost reduction and expanding into new applications, along with addressing challenges related to driver distraction and supply chain disruptions, will be critical for sustained long-term growth.
Heads Up Display Industry Segmentation
-
1. Type
- 1.1. Windshield-Based Head-Up Display
- 1.2. Combiner-Based Head-Up Display
- 1.3. AR-Based Head-Up Display
-
2. Application
- 2.1. Automotive
- 2.2. Military and Civil Aviation Industry
- 2.3. Other Applications
Heads Up Display Industry Segmentation By Geography
-
1. North America
- 1.1. United States
- 1.2. Canada
-
2. Europe
- 2.1. United Kingdom
- 2.2. Germany
- 2.3. France
- 2.4. Rest of Europe
-
3. Asia Pacific
- 3.1. China
- 3.2. Japan
- 3.3. South Korea
- 3.4. Australia
- 3.5. Rest of Asia Pacific
- 4. Rest of the World
Heads Up Display Industry REPORT HIGHLIGHTS
| Aspects | Details |
|---|---|
| Study Period | 2019-2033 |
| Base Year | 2024 |
| Estimated Year | 2025 |
| Forecast Period | 2025-2033 |
| Historical Period | 2019-2024 |
| Growth Rate | CAGR of 21.20% from 2019-2033 |
| Segmentation |
|
Table of Contents
- 1. Introduction
- 1.1. Research Scope
- 1.2. Market Segmentation
- 1.3. Research Methodology
- 1.4. Definitions and Assumptions
- 2. Executive Summary
- 2.1. Introduction
- 3. Market Dynamics
- 3.1. Introduction
- 3.2. Market Drivers
- 3.2.1. Technological Advancements of HUD; Growing Awareness About Passenger and Vehicle Safety
- 3.3. Market Restrains
- 3.3.1. Lack of International Accepted Standards
- 3.4. Market Trends
- 3.4.1. Growing Adoption of HUD in Automotive Industry Driving the Market's Growth
- 4. Market Factor Analysis
- 4.1. Porters Five Forces
- 4.2. Supply/Value Chain
- 4.3. PESTEL analysis
- 4.4. Market Entropy
- 4.5. Patent/Trademark Analysis
- 5. Global Heads Up Display Industry Analysis, Insights and Forecast, 2019-2031
- 5.1. Market Analysis, Insights and Forecast - by Type
- 5.1.1. Windshield-Based Head-Up Display
- 5.1.2. Combiner-Based Head-Up Display
- 5.1.3. AR-Based Head-Up Display
- 5.2. Market Analysis, Insights and Forecast - by Application
- 5.2.1. Automotive
- 5.2.2. Military and Civil Aviation Industry
- 5.2.3. Other Applications
- 5.3. Market Analysis, Insights and Forecast - by Region
- 5.3.1. North America
- 5.3.2. Europe
- 5.3.3. Asia Pacific
- 5.3.4. Rest of the World
- 5.1. Market Analysis, Insights and Forecast - by Type
- 6. North America Heads Up Display Industry Analysis, Insights and Forecast, 2019-2031
- 6.1. Market Analysis, Insights and Forecast - by Type
- 6.1.1. Windshield-Based Head-Up Display
- 6.1.2. Combiner-Based Head-Up Display
- 6.1.3. AR-Based Head-Up Display
- 6.2. Market Analysis, Insights and Forecast - by Application
- 6.2.1. Automotive
- 6.2.2. Military and Civil Aviation Industry
- 6.2.3. Other Applications
- 6.1. Market Analysis, Insights and Forecast - by Type
- 7. Europe Heads Up Display Industry Analysis, Insights and Forecast, 2019-2031
- 7.1. Market Analysis, Insights and Forecast - by Type
- 7.1.1. Windshield-Based Head-Up Display
- 7.1.2. Combiner-Based Head-Up Display
- 7.1.3. AR-Based Head-Up Display
- 7.2. Market Analysis, Insights and Forecast - by Application
- 7.2.1. Automotive
- 7.2.2. Military and Civil Aviation Industry
- 7.2.3. Other Applications
- 7.1. Market Analysis, Insights and Forecast - by Type
- 8. Asia Pacific Heads Up Display Industry Analysis, Insights and Forecast, 2019-2031
- 8.1. Market Analysis, Insights and Forecast - by Type
- 8.1.1. Windshield-Based Head-Up Display
- 8.1.2. Combiner-Based Head-Up Display
- 8.1.3. AR-Based Head-Up Display
- 8.2. Market Analysis, Insights and Forecast - by Application
- 8.2.1. Automotive
- 8.2.2. Military and Civil Aviation Industry
- 8.2.3. Other Applications
- 8.1. Market Analysis, Insights and Forecast - by Type
- 9. Rest of the World Heads Up Display Industry Analysis, Insights and Forecast, 2019-2031
- 9.1. Market Analysis, Insights and Forecast - by Type
- 9.1.1. Windshield-Based Head-Up Display
- 9.1.2. Combiner-Based Head-Up Display
- 9.1.3. AR-Based Head-Up Display
- 9.2. Market Analysis, Insights and Forecast - by Application
- 9.2.1. Automotive
- 9.2.2. Military and Civil Aviation Industry
- 9.2.3. Other Applications
- 9.1. Market Analysis, Insights and Forecast - by Type
- 10. North America Heads Up Display Industry Analysis, Insights and Forecast, 2019-2031
- 10.1. Market Analysis, Insights and Forecast - By Country/Sub-region
- 10.1.1 United States
- 10.1.2 Canada
- 11. Europe Heads Up Display Industry Analysis, Insights and Forecast, 2019-2031
- 11.1. Market Analysis, Insights and Forecast - By Country/Sub-region
- 11.1.1 United Kingdom
- 11.1.2 Germany
- 11.1.3 France
- 11.1.4 Rest of Europe
- 12. Asia Pacific Heads Up Display Industry Analysis, Insights and Forecast, 2019-2031
- 12.1. Market Analysis, Insights and Forecast - By Country/Sub-region
- 12.1.1 China
- 12.1.2 Japan
- 12.1.3 South Korea
- 12.1.4 Australia
- 12.1.5 Rest of Asia Pacific
- 13. Rest of the World Heads Up Display Industry Analysis, Insights and Forecast, 2019-2031
- 13.1. Market Analysis, Insights and Forecast - By Country/Sub-region
- 13.1.1.
- 14. Competitive Analysis
- 14.1. Global Market Share Analysis 2024
- 14.2. Company Profiles
- 14.2.1 Collins Aerospace (Rockwell Collins Inc )
- 14.2.1.1. Overview
- 14.2.1.2. Products
- 14.2.1.3. SWOT Analysis
- 14.2.1.4. Recent Developments
- 14.2.1.5. Financials (Based on Availability)
- 14.2.2 Denso Corporation
- 14.2.2.1. Overview
- 14.2.2.2. Products
- 14.2.2.3. SWOT Analysis
- 14.2.2.4. Recent Developments
- 14.2.2.5. Financials (Based on Availability)
- 14.2.3 Visteon Corporation
- 14.2.3.1. Overview
- 14.2.3.2. Products
- 14.2.3.3. SWOT Analysis
- 14.2.3.4. Recent Developments
- 14.2.3.5. Financials (Based on Availability)
- 14.2.4 Garmin Ltd
- 14.2.4.1. Overview
- 14.2.4.2. Products
- 14.2.4.3. SWOT Analysis
- 14.2.4.4. Recent Developments
- 14.2.4.5. Financials (Based on Availability)
- 14.2.5 Thales Group
- 14.2.5.1. Overview
- 14.2.5.2. Products
- 14.2.5.3. SWOT Analysis
- 14.2.5.4. Recent Developments
- 14.2.5.5. Financials (Based on Availability)
- 14.2.6 BAE Systems PLC
- 14.2.6.1. Overview
- 14.2.6.2. Products
- 14.2.6.3. SWOT Analysis
- 14.2.6.4. Recent Developments
- 14.2.6.5. Financials (Based on Availability)
- 14.2.7 Nippon Seiki Co Ltd
- 14.2.7.1. Overview
- 14.2.7.2. Products
- 14.2.7.3. SWOT Analysis
- 14.2.7.4. Recent Developments
- 14.2.7.5. Financials (Based on Availability)
- 14.2.8 Elbit Systems
- 14.2.8.1. Overview
- 14.2.8.2. Products
- 14.2.8.3. SWOT Analysis
- 14.2.8.4. Recent Developments
- 14.2.8.5. Financials (Based on Availability)
- 14.2.9 Continental AG
- 14.2.9.1. Overview
- 14.2.9.2. Products
- 14.2.9.3. SWOT Analysis
- 14.2.9.4. Recent Developments
- 14.2.9.5. Financials (Based on Availability)
- 14.2.10 HUDWAY LLC
- 14.2.10.1. Overview
- 14.2.10.2. Products
- 14.2.10.3. SWOT Analysis
- 14.2.10.4. Recent Developments
- 14.2.10.5. Financials (Based on Availability)
- 14.2.11 Panasonic Automotive Systems (Panasonic Corporation)
- 14.2.11.1. Overview
- 14.2.11.2. Products
- 14.2.11.3. SWOT Analysis
- 14.2.11.4. Recent Developments
- 14.2.11.5. Financials (Based on Availability)
- 14.2.12 Saab AB
- 14.2.12.1. Overview
- 14.2.12.2. Products
- 14.2.12.3. SWOT Analysis
- 14.2.12.4. Recent Developments
- 14.2.12.5. Financials (Based on Availability)
- 14.2.13 Pioneer Corporation
- 14.2.13.1. Overview
- 14.2.13.2. Products
- 14.2.13.3. SWOT Analysis
- 14.2.13.4. Recent Developments
- 14.2.13.5. Financials (Based on Availability)
- 14.2.1 Collins Aerospace (Rockwell Collins Inc )
List of Figures
- Figure 1: Global Heads Up Display Industry Revenue Breakdown (Million, %) by Region 2024 & 2032
- Figure 2: North America Heads Up Display Industry Revenue (Million), by Country 2024 & 2032
- Figure 3: North America Heads Up Display Industry Revenue Share (%), by Country 2024 & 2032
- Figure 4: Europe Heads Up Display Industry Revenue (Million), by Country 2024 & 2032
- Figure 5: Europe Heads Up Display Industry Revenue Share (%), by Country 2024 & 2032
- Figure 6: Asia Pacific Heads Up Display Industry Revenue (Million), by Country 2024 & 2032
- Figure 7: Asia Pacific Heads Up Display Industry Revenue Share (%), by Country 2024 & 2032
- Figure 8: Rest of the World Heads Up Display Industry Revenue (Million), by Country 2024 & 2032
- Figure 9: Rest of the World Heads Up Display Industry Revenue Share (%), by Country 2024 & 2032
- Figure 10: North America Heads Up Display Industry Revenue (Million), by Type 2024 & 2032
- Figure 11: North America Heads Up Display Industry Revenue Share (%), by Type 2024 & 2032
- Figure 12: North America Heads Up Display Industry Revenue (Million), by Application 2024 & 2032
- Figure 13: North America Heads Up Display Industry Revenue Share (%), by Application 2024 & 2032
- Figure 14: North America Heads Up Display Industry Revenue (Million), by Country 2024 & 2032
- Figure 15: North America Heads Up Display Industry Revenue Share (%), by Country 2024 & 2032
- Figure 16: Europe Heads Up Display Industry Revenue (Million), by Type 2024 & 2032
- Figure 17: Europe Heads Up Display Industry Revenue Share (%), by Type 2024 & 2032
- Figure 18: Europe Heads Up Display Industry Revenue (Million), by Application 2024 & 2032
- Figure 19: Europe Heads Up Display Industry Revenue Share (%), by Application 2024 & 2032
- Figure 20: Europe Heads Up Display Industry Revenue (Million), by Country 2024 & 2032
- Figure 21: Europe Heads Up Display Industry Revenue Share (%), by Country 2024 & 2032
- Figure 22: Asia Pacific Heads Up Display Industry Revenue (Million), by Type 2024 & 2032
- Figure 23: Asia Pacific Heads Up Display Industry Revenue Share (%), by Type 2024 & 2032
- Figure 24: Asia Pacific Heads Up Display Industry Revenue (Million), by Application 2024 & 2032
- Figure 25: Asia Pacific Heads Up Display Industry Revenue Share (%), by Application 2024 & 2032
- Figure 26: Asia Pacific Heads Up Display Industry Revenue (Million), by Country 2024 & 2032
- Figure 27: Asia Pacific Heads Up Display Industry Revenue Share (%), by Country 2024 & 2032
- Figure 28: Rest of the World Heads Up Display Industry Revenue (Million), by Type 2024 & 2032
- Figure 29: Rest of the World Heads Up Display Industry Revenue Share (%), by Type 2024 & 2032
- Figure 30: Rest of the World Heads Up Display Industry Revenue (Million), by Application 2024 & 2032
- Figure 31: Rest of the World Heads Up Display Industry Revenue Share (%), by Application 2024 & 2032
- Figure 32: Rest of the World Heads Up Display Industry Revenue (Million), by Country 2024 & 2032
- Figure 33: Rest of the World Heads Up Display Industry Revenue Share (%), by Country 2024 & 2032
List of Tables
- Table 1: Global Heads Up Display Industry Revenue Million Forecast, by Region 2019 & 2032
- Table 2: Global Heads Up Display Industry Revenue Million Forecast, by Type 2019 & 2032
- Table 3: Global Heads Up Display Industry Revenue Million Forecast, by Application 2019 & 2032
- Table 4: Global Heads Up Display Industry Revenue Million Forecast, by Region 2019 & 2032
- Table 5: Global Heads Up Display Industry Revenue Million Forecast, by Country 2019 & 2032
- Table 6: United States Heads Up Display Industry Revenue (Million) Forecast, by Application 2019 & 2032
- Table 7: Canada Heads Up Display Industry Revenue (Million) Forecast, by Application 2019 & 2032
- Table 8: Global Heads Up Display Industry Revenue Million Forecast, by Country 2019 & 2032
- Table 9: United Kingdom Heads Up Display Industry Revenue (Million) Forecast, by Application 2019 & 2032
- Table 10: Germany Heads Up Display Industry Revenue (Million) Forecast, by Application 2019 & 2032
- Table 11: France Heads Up Display Industry Revenue (Million) Forecast, by Application 2019 & 2032
- Table 12: Rest of Europe Heads Up Display Industry Revenue (Million) Forecast, by Application 2019 & 2032
- Table 13: Global Heads Up Display Industry Revenue Million Forecast, by Country 2019 & 2032
- Table 14: China Heads Up Display Industry Revenue (Million) Forecast, by Application 2019 & 2032
- Table 15: Japan Heads Up Display Industry Revenue (Million) Forecast, by Application 2019 & 2032
- Table 16: South Korea Heads Up Display Industry Revenue (Million) Forecast, by Application 2019 & 2032
- Table 17: Australia Heads Up Display Industry Revenue (Million) Forecast, by Application 2019 & 2032
- Table 18: Rest of Asia Pacific Heads Up Display Industry Revenue (Million) Forecast, by Application 2019 & 2032
- Table 19: Global Heads Up Display Industry Revenue Million Forecast, by Country 2019 & 2032
- Table 20: Heads Up Display Industry Revenue (Million) Forecast, by Application 2019 & 2032
- Table 21: Global Heads Up Display Industry Revenue Million Forecast, by Type 2019 & 2032
- Table 22: Global Heads Up Display Industry Revenue Million Forecast, by Application 2019 & 2032
- Table 23: Global Heads Up Display Industry Revenue Million Forecast, by Country 2019 & 2032
- Table 24: United States Heads Up Display Industry Revenue (Million) Forecast, by Application 2019 & 2032
- Table 25: Canada Heads Up Display Industry Revenue (Million) Forecast, by Application 2019 & 2032
- Table 26: Global Heads Up Display Industry Revenue Million Forecast, by Type 2019 & 2032
- Table 27: Global Heads Up Display Industry Revenue Million Forecast, by Application 2019 & 2032
- Table 28: Global Heads Up Display Industry Revenue Million Forecast, by Country 2019 & 2032
- Table 29: United Kingdom Heads Up Display Industry Revenue (Million) Forecast, by Application 2019 & 2032
- Table 30: Germany Heads Up Display Industry Revenue (Million) Forecast, by Application 2019 & 2032
- Table 31: France Heads Up Display Industry Revenue (Million) Forecast, by Application 2019 & 2032
- Table 32: Rest of Europe Heads Up Display Industry Revenue (Million) Forecast, by Application 2019 & 2032
- Table 33: Global Heads Up Display Industry Revenue Million Forecast, by Type 2019 & 2032
- Table 34: Global Heads Up Display Industry Revenue Million Forecast, by Application 2019 & 2032
- Table 35: Global Heads Up Display Industry Revenue Million Forecast, by Country 2019 & 2032
- Table 36: China Heads Up Display Industry Revenue (Million) Forecast, by Application 2019 & 2032
- Table 37: Japan Heads Up Display Industry Revenue (Million) Forecast, by Application 2019 & 2032
- Table 38: South Korea Heads Up Display Industry Revenue (Million) Forecast, by Application 2019 & 2032
- Table 39: Australia Heads Up Display Industry Revenue (Million) Forecast, by Application 2019 & 2032
- Table 40: Rest of Asia Pacific Heads Up Display Industry Revenue (Million) Forecast, by Application 2019 & 2032
- Table 41: Global Heads Up Display Industry Revenue Million Forecast, by Type 2019 & 2032
- Table 42: Global Heads Up Display Industry Revenue Million Forecast, by Application 2019 & 2032
- Table 43: Global Heads Up Display Industry Revenue Million Forecast, by Country 2019 & 2032
Frequently Asked Questions
1. What is the projected Compound Annual Growth Rate (CAGR) of the Heads Up Display Industry?
The projected CAGR is approximately 21.20%.
2. Which companies are prominent players in the Heads Up Display Industry?
Key companies in the market include Collins Aerospace (Rockwell Collins Inc ), Denso Corporation, Visteon Corporation, Garmin Ltd, Thales Group, BAE Systems PLC, Nippon Seiki Co Ltd, Elbit Systems, Continental AG, HUDWAY LLC, Panasonic Automotive Systems (Panasonic Corporation), Saab AB, Pioneer Corporation.
3. What are the main segments of the Heads Up Display Industry?
The market segments include Type, Application.
4. Can you provide details about the market size?
The market size is estimated to be USD XX Million as of 2022.
5. What are some drivers contributing to market growth?
Technological Advancements of HUD; Growing Awareness About Passenger and Vehicle Safety.
6. What are the notable trends driving market growth?
Growing Adoption of HUD in Automotive Industry Driving the Market's Growth.
7. Are there any restraints impacting market growth?
Lack of International Accepted Standards.
8. Can you provide examples of recent developments in the market?
January 2022 - CY Vision announced automotive 3D Augmented Reality Head-Up Displays (3D AR-HUD). It provides the widest field of view in augmented displays on the market today for all weather conditions and all distances.
9. What pricing options are available for accessing the report?
Pricing options include single-user, multi-user, and enterprise licenses priced at USD 4750, USD 5250, and USD 8750 respectively.
10. Is the market size provided in terms of value or volume?
The market size is provided in terms of value, measured in Million.
11. Are there any specific market keywords associated with the report?
Yes, the market keyword associated with the report is "Heads Up Display Industry," which aids in identifying and referencing the specific market segment covered.
12. How do I determine which pricing option suits my needs best?
The pricing options vary based on user requirements and access needs. Individual users may opt for single-user licenses, while businesses requiring broader access may choose multi-user or enterprise licenses for cost-effective access to the report.
13. Are there any additional resources or data provided in the Heads Up Display Industry report?
While the report offers comprehensive insights, it's advisable to review the specific contents or supplementary materials provided to ascertain if additional resources or data are available.
14. How can I stay updated on further developments or reports in the Heads Up Display Industry?
To stay informed about further developments, trends, and reports in the Heads Up Display Industry, consider subscribing to industry newsletters, following relevant companies and organizations, or regularly checking reputable industry news sources and publications.
Methodology
Step 1 - Identification of Relevant Samples Size from Population Database


Step 2 - Approaches for Defining Global Market Size (Value, Volume* & Price*)

Note*: In applicable scenarios
Step 3 - Data Sources
Primary Research
- Web Analytics
- Survey Reports
- Research Institute
- Latest Research Reports
- Opinion Leaders
Secondary Research
- Annual Reports
- White Paper
- Latest Press Release
- Industry Association
- Paid Database
- Investor Presentations

Step 4 - Data Triangulation
Involves using different sources of information in order to increase the validity of a study
These sources are likely to be stakeholders in a program - participants, other researchers, program staff, other community members, and so on.
Then we put all data in single framework & apply various statistical tools to find out the dynamic on the market.
During the analysis stage, feedback from the stakeholder groups would be compared to determine areas of agreement as well as areas of divergence
