

Key Insights
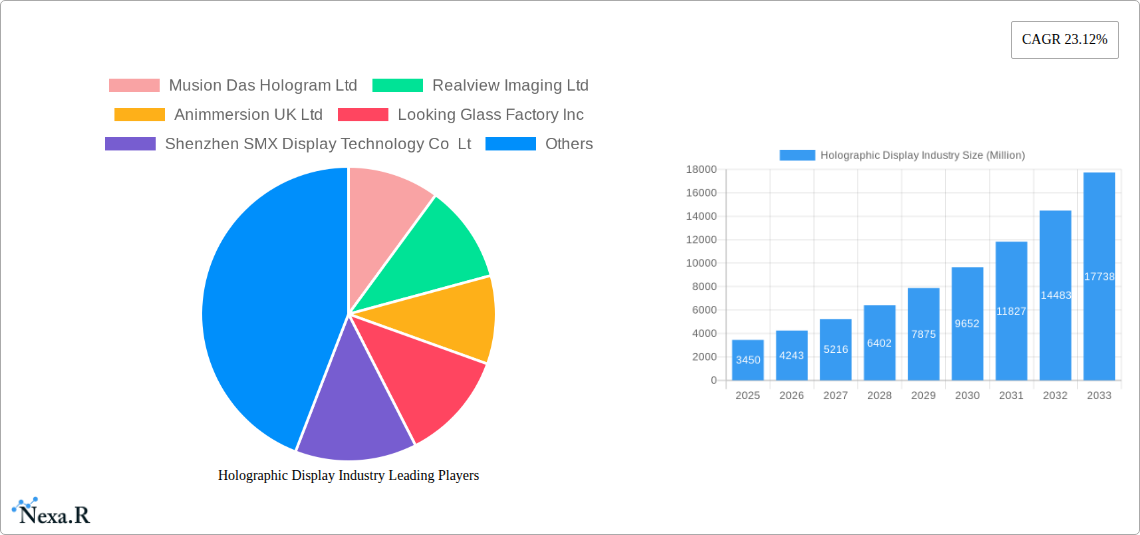
The holographic display market is experiencing explosive growth, projected to reach $3.45 billion in 2025 and maintain a robust Compound Annual Growth Rate (CAGR) of 23.12% from 2025 to 2033. This surge is driven by several key factors. Increasing adoption across diverse end-user verticals, including consumer electronics (driven by demand for immersive gaming and entertainment experiences), retail (for innovative product displays and interactive marketing), media and entertainment (for captivating visual storytelling and live events), and healthcare (for advanced medical imaging and training simulations), fuels market expansion. Technological advancements, such as improved display resolution, brighter projection capabilities, and more compact and cost-effective devices, are further contributing to market growth. The rise of augmented reality (AR) and virtual reality (VR) applications also plays a significant role, as holographic displays provide a compelling pathway to more realistic and engaging experiences.
Despite this positive outlook, certain challenges remain. High initial investment costs for both manufacturers and consumers pose a barrier to widespread adoption, particularly in emerging markets. The need for specialized infrastructure and skilled professionals to design, implement, and maintain holographic display systems can also limit market penetration. Furthermore, technological limitations in achieving truly realistic and high-resolution holographic projections continue to be addressed, although advancements are being made continuously. Despite these restraints, the market's considerable growth potential and the diverse range of applications suggest a promising future for holographic display technology, particularly within the entertainment, healthcare, and retail sectors. Companies such as Musion Das Hologram Ltd, Realview Imaging Ltd, and others are at the forefront of this technological revolution, continually innovating and pushing the boundaries of holographic display capabilities. Regional growth will likely be concentrated in North America and Asia, given the early adoption rates and significant investment in relevant technologies in those regions.
Holographic Display Industry Market Report: 2019-2033
This comprehensive report provides an in-depth analysis of the holographic display industry, encompassing market dynamics, growth trends, key players, and future outlook. The study period spans from 2019 to 2033, with 2025 as the base and estimated year. The report segments the market by end-user verticals, including consumer electronics, retail, media and entertainment, military and defense, healthcare, automotive, and others, offering a granular understanding of market dynamics across various sectors. The report is essential for industry professionals, investors, and anyone seeking to understand this rapidly evolving technological landscape. The market is projected to reach xx million units by 2033.
Holographic Display Industry Market Dynamics & Structure
The holographic display market is characterized by moderate concentration, with several key players competing alongside emerging innovative companies. Technological advancements, particularly in areas like improved resolution, brightness, and cost-effectiveness, are primary drivers. Regulatory frameworks concerning data privacy and safety standards also influence market growth. Competitive product substitutes, like advanced augmented reality (AR) and virtual reality (VR) technologies, present challenges. End-user demographics are expanding, with increasing adoption across various sectors. M&A activity is relatively moderate, with a focus on strategic partnerships and technology acquisitions.
- Market Concentration: Moderately concentrated, with a few dominant players holding xx% market share in 2024.
- Technological Innovation: Rapid advancements in laser technology, spatial light modulators, and display materials are driving innovation.
- Regulatory Frameworks: Emerging data privacy and safety regulations are impacting market development.
- Competitive Substitutes: Advanced AR/VR technologies pose competitive pressure.
- End-User Demographics: Expanding adoption across various industries fuels market growth.
- M&A Trends: A moderate number of M&A deals, primarily focused on technology acquisitions and strategic partnerships (xx deals in the past five years).
Holographic Display Industry Growth Trends & Insights
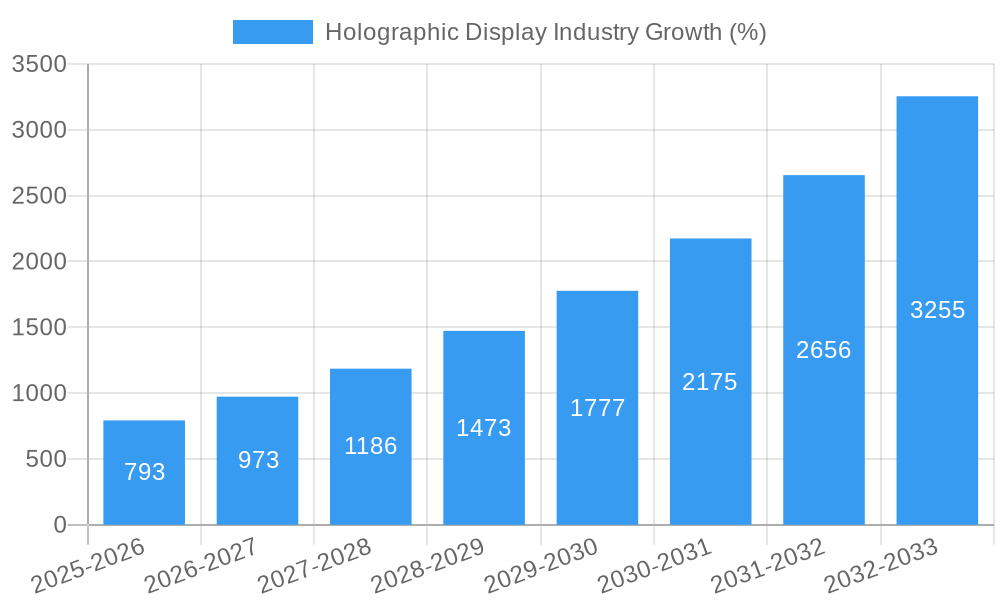
The holographic display market witnessed significant growth from 2019 to 2024, primarily driven by increased demand from the consumer electronics, retail, and entertainment sectors. This growth is expected to continue at a Compound Annual Growth Rate (CAGR) of xx% during the forecast period (2025-2033), reaching xx million units by 2033. Technological disruptions, such as advancements in holographic projection and display technologies, are accelerating adoption. Consumer behavior shifts towards immersive experiences are further boosting market expansion. Market penetration is increasing across various segments.
Dominant Regions, Countries, or Segments in Holographic Display Industry
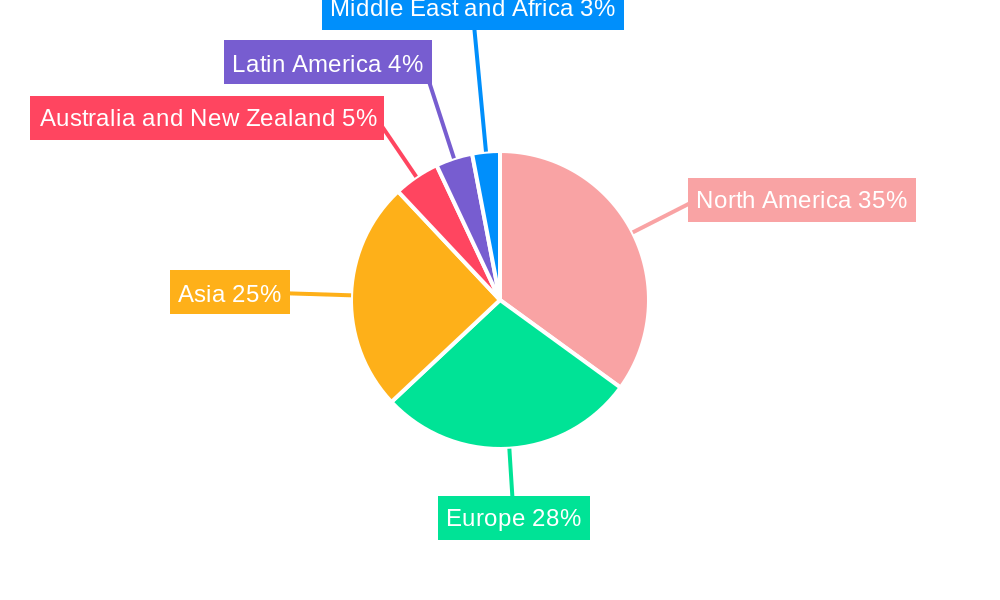
The North American market currently holds a significant share of the global holographic display market, driven by substantial investments in research and development, coupled with a robust consumer electronics industry. Asia-Pacific is projected to experience the fastest growth due to increasing adoption in consumer electronics and the presence of major manufacturing hubs. The Media and Entertainment segment exhibits the highest growth potential, propelled by the increasing demand for immersive entertainment experiences.
- North America: High R&D investment and strong consumer electronics market.
- Asia-Pacific: Fastest growth potential, driven by manufacturing and consumer electronics adoption.
- Media & Entertainment: Highest growth potential, driven by immersive entertainment demands.
- Automotive: Emerging sector with significant growth potential due to advancements in in-car displays.
Holographic Display Industry Product Landscape
Holographic displays are evolving from simple 2D projections to complex 3D volumetric displays, showcasing advancements in resolution, brightness, and viewing angles. Unique selling propositions include enhanced realism, interactive capabilities, and applications in various fields like advertising, entertainment, and healthcare. Technological advancements focus on improving image quality, reducing cost, and increasing portability.
Key Drivers, Barriers & Challenges in Holographic Display Industry
Key Drivers:
- Growing demand for immersive experiences across various sectors.
- Advancements in display technologies, like higher resolution and brightness.
- Increasing investments in R&D from both public and private sectors.
Key Challenges:
- High manufacturing costs limiting mass market adoption.
- Technological limitations in achieving high-resolution, full-color displays.
- Complex supply chains and potential material shortages.
Emerging Opportunities in Holographic Display Industry
Untapped markets in developing economies present significant growth opportunities. Innovative applications in education, training, and healthcare are expected to emerge. Evolving consumer preferences towards personalized and interactive experiences are driving demand for innovative holographic displays.
Growth Accelerators in the Holographic Display Industry Industry
Technological breakthroughs, particularly in areas like improved spatial light modulators and laser sources, are accelerating market growth. Strategic partnerships between display manufacturers and technology providers are fostering innovation. Market expansion strategies targeting untapped sectors like healthcare and education are expected to boost adoption.
Key Players Shaping the Holographic Display Industry Market
- Musion Das Hologram Ltd
- Realview Imaging Ltd
- Animmersion UK Ltd
- Looking Glass Factory Inc
- Shenzhen SMX Display Technology Co Lt
- Kino-mo Limited (HYPERVSN)
- RealFiction Holding AB
- Provision Holding Inc
Notable Milestones in Holographic Display Industry Sector
- January 2024: Hyundai Mobis unveils its first transparent holographic display for next-gen vehicles, showcasing advancements in automotive applications.
- January 2024: ARHT Media Inc. partners with a global luxury retail brand to install holographic displays in five country headquarters, highlighting growth in retail applications.
In-Depth Holographic Display Industry Market Outlook
The holographic display market is poised for substantial growth over the next decade, driven by continuous technological advancements, expanding applications across diverse industries, and increasing consumer demand for immersive experiences. Strategic partnerships and investments in R&D will further shape the market landscape, creating opportunities for both established and emerging players. The market is expected to reach xx million units by 2033, presenting significant opportunities for growth and innovation.
Holographic Display Industry Segmentation
-
1. End-user Verticals
- 1.1. Consumer Electronics
- 1.2. Retail
- 1.3. Media and Entertainment
- 1.4. Military and Defense
- 1.5. Healthcare
- 1.6. Automotive
- 1.7. Other End-user Verticals
Holographic Display Industry Segmentation By Geography
- 1. North America
- 2. Europe
- 3. Asia
- 4. Australia and New Zealand
- 5. Latin America
- 6. Middle East and Africa
Holographic Display Industry REPORT HIGHLIGHTS
| Aspects | Details |
|---|---|
| Study Period | 2019-2033 |
| Base Year | 2024 |
| Estimated Year | 2025 |
| Forecast Period | 2025-2033 |
| Historical Period | 2019-2024 |
| Growth Rate | CAGR of 23.12% from 2019-2033 |
| Segmentation |
|
Table of Contents
- 1. Introduction
- 1.1. Research Scope
- 1.2. Market Segmentation
- 1.3. Research Methodology
- 1.4. Definitions and Assumptions
- 2. Executive Summary
- 2.1. Introduction
- 3. Market Dynamics
- 3.1. Introduction
- 3.2. Market Drivers
- 3.2.1. Increasing Investments in 3D Technology; Advancements in Screenless Displays
- 3.3. Market Restrains
- 3.3.1. High Cost of Assembling Holographic Display Devices; Presence of Substitute Display Products
- 3.4. Market Trends
- 3.4.1. Automotive Segment is Expected to Witness Significant Growth
- 4. Market Factor Analysis
- 4.1. Porters Five Forces
- 4.2. Supply/Value Chain
- 4.3. PESTEL analysis
- 4.4. Market Entropy
- 4.5. Patent/Trademark Analysis
- 5. Global Holographic Display Industry Analysis, Insights and Forecast, 2019-2031
- 5.1. Market Analysis, Insights and Forecast - by End-user Verticals
- 5.1.1. Consumer Electronics
- 5.1.2. Retail
- 5.1.3. Media and Entertainment
- 5.1.4. Military and Defense
- 5.1.5. Healthcare
- 5.1.6. Automotive
- 5.1.7. Other End-user Verticals
- 5.2. Market Analysis, Insights and Forecast - by Region
- 5.2.1. North America
- 5.2.2. Europe
- 5.2.3. Asia
- 5.2.4. Australia and New Zealand
- 5.2.5. Latin America
- 5.2.6. Middle East and Africa
- 5.1. Market Analysis, Insights and Forecast - by End-user Verticals
- 6. North America Holographic Display Industry Analysis, Insights and Forecast, 2019-2031
- 6.1. Market Analysis, Insights and Forecast - by End-user Verticals
- 6.1.1. Consumer Electronics
- 6.1.2. Retail
- 6.1.3. Media and Entertainment
- 6.1.4. Military and Defense
- 6.1.5. Healthcare
- 6.1.6. Automotive
- 6.1.7. Other End-user Verticals
- 6.1. Market Analysis, Insights and Forecast - by End-user Verticals
- 7. Europe Holographic Display Industry Analysis, Insights and Forecast, 2019-2031
- 7.1. Market Analysis, Insights and Forecast - by End-user Verticals
- 7.1.1. Consumer Electronics
- 7.1.2. Retail
- 7.1.3. Media and Entertainment
- 7.1.4. Military and Defense
- 7.1.5. Healthcare
- 7.1.6. Automotive
- 7.1.7. Other End-user Verticals
- 7.1. Market Analysis, Insights and Forecast - by End-user Verticals
- 8. Asia Holographic Display Industry Analysis, Insights and Forecast, 2019-2031
- 8.1. Market Analysis, Insights and Forecast - by End-user Verticals
- 8.1.1. Consumer Electronics
- 8.1.2. Retail
- 8.1.3. Media and Entertainment
- 8.1.4. Military and Defense
- 8.1.5. Healthcare
- 8.1.6. Automotive
- 8.1.7. Other End-user Verticals
- 8.1. Market Analysis, Insights and Forecast - by End-user Verticals
- 9. Australia and New Zealand Holographic Display Industry Analysis, Insights and Forecast, 2019-2031
- 9.1. Market Analysis, Insights and Forecast - by End-user Verticals
- 9.1.1. Consumer Electronics
- 9.1.2. Retail
- 9.1.3. Media and Entertainment
- 9.1.4. Military and Defense
- 9.1.5. Healthcare
- 9.1.6. Automotive
- 9.1.7. Other End-user Verticals
- 9.1. Market Analysis, Insights and Forecast - by End-user Verticals
- 10. Latin America Holographic Display Industry Analysis, Insights and Forecast, 2019-2031
- 10.1. Market Analysis, Insights and Forecast - by End-user Verticals
- 10.1.1. Consumer Electronics
- 10.1.2. Retail
- 10.1.3. Media and Entertainment
- 10.1.4. Military and Defense
- 10.1.5. Healthcare
- 10.1.6. Automotive
- 10.1.7. Other End-user Verticals
- 10.1. Market Analysis, Insights and Forecast - by End-user Verticals
- 11. Middle East and Africa Holographic Display Industry Analysis, Insights and Forecast, 2019-2031
- 11.1. Market Analysis, Insights and Forecast - by End-user Verticals
- 11.1.1. Consumer Electronics
- 11.1.2. Retail
- 11.1.3. Media and Entertainment
- 11.1.4. Military and Defense
- 11.1.5. Healthcare
- 11.1.6. Automotive
- 11.1.7. Other End-user Verticals
- 11.1. Market Analysis, Insights and Forecast - by End-user Verticals
- 12. North America Holographic Display Industry Analysis, Insights and Forecast, 2019-2031
- 12.1. Market Analysis, Insights and Forecast - By Country/Sub-region
- 12.1.1.
- 13. Europe Holographic Display Industry Analysis, Insights and Forecast, 2019-2031
- 13.1. Market Analysis, Insights and Forecast - By Country/Sub-region
- 13.1.1.
- 14. Asia Holographic Display Industry Analysis, Insights and Forecast, 2019-2031
- 14.1. Market Analysis, Insights and Forecast - By Country/Sub-region
- 14.1.1.
- 15. Australia and New Zealand Holographic Display Industry Analysis, Insights and Forecast, 2019-2031
- 15.1. Market Analysis, Insights and Forecast - By Country/Sub-region
- 15.1.1.
- 16. Latin America Holographic Display Industry Analysis, Insights and Forecast, 2019-2031
- 16.1. Market Analysis, Insights and Forecast - By Country/Sub-region
- 16.1.1.
- 17. Middle East and Africa Holographic Display Industry Analysis, Insights and Forecast, 2019-2031
- 17.1. Market Analysis, Insights and Forecast - By Country/Sub-region
- 17.1.1.
- 18. Competitive Analysis
- 18.1. Global Market Share Analysis 2024
- 18.2. Company Profiles
- 18.2.1 Musion Das Hologram Ltd
- 18.2.1.1. Overview
- 18.2.1.2. Products
- 18.2.1.3. SWOT Analysis
- 18.2.1.4. Recent Developments
- 18.2.1.5. Financials (Based on Availability)
- 18.2.2 Realview Imaging Ltd
- 18.2.2.1. Overview
- 18.2.2.2. Products
- 18.2.2.3. SWOT Analysis
- 18.2.2.4. Recent Developments
- 18.2.2.5. Financials (Based on Availability)
- 18.2.3 Animmersion UK Ltd
- 18.2.3.1. Overview
- 18.2.3.2. Products
- 18.2.3.3. SWOT Analysis
- 18.2.3.4. Recent Developments
- 18.2.3.5. Financials (Based on Availability)
- 18.2.4 Looking Glass Factory Inc
- 18.2.4.1. Overview
- 18.2.4.2. Products
- 18.2.4.3. SWOT Analysis
- 18.2.4.4. Recent Developments
- 18.2.4.5. Financials (Based on Availability)
- 18.2.5 Shenzhen SMX Display Technology Co Lt
- 18.2.5.1. Overview
- 18.2.5.2. Products
- 18.2.5.3. SWOT Analysis
- 18.2.5.4. Recent Developments
- 18.2.5.5. Financials (Based on Availability)
- 18.2.6 Kino-mo Limited (HYPERVSN)
- 18.2.6.1. Overview
- 18.2.6.2. Products
- 18.2.6.3. SWOT Analysis
- 18.2.6.4. Recent Developments
- 18.2.6.5. Financials (Based on Availability)
- 18.2.7 RealFiction Holding AB
- 18.2.7.1. Overview
- 18.2.7.2. Products
- 18.2.7.3. SWOT Analysis
- 18.2.7.4. Recent Developments
- 18.2.7.5. Financials (Based on Availability)
- 18.2.8 Provision Holding Inc
- 18.2.8.1. Overview
- 18.2.8.2. Products
- 18.2.8.3. SWOT Analysis
- 18.2.8.4. Recent Developments
- 18.2.8.5. Financials (Based on Availability)
- 18.2.1 Musion Das Hologram Ltd
List of Figures
- Figure 1: Global Holographic Display Industry Revenue Breakdown (Million, %) by Region 2024 & 2032
- Figure 2: North America Holographic Display Industry Revenue (Million), by Country 2024 & 2032
- Figure 3: North America Holographic Display Industry Revenue Share (%), by Country 2024 & 2032
- Figure 4: Europe Holographic Display Industry Revenue (Million), by Country 2024 & 2032
- Figure 5: Europe Holographic Display Industry Revenue Share (%), by Country 2024 & 2032
- Figure 6: Asia Holographic Display Industry Revenue (Million), by Country 2024 & 2032
- Figure 7: Asia Holographic Display Industry Revenue Share (%), by Country 2024 & 2032
- Figure 8: Australia and New Zealand Holographic Display Industry Revenue (Million), by Country 2024 & 2032
- Figure 9: Australia and New Zealand Holographic Display Industry Revenue Share (%), by Country 2024 & 2032
- Figure 10: Latin America Holographic Display Industry Revenue (Million), by Country 2024 & 2032
- Figure 11: Latin America Holographic Display Industry Revenue Share (%), by Country 2024 & 2032
- Figure 12: Middle East and Africa Holographic Display Industry Revenue (Million), by Country 2024 & 2032
- Figure 13: Middle East and Africa Holographic Display Industry Revenue Share (%), by Country 2024 & 2032
- Figure 14: North America Holographic Display Industry Revenue (Million), by End-user Verticals 2024 & 2032
- Figure 15: North America Holographic Display Industry Revenue Share (%), by End-user Verticals 2024 & 2032
- Figure 16: North America Holographic Display Industry Revenue (Million), by Country 2024 & 2032
- Figure 17: North America Holographic Display Industry Revenue Share (%), by Country 2024 & 2032
- Figure 18: Europe Holographic Display Industry Revenue (Million), by End-user Verticals 2024 & 2032
- Figure 19: Europe Holographic Display Industry Revenue Share (%), by End-user Verticals 2024 & 2032
- Figure 20: Europe Holographic Display Industry Revenue (Million), by Country 2024 & 2032
- Figure 21: Europe Holographic Display Industry Revenue Share (%), by Country 2024 & 2032
- Figure 22: Asia Holographic Display Industry Revenue (Million), by End-user Verticals 2024 & 2032
- Figure 23: Asia Holographic Display Industry Revenue Share (%), by End-user Verticals 2024 & 2032
- Figure 24: Asia Holographic Display Industry Revenue (Million), by Country 2024 & 2032
- Figure 25: Asia Holographic Display Industry Revenue Share (%), by Country 2024 & 2032
- Figure 26: Australia and New Zealand Holographic Display Industry Revenue (Million), by End-user Verticals 2024 & 2032
- Figure 27: Australia and New Zealand Holographic Display Industry Revenue Share (%), by End-user Verticals 2024 & 2032
- Figure 28: Australia and New Zealand Holographic Display Industry Revenue (Million), by Country 2024 & 2032
- Figure 29: Australia and New Zealand Holographic Display Industry Revenue Share (%), by Country 2024 & 2032
- Figure 30: Latin America Holographic Display Industry Revenue (Million), by End-user Verticals 2024 & 2032
- Figure 31: Latin America Holographic Display Industry Revenue Share (%), by End-user Verticals 2024 & 2032
- Figure 32: Latin America Holographic Display Industry Revenue (Million), by Country 2024 & 2032
- Figure 33: Latin America Holographic Display Industry Revenue Share (%), by Country 2024 & 2032
- Figure 34: Middle East and Africa Holographic Display Industry Revenue (Million), by End-user Verticals 2024 & 2032
- Figure 35: Middle East and Africa Holographic Display Industry Revenue Share (%), by End-user Verticals 2024 & 2032
- Figure 36: Middle East and Africa Holographic Display Industry Revenue (Million), by Country 2024 & 2032
- Figure 37: Middle East and Africa Holographic Display Industry Revenue Share (%), by Country 2024 & 2032
List of Tables
- Table 1: Global Holographic Display Industry Revenue Million Forecast, by Region 2019 & 2032
- Table 2: Global Holographic Display Industry Revenue Million Forecast, by End-user Verticals 2019 & 2032
- Table 3: Global Holographic Display Industry Revenue Million Forecast, by Region 2019 & 2032
- Table 4: Global Holographic Display Industry Revenue Million Forecast, by Country 2019 & 2032
- Table 5: Holographic Display Industry Revenue (Million) Forecast, by Application 2019 & 2032
- Table 6: Global Holographic Display Industry Revenue Million Forecast, by Country 2019 & 2032
- Table 7: Holographic Display Industry Revenue (Million) Forecast, by Application 2019 & 2032
- Table 8: Global Holographic Display Industry Revenue Million Forecast, by Country 2019 & 2032
- Table 9: Holographic Display Industry Revenue (Million) Forecast, by Application 2019 & 2032
- Table 10: Global Holographic Display Industry Revenue Million Forecast, by Country 2019 & 2032
- Table 11: Holographic Display Industry Revenue (Million) Forecast, by Application 2019 & 2032
- Table 12: Global Holographic Display Industry Revenue Million Forecast, by Country 2019 & 2032
- Table 13: Holographic Display Industry Revenue (Million) Forecast, by Application 2019 & 2032
- Table 14: Global Holographic Display Industry Revenue Million Forecast, by Country 2019 & 2032
- Table 15: Holographic Display Industry Revenue (Million) Forecast, by Application 2019 & 2032
- Table 16: Global Holographic Display Industry Revenue Million Forecast, by End-user Verticals 2019 & 2032
- Table 17: Global Holographic Display Industry Revenue Million Forecast, by Country 2019 & 2032
- Table 18: Global Holographic Display Industry Revenue Million Forecast, by End-user Verticals 2019 & 2032
- Table 19: Global Holographic Display Industry Revenue Million Forecast, by Country 2019 & 2032
- Table 20: Global Holographic Display Industry Revenue Million Forecast, by End-user Verticals 2019 & 2032
- Table 21: Global Holographic Display Industry Revenue Million Forecast, by Country 2019 & 2032
- Table 22: Global Holographic Display Industry Revenue Million Forecast, by End-user Verticals 2019 & 2032
- Table 23: Global Holographic Display Industry Revenue Million Forecast, by Country 2019 & 2032
- Table 24: Global Holographic Display Industry Revenue Million Forecast, by End-user Verticals 2019 & 2032
- Table 25: Global Holographic Display Industry Revenue Million Forecast, by Country 2019 & 2032
- Table 26: Global Holographic Display Industry Revenue Million Forecast, by End-user Verticals 2019 & 2032
- Table 27: Global Holographic Display Industry Revenue Million Forecast, by Country 2019 & 2032
Frequently Asked Questions
1. What is the projected Compound Annual Growth Rate (CAGR) of the Holographic Display Industry?
The projected CAGR is approximately 23.12%.
2. Which companies are prominent players in the Holographic Display Industry?
Key companies in the market include Musion Das Hologram Ltd, Realview Imaging Ltd, Animmersion UK Ltd, Looking Glass Factory Inc, Shenzhen SMX Display Technology Co Lt, Kino-mo Limited (HYPERVSN), RealFiction Holding AB, Provision Holding Inc.
3. What are the main segments of the Holographic Display Industry?
The market segments include End-user Verticals.
4. Can you provide details about the market size?
The market size is estimated to be USD 3.45 Million as of 2022.
5. What are some drivers contributing to market growth?
Increasing Investments in 3D Technology; Advancements in Screenless Displays.
6. What are the notable trends driving market growth?
Automotive Segment is Expected to Witness Significant Growth.
7. Are there any restraints impacting market growth?
High Cost of Assembling Holographic Display Devices; Presence of Substitute Display Products.
8. Can you provide examples of recent developments in the market?
Jan 2024: Hyundai Mobis, Hyundai’s largest supplier, unveiled its latest EV tech. It uses the first transparent display screen using holographic tech. The company revealed its “innovative display series” for next-gen vehicles, which included the “world’s first rollable display and swivel display.” Hyundai Mobis presented a transparent display that uses holographic elements. The display appears on a transparent panel, making it easier for drivers to keep their eyes on the road.
9. What pricing options are available for accessing the report?
Pricing options include single-user, multi-user, and enterprise licenses priced at USD 4750, USD 5250, and USD 8750 respectively.
10. Is the market size provided in terms of value or volume?
The market size is provided in terms of value, measured in Million.
11. Are there any specific market keywords associated with the report?
Yes, the market keyword associated with the report is "Holographic Display Industry," which aids in identifying and referencing the specific market segment covered.
12. How do I determine which pricing option suits my needs best?
The pricing options vary based on user requirements and access needs. Individual users may opt for single-user licenses, while businesses requiring broader access may choose multi-user or enterprise licenses for cost-effective access to the report.
13. Are there any additional resources or data provided in the Holographic Display Industry report?
While the report offers comprehensive insights, it's advisable to review the specific contents or supplementary materials provided to ascertain if additional resources or data are available.
14. How can I stay updated on further developments or reports in the Holographic Display Industry?
To stay informed about further developments, trends, and reports in the Holographic Display Industry, consider subscribing to industry newsletters, following relevant companies and organizations, or regularly checking reputable industry news sources and publications.
Methodology
Step 1 - Identification of Relevant Samples Size from Population Database


Step 2 - Approaches for Defining Global Market Size (Value, Volume* & Price*)

Note*: In applicable scenarios
Step 3 - Data Sources
Primary Research
- Web Analytics
- Survey Reports
- Research Institute
- Latest Research Reports
- Opinion Leaders
Secondary Research
- Annual Reports
- White Paper
- Latest Press Release
- Industry Association
- Paid Database
- Investor Presentations

Step 4 - Data Triangulation
Involves using different sources of information in order to increase the validity of a study
These sources are likely to be stakeholders in a program - participants, other researchers, program staff, other community members, and so on.
Then we put all data in single framework & apply various statistical tools to find out the dynamic on the market.
During the analysis stage, feedback from the stakeholder groups would be compared to determine areas of agreement as well as areas of divergence
