

Key Insights
The global household use electric fan market is a substantial and steadily growing sector, exhibiting a robust performance driven by several key factors. Rising disposable incomes in developing economies, coupled with increasing urbanization and a growing preference for energy-efficient cooling solutions, are major contributors to market expansion. Furthermore, advancements in fan technology, including the introduction of smart fans with features like remote control, adjustable speeds, and oscillating functions, are fueling consumer demand. The market is segmented by type (desk, ceiling, pedestal, wall, etc.), energy efficiency (low, medium, high), and distribution channel (online, offline). Competitive landscape analysis reveals the presence of both established international players like Honeywell and Panasonic, and regionally strong brands like Havells India and Crompton Greaves. This competition fosters innovation and ensures a diverse range of products catering to various price points and consumer preferences.
However, the market's growth is not without challenges. Fluctuations in raw material prices, particularly for metals like copper and steel used in fan manufacturing, pose a considerable restraint. Additionally, the increasing popularity of air conditioning units presents a competitive threat, particularly in regions with high disposable incomes. To mitigate these challenges, manufacturers are focusing on developing eco-friendly and cost-effective fan models, incorporating features such as energy-saving motors and durable components to extend product lifespan. The market is expected to maintain a positive trajectory throughout the forecast period (2025-2033), driven by the continuous demand for affordable and efficient cooling solutions across both developed and emerging markets. Strategic partnerships, product diversification, and a focus on sustainable manufacturing practices will be crucial for market players to secure their position in this dynamic and competitive landscape.
Household Use Electric Fans Market Report: 2019-2033
This comprehensive report provides an in-depth analysis of the global household use electric fans market, covering the period from 2019 to 2033. With a focus on market dynamics, growth trends, key players, and future opportunities, this report is an invaluable resource for industry professionals, investors, and anyone seeking to understand this dynamic sector. The report projects a market size exceeding xx million units by 2033, driven by factors detailed below. The parent market is the broader home appliance market, while the child market encompasses various fan types (e.g., pedestal, ceiling, tower).
Household Use Electric Fans Market Dynamics & Structure
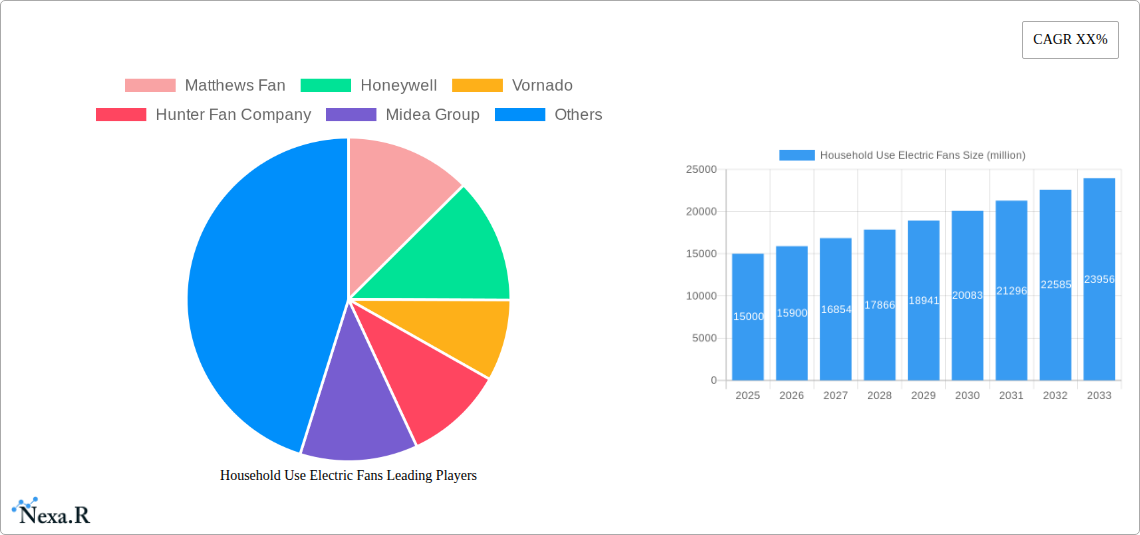
The global household use electric fans market is characterized by a moderately fragmented landscape, with several major players competing alongside numerous smaller regional brands. Market concentration is expected to slightly increase by 2033 due to mergers and acquisitions (M&A). Technological innovation, primarily focused on energy efficiency, smart features, and design improvements, is a key driver. Stringent energy efficiency regulations in several regions are influencing product development and consumer choices. Competitive substitutes include air conditioners, although fans maintain a significant market share due to lower costs and energy consumption. End-user demographics show a significant demand from developing economies with rising disposable incomes and increasing urbanization.
- Market Concentration: Moderately fragmented (2025 market share of top 5 players: 40%)
- M&A Activity: XX deals recorded between 2019-2024, with an anticipated increase in the forecast period.
- Technological Innovation: Focus on energy efficiency (DC motor technology, BLDC motors), smart features (app control, timers), and aesthetically pleasing designs.
- Regulatory Landscape: Increasingly stringent energy efficiency standards globally.
- Competitive Substitutes: Air conditioners, evaporative coolers.
- Innovation Barriers: High R&D costs, competition from established players.
Household Use Electric Fans Growth Trends & Insights
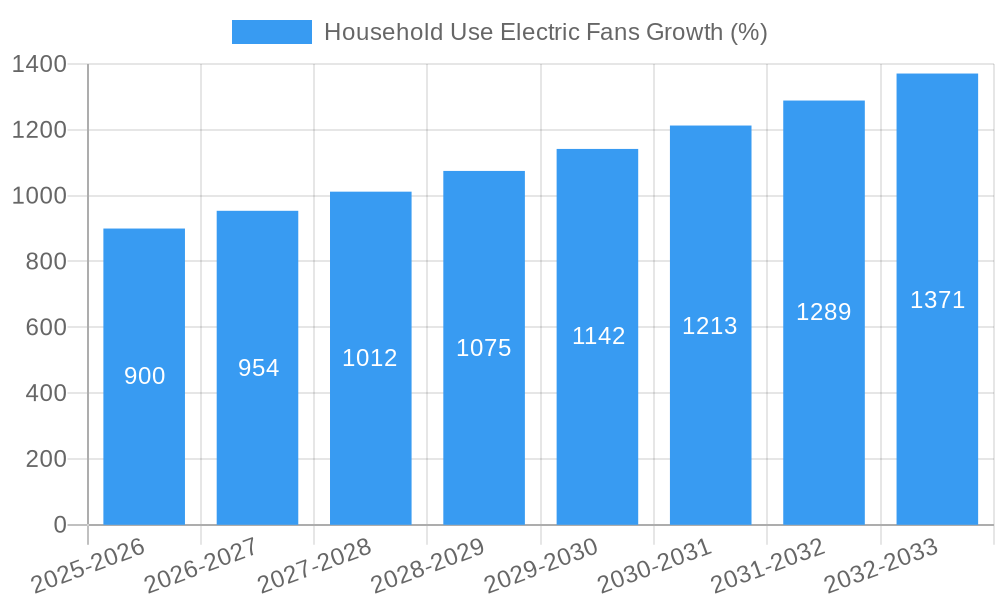
The global household use electric fans market experienced steady growth during the historical period (2019-2024), driven by rising temperatures, increasing urbanization in developing countries, and the growing popularity of energy-efficient models. The market is expected to maintain a healthy Compound Annual Growth Rate (CAGR) of xx% during the forecast period (2025-2033). Market penetration is high in developed regions but significant growth potential exists in emerging markets. Technological disruptions, such as the adoption of DC motor technology, are increasing the efficiency and lifespan of fans. Consumer behavior is shifting towards smart and energy-efficient models with improved aesthetics.
- Market Size (million units): 2019: xx, 2024: xx, 2025: xx, 2033: xx
- CAGR (2025-2033): xx%
- Market Penetration (2025): xx% in developed countries, xx% in developing countries.
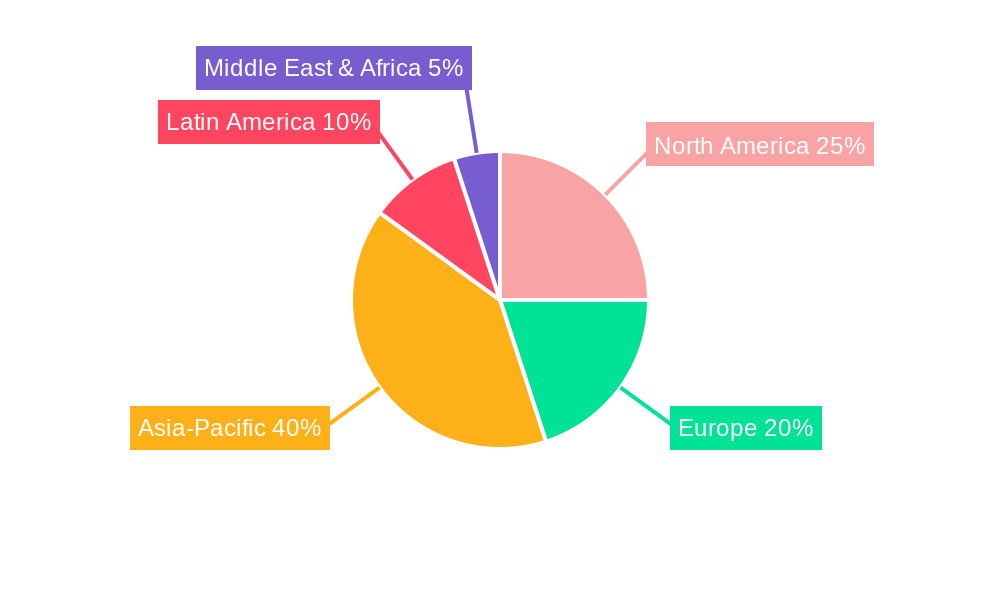
Dominant Regions, Countries, or Segments in Household Use Electric Fans
Asia-Pacific is currently the dominant region in the household use electric fans market, driven by high population density, rising disposable incomes, and increasing urbanization in countries like India and China. The region's strong manufacturing base further supports its dominance. Other regions are showing promising growth, particularly in countries with hot climates and a growing middle class.
Key Drivers:
- Asia-Pacific: High population density, rising disposable incomes, strong manufacturing base, increasing urbanization, hot climate.
- North America: High adoption of smart home technology, preference for energy-efficient appliances.
- Europe: Growing awareness of energy efficiency, stringent environmental regulations.
Dominant Countries: India, China, USA, Brazil.
Market Share (2025): Asia-Pacific (xx%), North America (xx%), Europe (xx%).
Household Use Electric Fans Product Landscape
The market offers a diverse range of products, including pedestal fans, ceiling fans, tower fans, desk fans, and exhaust fans. Significant advancements have been made in motor technology, leading to quieter operation and increased energy efficiency. Smart features, such as app connectivity, timers, and remote control, are increasingly integrated into higher-end models. Unique selling propositions frequently include improved airflow, quieter operation, and sophisticated design aesthetics.
Key Drivers, Barriers & Challenges in Household Use Electric Fans
Key Drivers:
- Rising global temperatures and increased frequency of heat waves.
- Growing urbanization and increased household disposable incomes in developing economies.
- Growing adoption of energy-efficient and technologically advanced fans.
- Government initiatives promoting energy efficiency.
Key Challenges and Restraints:
- Intense competition among established and emerging players.
- Fluctuations in raw material prices and supply chain disruptions.
- Stringent environmental regulations and standards.
- Economic downturns impacting consumer spending.
Emerging Opportunities in Household Use Electric Fans
Emerging opportunities include the growth of smart home technology integration, the expansion into untapped markets in Africa and Latin America, and the increasing demand for eco-friendly and energy-efficient models. Furthermore, niche markets for specialized fans (e.g., industrial fans adapted for home use) show promise.
Growth Accelerators in the Household Use Electric Fans Industry
Strategic partnerships between manufacturers and retailers can significantly enhance market reach and product distribution. Technological breakthroughs in motor technology, material science, and design will continue to drive market growth by providing more energy-efficient and feature-rich products. Expansion into new geographical markets and the development of innovative product applications (e.g., air purifiers integrated with fans) will further accelerate growth.
Key Players Shaping the Household Use Electric Fans Market
- Matthews Fan
- Honeywell
- Vornado
- Hunter Fan Company
- Midea Group
- Gree Electric Appliances
- Havells India
- Crompton Greaves
- Panasonic
- Sharp Corporation
- Toshiba
- Symphony
- Whirlpool
- Electrolux
- LG
- Haier
- Midea
Notable Milestones in Household Use Electric Fans Sector
- 2020: Midea Group launched a new line of energy-efficient DC motor fans.
- 2021: Honeywell introduced a smart fan with app connectivity and voice control.
- 2022: A significant merger occurred between two smaller fan manufacturers, resulting in increased market share for the combined entity.
- 2023: Several major players introduced fans with enhanced safety features.
- 2024: Government regulations regarding energy efficiency standards came into effect in several countries.
In-Depth Household Use Electric Fans Market Outlook
The household use electric fans market is poised for sustained growth over the next decade, driven by several factors including increasing demand in emerging economies, the continued development of energy-efficient technologies, and the integration of smart home features. Strategic investments in R&D, expansion into new markets, and the formation of strategic partnerships will be key to success for companies operating in this sector. The market's future is bright, with significant opportunities for innovation and growth.
Household Use Electric Fans Segmentation
-
1. Application
- 1.1. Online Sales
- 1.2. Offline Sales
-
2. Types
- 2.1. Wall-Mounted Fan
- 2.2. Seated Fan
Household Use Electric Fans Segmentation By Geography
-
1. North America
- 1.1. United States
- 1.2. Canada
- 1.3. Mexico
-
2. South America
- 2.1. Brazil
- 2.2. Argentina
- 2.3. Rest of South America
-
3. Europe
- 3.1. United Kingdom
- 3.2. Germany
- 3.3. France
- 3.4. Italy
- 3.5. Spain
- 3.6. Russia
- 3.7. Benelux
- 3.8. Nordics
- 3.9. Rest of Europe
-
4. Middle East & Africa
- 4.1. Turkey
- 4.2. Israel
- 4.3. GCC
- 4.4. North Africa
- 4.5. South Africa
- 4.6. Rest of Middle East & Africa
-
5. Asia Pacific
- 5.1. China
- 5.2. India
- 5.3. Japan
- 5.4. South Korea
- 5.5. ASEAN
- 5.6. Oceania
- 5.7. Rest of Asia Pacific
Household Use Electric Fans REPORT HIGHLIGHTS
| Aspects | Details |
|---|---|
| Study Period | 2019-2033 |
| Base Year | 2024 |
| Estimated Year | 2025 |
| Forecast Period | 2025-2033 |
| Historical Period | 2019-2024 |
| Growth Rate | CAGR of XX% from 2019-2033 |
| Segmentation |
|
Table of Contents
- 1. Introduction
- 1.1. Research Scope
- 1.2. Market Segmentation
- 1.3. Research Methodology
- 1.4. Definitions and Assumptions
- 2. Executive Summary
- 2.1. Introduction
- 3. Market Dynamics
- 3.1. Introduction
- 3.2. Market Drivers
- 3.3. Market Restrains
- 3.4. Market Trends
- 4. Market Factor Analysis
- 4.1. Porters Five Forces
- 4.2. Supply/Value Chain
- 4.3. PESTEL analysis
- 4.4. Market Entropy
- 4.5. Patent/Trademark Analysis
- 5. Global Household Use Electric Fans Analysis, Insights and Forecast, 2019-2031
- 5.1. Market Analysis, Insights and Forecast - by Application
- 5.1.1. Online Sales
- 5.1.2. Offline Sales
- 5.2. Market Analysis, Insights and Forecast - by Types
- 5.2.1. Wall-Mounted Fan
- 5.2.2. Seated Fan
- 5.3. Market Analysis, Insights and Forecast - by Region
- 5.3.1. North America
- 5.3.2. South America
- 5.3.3. Europe
- 5.3.4. Middle East & Africa
- 5.3.5. Asia Pacific
- 5.1. Market Analysis, Insights and Forecast - by Application
- 6. North America Household Use Electric Fans Analysis, Insights and Forecast, 2019-2031
- 6.1. Market Analysis, Insights and Forecast - by Application
- 6.1.1. Online Sales
- 6.1.2. Offline Sales
- 6.2. Market Analysis, Insights and Forecast - by Types
- 6.2.1. Wall-Mounted Fan
- 6.2.2. Seated Fan
- 6.1. Market Analysis, Insights and Forecast - by Application
- 7. South America Household Use Electric Fans Analysis, Insights and Forecast, 2019-2031
- 7.1. Market Analysis, Insights and Forecast - by Application
- 7.1.1. Online Sales
- 7.1.2. Offline Sales
- 7.2. Market Analysis, Insights and Forecast - by Types
- 7.2.1. Wall-Mounted Fan
- 7.2.2. Seated Fan
- 7.1. Market Analysis, Insights and Forecast - by Application
- 8. Europe Household Use Electric Fans Analysis, Insights and Forecast, 2019-2031
- 8.1. Market Analysis, Insights and Forecast - by Application
- 8.1.1. Online Sales
- 8.1.2. Offline Sales
- 8.2. Market Analysis, Insights and Forecast - by Types
- 8.2.1. Wall-Mounted Fan
- 8.2.2. Seated Fan
- 8.1. Market Analysis, Insights and Forecast - by Application
- 9. Middle East & Africa Household Use Electric Fans Analysis, Insights and Forecast, 2019-2031
- 9.1. Market Analysis, Insights and Forecast - by Application
- 9.1.1. Online Sales
- 9.1.2. Offline Sales
- 9.2. Market Analysis, Insights and Forecast - by Types
- 9.2.1. Wall-Mounted Fan
- 9.2.2. Seated Fan
- 9.1. Market Analysis, Insights and Forecast - by Application
- 10. Asia Pacific Household Use Electric Fans Analysis, Insights and Forecast, 2019-2031
- 10.1. Market Analysis, Insights and Forecast - by Application
- 10.1.1. Online Sales
- 10.1.2. Offline Sales
- 10.2. Market Analysis, Insights and Forecast - by Types
- 10.2.1. Wall-Mounted Fan
- 10.2.2. Seated Fan
- 10.1. Market Analysis, Insights and Forecast - by Application
- 11. Competitive Analysis
- 11.1. Global Market Share Analysis 2024
- 11.2. Company Profiles
- 11.2.1 Matthews Fan
- 11.2.1.1. Overview
- 11.2.1.2. Products
- 11.2.1.3. SWOT Analysis
- 11.2.1.4. Recent Developments
- 11.2.1.5. Financials (Based on Availability)
- 11.2.2 Honeywell
- 11.2.2.1. Overview
- 11.2.2.2. Products
- 11.2.2.3. SWOT Analysis
- 11.2.2.4. Recent Developments
- 11.2.2.5. Financials (Based on Availability)
- 11.2.3 Vornado
- 11.2.3.1. Overview
- 11.2.3.2. Products
- 11.2.3.3. SWOT Analysis
- 11.2.3.4. Recent Developments
- 11.2.3.5. Financials (Based on Availability)
- 11.2.4 Hunter Fan Company
- 11.2.4.1. Overview
- 11.2.4.2. Products
- 11.2.4.3. SWOT Analysis
- 11.2.4.4. Recent Developments
- 11.2.4.5. Financials (Based on Availability)
- 11.2.5 Midea Group
- 11.2.5.1. Overview
- 11.2.5.2. Products
- 11.2.5.3. SWOT Analysis
- 11.2.5.4. Recent Developments
- 11.2.5.5. Financials (Based on Availability)
- 11.2.6 Gree Electric Appliances
- 11.2.6.1. Overview
- 11.2.6.2. Products
- 11.2.6.3. SWOT Analysis
- 11.2.6.4. Recent Developments
- 11.2.6.5. Financials (Based on Availability)
- 11.2.7 Havells India
- 11.2.7.1. Overview
- 11.2.7.2. Products
- 11.2.7.3. SWOT Analysis
- 11.2.7.4. Recent Developments
- 11.2.7.5. Financials (Based on Availability)
- 11.2.8 Crompton Greaves
- 11.2.8.1. Overview
- 11.2.8.2. Products
- 11.2.8.3. SWOT Analysis
- 11.2.8.4. Recent Developments
- 11.2.8.5. Financials (Based on Availability)
- 11.2.9 Panasonic
- 11.2.9.1. Overview
- 11.2.9.2. Products
- 11.2.9.3. SWOT Analysis
- 11.2.9.4. Recent Developments
- 11.2.9.5. Financials (Based on Availability)
- 11.2.10 Sharp Corporation
- 11.2.10.1. Overview
- 11.2.10.2. Products
- 11.2.10.3. SWOT Analysis
- 11.2.10.4. Recent Developments
- 11.2.10.5. Financials (Based on Availability)
- 11.2.11 Toshiba
- 11.2.11.1. Overview
- 11.2.11.2. Products
- 11.2.11.3. SWOT Analysis
- 11.2.11.4. Recent Developments
- 11.2.11.5. Financials (Based on Availability)
- 11.2.12 Symphony
- 11.2.12.1. Overview
- 11.2.12.2. Products
- 11.2.12.3. SWOT Analysis
- 11.2.12.4. Recent Developments
- 11.2.12.5. Financials (Based on Availability)
- 11.2.13 Whirlpool
- 11.2.13.1. Overview
- 11.2.13.2. Products
- 11.2.13.3. SWOT Analysis
- 11.2.13.4. Recent Developments
- 11.2.13.5. Financials (Based on Availability)
- 11.2.14 Electrolux
- 11.2.14.1. Overview
- 11.2.14.2. Products
- 11.2.14.3. SWOT Analysis
- 11.2.14.4. Recent Developments
- 11.2.14.5. Financials (Based on Availability)
- 11.2.15 LG
- 11.2.15.1. Overview
- 11.2.15.2. Products
- 11.2.15.3. SWOT Analysis
- 11.2.15.4. Recent Developments
- 11.2.15.5. Financials (Based on Availability)
- 11.2.16 Haier
- 11.2.16.1. Overview
- 11.2.16.2. Products
- 11.2.16.3. SWOT Analysis
- 11.2.16.4. Recent Developments
- 11.2.16.5. Financials (Based on Availability)
- 11.2.17 Midea
- 11.2.17.1. Overview
- 11.2.17.2. Products
- 11.2.17.3. SWOT Analysis
- 11.2.17.4. Recent Developments
- 11.2.17.5. Financials (Based on Availability)
- 11.2.1 Matthews Fan
List of Figures
- Figure 1: Global Household Use Electric Fans Revenue Breakdown (million, %) by Region 2024 & 2032
- Figure 2: North America Household Use Electric Fans Revenue (million), by Application 2024 & 2032
- Figure 3: North America Household Use Electric Fans Revenue Share (%), by Application 2024 & 2032
- Figure 4: North America Household Use Electric Fans Revenue (million), by Types 2024 & 2032
- Figure 5: North America Household Use Electric Fans Revenue Share (%), by Types 2024 & 2032
- Figure 6: North America Household Use Electric Fans Revenue (million), by Country 2024 & 2032
- Figure 7: North America Household Use Electric Fans Revenue Share (%), by Country 2024 & 2032
- Figure 8: South America Household Use Electric Fans Revenue (million), by Application 2024 & 2032
- Figure 9: South America Household Use Electric Fans Revenue Share (%), by Application 2024 & 2032
- Figure 10: South America Household Use Electric Fans Revenue (million), by Types 2024 & 2032
- Figure 11: South America Household Use Electric Fans Revenue Share (%), by Types 2024 & 2032
- Figure 12: South America Household Use Electric Fans Revenue (million), by Country 2024 & 2032
- Figure 13: South America Household Use Electric Fans Revenue Share (%), by Country 2024 & 2032
- Figure 14: Europe Household Use Electric Fans Revenue (million), by Application 2024 & 2032
- Figure 15: Europe Household Use Electric Fans Revenue Share (%), by Application 2024 & 2032
- Figure 16: Europe Household Use Electric Fans Revenue (million), by Types 2024 & 2032
- Figure 17: Europe Household Use Electric Fans Revenue Share (%), by Types 2024 & 2032
- Figure 18: Europe Household Use Electric Fans Revenue (million), by Country 2024 & 2032
- Figure 19: Europe Household Use Electric Fans Revenue Share (%), by Country 2024 & 2032
- Figure 20: Middle East & Africa Household Use Electric Fans Revenue (million), by Application 2024 & 2032
- Figure 21: Middle East & Africa Household Use Electric Fans Revenue Share (%), by Application 2024 & 2032
- Figure 22: Middle East & Africa Household Use Electric Fans Revenue (million), by Types 2024 & 2032
- Figure 23: Middle East & Africa Household Use Electric Fans Revenue Share (%), by Types 2024 & 2032
- Figure 24: Middle East & Africa Household Use Electric Fans Revenue (million), by Country 2024 & 2032
- Figure 25: Middle East & Africa Household Use Electric Fans Revenue Share (%), by Country 2024 & 2032
- Figure 26: Asia Pacific Household Use Electric Fans Revenue (million), by Application 2024 & 2032
- Figure 27: Asia Pacific Household Use Electric Fans Revenue Share (%), by Application 2024 & 2032
- Figure 28: Asia Pacific Household Use Electric Fans Revenue (million), by Types 2024 & 2032
- Figure 29: Asia Pacific Household Use Electric Fans Revenue Share (%), by Types 2024 & 2032
- Figure 30: Asia Pacific Household Use Electric Fans Revenue (million), by Country 2024 & 2032
- Figure 31: Asia Pacific Household Use Electric Fans Revenue Share (%), by Country 2024 & 2032
List of Tables
- Table 1: Global Household Use Electric Fans Revenue million Forecast, by Region 2019 & 2032
- Table 2: Global Household Use Electric Fans Revenue million Forecast, by Application 2019 & 2032
- Table 3: Global Household Use Electric Fans Revenue million Forecast, by Types 2019 & 2032
- Table 4: Global Household Use Electric Fans Revenue million Forecast, by Region 2019 & 2032
- Table 5: Global Household Use Electric Fans Revenue million Forecast, by Application 2019 & 2032
- Table 6: Global Household Use Electric Fans Revenue million Forecast, by Types 2019 & 2032
- Table 7: Global Household Use Electric Fans Revenue million Forecast, by Country 2019 & 2032
- Table 8: United States Household Use Electric Fans Revenue (million) Forecast, by Application 2019 & 2032
- Table 9: Canada Household Use Electric Fans Revenue (million) Forecast, by Application 2019 & 2032
- Table 10: Mexico Household Use Electric Fans Revenue (million) Forecast, by Application 2019 & 2032
- Table 11: Global Household Use Electric Fans Revenue million Forecast, by Application 2019 & 2032
- Table 12: Global Household Use Electric Fans Revenue million Forecast, by Types 2019 & 2032
- Table 13: Global Household Use Electric Fans Revenue million Forecast, by Country 2019 & 2032
- Table 14: Brazil Household Use Electric Fans Revenue (million) Forecast, by Application 2019 & 2032
- Table 15: Argentina Household Use Electric Fans Revenue (million) Forecast, by Application 2019 & 2032
- Table 16: Rest of South America Household Use Electric Fans Revenue (million) Forecast, by Application 2019 & 2032
- Table 17: Global Household Use Electric Fans Revenue million Forecast, by Application 2019 & 2032
- Table 18: Global Household Use Electric Fans Revenue million Forecast, by Types 2019 & 2032
- Table 19: Global Household Use Electric Fans Revenue million Forecast, by Country 2019 & 2032
- Table 20: United Kingdom Household Use Electric Fans Revenue (million) Forecast, by Application 2019 & 2032
- Table 21: Germany Household Use Electric Fans Revenue (million) Forecast, by Application 2019 & 2032
- Table 22: France Household Use Electric Fans Revenue (million) Forecast, by Application 2019 & 2032
- Table 23: Italy Household Use Electric Fans Revenue (million) Forecast, by Application 2019 & 2032
- Table 24: Spain Household Use Electric Fans Revenue (million) Forecast, by Application 2019 & 2032
- Table 25: Russia Household Use Electric Fans Revenue (million) Forecast, by Application 2019 & 2032
- Table 26: Benelux Household Use Electric Fans Revenue (million) Forecast, by Application 2019 & 2032
- Table 27: Nordics Household Use Electric Fans Revenue (million) Forecast, by Application 2019 & 2032
- Table 28: Rest of Europe Household Use Electric Fans Revenue (million) Forecast, by Application 2019 & 2032
- Table 29: Global Household Use Electric Fans Revenue million Forecast, by Application 2019 & 2032
- Table 30: Global Household Use Electric Fans Revenue million Forecast, by Types 2019 & 2032
- Table 31: Global Household Use Electric Fans Revenue million Forecast, by Country 2019 & 2032
- Table 32: Turkey Household Use Electric Fans Revenue (million) Forecast, by Application 2019 & 2032
- Table 33: Israel Household Use Electric Fans Revenue (million) Forecast, by Application 2019 & 2032
- Table 34: GCC Household Use Electric Fans Revenue (million) Forecast, by Application 2019 & 2032
- Table 35: North Africa Household Use Electric Fans Revenue (million) Forecast, by Application 2019 & 2032
- Table 36: South Africa Household Use Electric Fans Revenue (million) Forecast, by Application 2019 & 2032
- Table 37: Rest of Middle East & Africa Household Use Electric Fans Revenue (million) Forecast, by Application 2019 & 2032
- Table 38: Global Household Use Electric Fans Revenue million Forecast, by Application 2019 & 2032
- Table 39: Global Household Use Electric Fans Revenue million Forecast, by Types 2019 & 2032
- Table 40: Global Household Use Electric Fans Revenue million Forecast, by Country 2019 & 2032
- Table 41: China Household Use Electric Fans Revenue (million) Forecast, by Application 2019 & 2032
- Table 42: India Household Use Electric Fans Revenue (million) Forecast, by Application 2019 & 2032
- Table 43: Japan Household Use Electric Fans Revenue (million) Forecast, by Application 2019 & 2032
- Table 44: South Korea Household Use Electric Fans Revenue (million) Forecast, by Application 2019 & 2032
- Table 45: ASEAN Household Use Electric Fans Revenue (million) Forecast, by Application 2019 & 2032
- Table 46: Oceania Household Use Electric Fans Revenue (million) Forecast, by Application 2019 & 2032
- Table 47: Rest of Asia Pacific Household Use Electric Fans Revenue (million) Forecast, by Application 2019 & 2032
Frequently Asked Questions
1. What is the projected Compound Annual Growth Rate (CAGR) of the Household Use Electric Fans?
The projected CAGR is approximately XX%.
2. Which companies are prominent players in the Household Use Electric Fans?
Key companies in the market include Matthews Fan, Honeywell, Vornado, Hunter Fan Company, Midea Group, Gree Electric Appliances, Havells India, Crompton Greaves, Panasonic, Sharp Corporation, Toshiba, Symphony, Whirlpool, Electrolux, LG, Haier, Midea.
3. What are the main segments of the Household Use Electric Fans?
The market segments include Application, Types.
4. Can you provide details about the market size?
The market size is estimated to be USD XXX million as of 2022.
5. What are some drivers contributing to market growth?
N/A
6. What are the notable trends driving market growth?
N/A
7. Are there any restraints impacting market growth?
N/A
8. Can you provide examples of recent developments in the market?
N/A
9. What pricing options are available for accessing the report?
Pricing options include single-user, multi-user, and enterprise licenses priced at USD 2900.00, USD 4350.00, and USD 5800.00 respectively.
10. Is the market size provided in terms of value or volume?
The market size is provided in terms of value, measured in million.
11. Are there any specific market keywords associated with the report?
Yes, the market keyword associated with the report is "Household Use Electric Fans," which aids in identifying and referencing the specific market segment covered.
12. How do I determine which pricing option suits my needs best?
The pricing options vary based on user requirements and access needs. Individual users may opt for single-user licenses, while businesses requiring broader access may choose multi-user or enterprise licenses for cost-effective access to the report.
13. Are there any additional resources or data provided in the Household Use Electric Fans report?
While the report offers comprehensive insights, it's advisable to review the specific contents or supplementary materials provided to ascertain if additional resources or data are available.
14. How can I stay updated on further developments or reports in the Household Use Electric Fans?
To stay informed about further developments, trends, and reports in the Household Use Electric Fans, consider subscribing to industry newsletters, following relevant companies and organizations, or regularly checking reputable industry news sources and publications.
Methodology
Step 1 - Identification of Relevant Samples Size from Population Database


Step 2 - Approaches for Defining Global Market Size (Value, Volume* & Price*)

Note*: In applicable scenarios
Step 3 - Data Sources
Primary Research
- Web Analytics
- Survey Reports
- Research Institute
- Latest Research Reports
- Opinion Leaders
Secondary Research
- Annual Reports
- White Paper
- Latest Press Release
- Industry Association
- Paid Database
- Investor Presentations

Step 4 - Data Triangulation
Involves using different sources of information in order to increase the validity of a study
These sources are likely to be stakeholders in a program - participants, other researchers, program staff, other community members, and so on.
Then we put all data in single framework & apply various statistical tools to find out the dynamic on the market.
During the analysis stage, feedback from the stakeholder groups would be compared to determine areas of agreement as well as areas of divergence
