

Key Insights
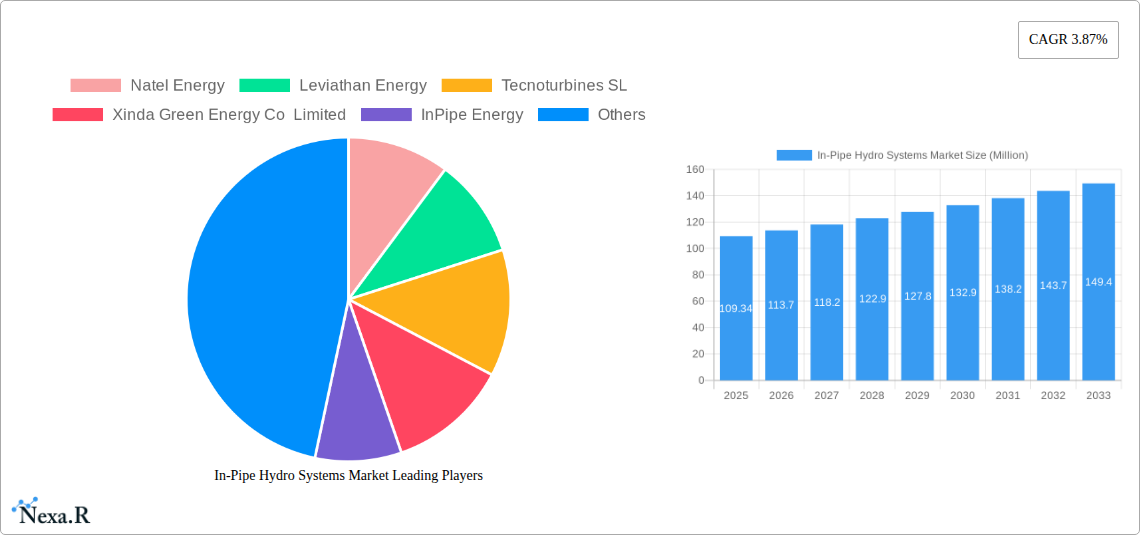
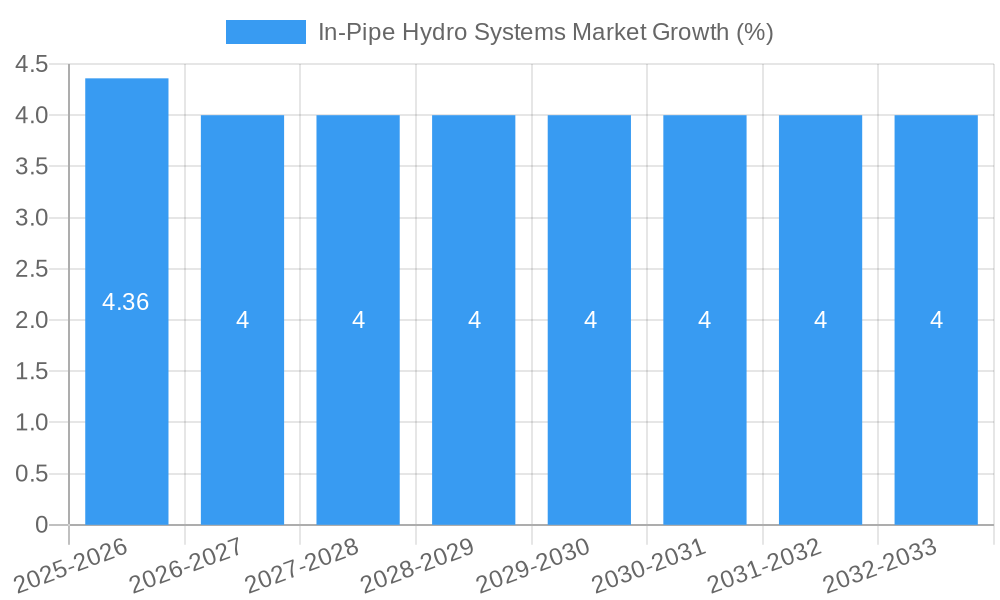
The In-Pipe Hydro Systems market, valued at $109.34 million in 2025, is projected to experience robust growth, driven by increasing demand for sustainable energy solutions and the need for decentralized power generation. A Compound Annual Growth Rate (CAGR) of 3.87% from 2025 to 2033 indicates a steady expansion, reaching an estimated market size exceeding $160 million by 2033. Key growth drivers include stringent environmental regulations promoting renewable energy adoption, rising urbanization leading to increased water infrastructure development, and the cost-effectiveness of in-pipe hydro systems compared to traditional hydropower solutions, particularly in smaller-scale applications. The market segmentation reveals significant opportunities in municipal and industrial water systems, followed by other applications like irrigation and building systems. Within capacity segments, micro-hydro systems (up to 100kW) are expected to hold a substantial market share due to their suitability for various applications and relatively lower installation costs. Geographic analysis indicates strong growth potential in North America and Asia-Pacific regions, fueled by supportive government policies and substantial investments in renewable energy infrastructure. While challenges such as high initial investment costs and technological limitations might restrain growth in the short term, continuous technological advancements and declining manufacturing costs are expected to mitigate these factors over the forecast period.
The competitive landscape features several key players, including Natel Energy, Leviathan Energy, and Tecnoturbines SL, each vying for market dominance through product innovation, strategic partnerships, and geographic expansion. Future growth will likely be influenced by factors such as the development of more efficient and robust technologies, the integration of smart grid technologies for improved energy management, and the increasing availability of financing options to support project development. The focus on sustainable and efficient water management will further contribute to the market's expansion, making in-pipe hydro systems an increasingly attractive option for diverse applications across various geographic regions.
In-Pipe Hydro Systems Market: A Comprehensive Market Report (2019-2033)
This comprehensive report provides an in-depth analysis of the In-Pipe Hydro Systems market, encompassing market dynamics, growth trends, regional dominance, product landscape, key drivers and challenges, emerging opportunities, growth accelerators, key players, and notable milestones. The study period covers 2019-2033, with 2025 as the base and estimated year. The report segments the market by application (Municipal Water or Wastewater Systems, Industrial Water Systems, Other Applications) and capacity (Pico-hydro, Micro-hydro, Mini-hydro), offering a granular view of this burgeoning renewable energy sector. The market is projected to reach xx Million units by 2033.
In-Pipe Hydro Systems Market Dynamics & Structure
The In-Pipe Hydro Systems market is characterized by a moderately concentrated landscape, with key players actively engaged in technological innovation and strategic partnerships. Market concentration is estimated at xx%, driven primarily by a few established players and emerging innovative companies. Technological advancements, particularly in turbine design and energy conversion efficiency, are key drivers. Regulatory frameworks, including government incentives for renewable energy adoption, significantly influence market growth. Competitive substitutes, such as traditional power generation methods, present a challenge, but the increasing focus on sustainability and energy independence is creating favorable conditions for in-pipe hydro systems. End-user demographics are broadening, encompassing municipal water utilities, industrial facilities, and even private entities. M&A activity in this sector is relatively low, with xx deals recorded in the past five years, indicating a growing but still developing market.
- Market Concentration: xx% (2025)
- M&A Deal Volume (2019-2024): xx
- Key Innovation Barriers: High initial investment costs, complex installation processes.
- Regulatory Landscape: Favorable in many regions, driven by renewable energy mandates and carbon reduction targets.
In-Pipe Hydro Systems Market Growth Trends & Insights
The In-Pipe Hydro Systems market experienced significant growth from 2019 to 2024, with a Compound Annual Growth Rate (CAGR) of xx%. This growth is primarily attributed to the rising demand for sustainable and decentralized energy sources, coupled with increasing awareness of the environmental benefits of harnessing hydropower from existing water infrastructure. Technological advancements in turbine design and efficiency have played a significant role in reducing costs and improving performance. The adoption rate of in-pipe hydro systems is gradually increasing, driven by supportive government policies, reduced installation complexities, and improved energy conversion efficiency. Consumer behavior is shifting towards greater acceptance of renewable energy solutions, furthering market adoption. Market penetration stands at xx% in 2025, projected to reach xx% by 2033. Technological disruptions, such as the introduction of more efficient and cost-effective turbines, are expected to accelerate market growth.
Dominant Regions, Countries, or Segments in In-Pipe Hydro Systems Market
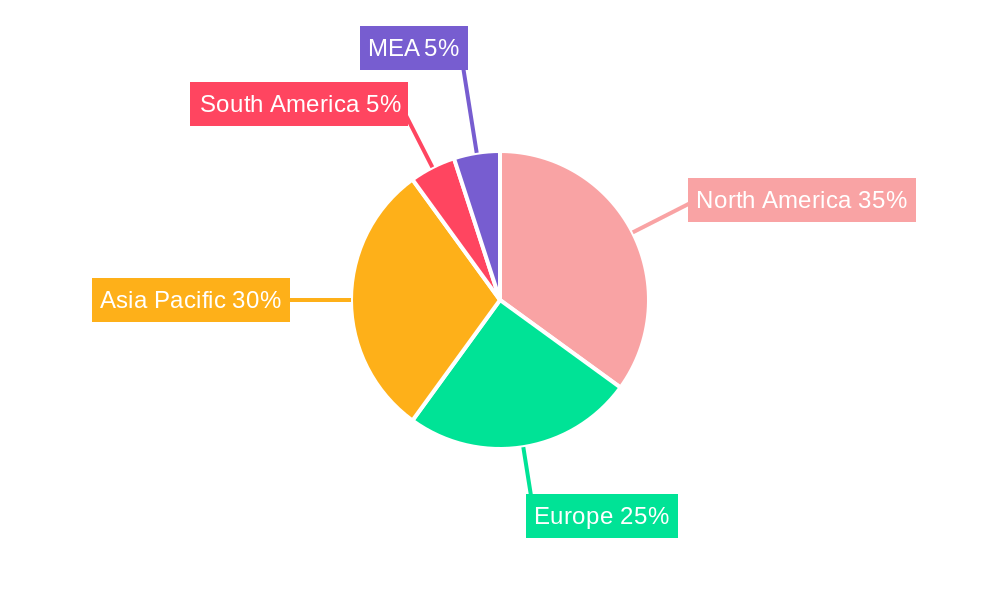
North America currently holds the largest market share, driven by supportive government policies and a robust water infrastructure network. Within this region, the United States is a dominant player, significantly fueled by projects such as the recent EBMUD partnership with InPipe Energy. The European market is also experiencing significant growth, fueled by stringent environmental regulations and a strong focus on renewable energy. Asia-Pacific is an emerging market with considerable growth potential due to its massive population and increasing industrialization. Among applications, Municipal Water or Wastewater Systems accounts for the largest market share (xx%), followed by Industrial Water Systems (xx%). Micro-hydro systems (Up To 100kW) represent the dominant capacity segment (xx%), owing to their relatively lower capital cost and wider applicability.
Key Drivers:
- Supportive government policies (e.g., tax incentives, subsidies)
- Increasing environmental awareness and sustainability goals
- Robust water infrastructure in developed regions
- Growing demand for decentralized energy sources
Regional Dominance: North America (market share xx%), Europe (market share xx%), Asia-Pacific (market share xx%)
Segment Dominance: Municipal Water or Wastewater Systems (xx%), Micro-hydro (Up To 100kW) (xx%)
In-Pipe Hydro Systems Market Product Landscape
The In-Pipe Hydro Systems market offers a variety of products, ranging from small-scale pico-hydro systems suitable for residential applications to large-scale mini-hydro systems for industrial use. Recent innovations focus on improving energy conversion efficiency, reducing installation complexity, and enhancing system durability. Key technological advancements include the development of more efficient turbines, advanced pressure regulation mechanisms, and intelligent monitoring systems. Unique selling propositions often highlight the low environmental impact, cost-effectiveness in managing pressure, and reliable, clean energy production.
Key Drivers, Barriers & Challenges in In-Pipe Hydro Systems Market
Key Drivers: The increasing demand for clean energy sources, coupled with government incentives and supportive regulations, are key drivers. Technological advancements are also contributing to cost reduction and improved efficiency, making the technology more accessible and appealing. Furthermore, the need for decentralized energy solutions, particularly in remote areas, presents a significant growth opportunity.
Key Challenges: High initial investment costs can be a barrier to entry for smaller players. Complex installation processes and the need for specialized expertise pose challenges. Competition from other renewable energy sources and traditional power generation methods also impacts market growth. Supply chain disruptions, particularly for specialized components, can lead to delays and increased costs. Regulatory hurdles and permitting processes can also slow down project implementation.
Emerging Opportunities in In-Pipe Hydro Systems Market
Untapped markets in developing countries with extensive water infrastructure offer substantial growth opportunities. Innovative applications, such as integrating in-pipe hydro systems with smart water management systems, present further potential. Evolving consumer preferences for sustainable solutions and increasing focus on energy independence are driving market growth. The integration of in-pipe hydro systems with other renewable energy sources, creating hybrid energy solutions, is an emerging opportunity. Furthermore, the development of modular and scalable systems caters to various needs and minimizes installation complexity.
Growth Accelerators in the In-Pipe Hydro Systems Market Industry
Technological breakthroughs, particularly in improving turbine efficiency and reducing system costs, are accelerating market growth. Strategic partnerships between technology providers and infrastructure owners facilitate faster deployment and market penetration. Expansion strategies, including entering new geographical markets and developing new applications, are driving market expansion. Government initiatives and policy support significantly enhance market growth.
Key Players Shaping the In-Pipe Hydro Systems Market Market
- Natel Energy
- Leviathan Energy
- Tecnoturbines SL
- Xinda Green Energy Co Limited
- InPipe Energy
- HS Dynamic Energy Co Ltd
- GS-Hydro
- Rentricity Inc
- Lucid Energy Inc
Notable Milestones in In-Pipe Hydro Systems Market Sector
- December 2023: The East Bay Municipal Utility District (EBMUD) partnered with InPipe Energy, marking the first installation of InPipe technology in California. This demonstrates growing acceptance and market validation for in-pipe hydro.
- July 2022: InPipe Energy launched the HydroXS, a new generation of micro-hydro energy recovery technology, showcasing technological advancements and increased product offerings.
In-Depth In-Pipe Hydro Systems Market Market Outlook
The future of the In-Pipe Hydro Systems market is bright, with continued growth driven by factors such as increasing demand for renewable energy, technological advancements, and supportive government policies. Strategic opportunities lie in exploring untapped markets, fostering innovative applications, and forging strong partnerships across the value chain. The market is poised for substantial expansion, driven by the inherent sustainability and cost-effectiveness of harnessing hydropower from existing water infrastructure. The focus on enhancing efficiency, reducing installation complexities, and expanding product offerings will further propel the market’s trajectory.
In-Pipe Hydro Systems Market Segmentation
-
1. Application
- 1.1. Municipal Water or Wastewater Systems
- 1.2. Industrial Water Systems
- 1.3. Other Ap
-
2. Capacity
- 2.1. Pico-hydro (Up To 5kW)
- 2.2. Micro-hydro (Up To 100kW)
- 2.3. Mini-hydro (100kW and Above)
In-Pipe Hydro Systems Market Segmentation By Geography
-
1. North America
- 1.1. United States
- 1.2. Canada
- 1.3. Rest of North America
-
2. Asia Pacific
- 2.1. China
- 2.2. Japan
- 2.3. South Korea
- 2.4. India
- 2.5. Malaysia
- 2.6. Thailand
- 2.7. Indonesia
- 2.8. Vietnam
- 2.9. Rest of Asia Pacific
-
3. Europe
- 3.1. United Kingdom
- 3.2. Germany
- 3.3. France
- 3.4. Italy
- 3.5. Spain
- 3.6. Nordic Countries
- 3.7. Turkey
- 3.8. Russia
- 3.9. Rest of Europe
-
4. South America
- 4.1. Brazil
- 4.2. Argentina
- 4.3. Colombia
- 4.4. Rest of South America
-
5. Middle East and Africa
- 5.1. Saudi Arabia
- 5.2. United Arab Emirates
- 5.3. Nigeria
- 5.4. Qatar
- 5.5. Egypt
- 5.6. Rest of Middle East and Africa
In-Pipe Hydro Systems Market REPORT HIGHLIGHTS
| Aspects | Details |
|---|---|
| Study Period | 2019-2033 |
| Base Year | 2024 |
| Estimated Year | 2025 |
| Forecast Period | 2025-2033 |
| Historical Period | 2019-2024 |
| Growth Rate | CAGR of 3.87% from 2019-2033 |
| Segmentation |
|
Table of Contents
- 1. Introduction
- 1.1. Research Scope
- 1.2. Market Segmentation
- 1.3. Research Methodology
- 1.4. Definitions and Assumptions
- 2. Executive Summary
- 2.1. Introduction
- 3. Market Dynamics
- 3.1. Introduction
- 3.2. Market Drivers
- 3.2.1. Increased Focus on Renewable Power Generation4.; Rising Need for Efficient Power Generation
- 3.3. Market Restrains
- 3.3.1. High Initial Capital Investment
- 3.4. Market Trends
- 3.4.1. Industrial Water Systems to Witness Significant Demand
- 4. Market Factor Analysis
- 4.1. Porters Five Forces
- 4.2. Supply/Value Chain
- 4.3. PESTEL analysis
- 4.4. Market Entropy
- 4.5. Patent/Trademark Analysis
- 5. Global In-Pipe Hydro Systems Market Analysis, Insights and Forecast, 2019-2031
- 5.1. Market Analysis, Insights and Forecast - by Application
- 5.1.1. Municipal Water or Wastewater Systems
- 5.1.2. Industrial Water Systems
- 5.1.3. Other Ap
- 5.2. Market Analysis, Insights and Forecast - by Capacity
- 5.2.1. Pico-hydro (Up To 5kW)
- 5.2.2. Micro-hydro (Up To 100kW)
- 5.2.3. Mini-hydro (100kW and Above)
- 5.3. Market Analysis, Insights and Forecast - by Region
- 5.3.1. North America
- 5.3.2. Asia Pacific
- 5.3.3. Europe
- 5.3.4. South America
- 5.3.5. Middle East and Africa
- 5.1. Market Analysis, Insights and Forecast - by Application
- 6. North America In-Pipe Hydro Systems Market Analysis, Insights and Forecast, 2019-2031
- 6.1. Market Analysis, Insights and Forecast - by Application
- 6.1.1. Municipal Water or Wastewater Systems
- 6.1.2. Industrial Water Systems
- 6.1.3. Other Ap
- 6.2. Market Analysis, Insights and Forecast - by Capacity
- 6.2.1. Pico-hydro (Up To 5kW)
- 6.2.2. Micro-hydro (Up To 100kW)
- 6.2.3. Mini-hydro (100kW and Above)
- 6.1. Market Analysis, Insights and Forecast - by Application
- 7. Asia Pacific In-Pipe Hydro Systems Market Analysis, Insights and Forecast, 2019-2031
- 7.1. Market Analysis, Insights and Forecast - by Application
- 7.1.1. Municipal Water or Wastewater Systems
- 7.1.2. Industrial Water Systems
- 7.1.3. Other Ap
- 7.2. Market Analysis, Insights and Forecast - by Capacity
- 7.2.1. Pico-hydro (Up To 5kW)
- 7.2.2. Micro-hydro (Up To 100kW)
- 7.2.3. Mini-hydro (100kW and Above)
- 7.1. Market Analysis, Insights and Forecast - by Application
- 8. Europe In-Pipe Hydro Systems Market Analysis, Insights and Forecast, 2019-2031
- 8.1. Market Analysis, Insights and Forecast - by Application
- 8.1.1. Municipal Water or Wastewater Systems
- 8.1.2. Industrial Water Systems
- 8.1.3. Other Ap
- 8.2. Market Analysis, Insights and Forecast - by Capacity
- 8.2.1. Pico-hydro (Up To 5kW)
- 8.2.2. Micro-hydro (Up To 100kW)
- 8.2.3. Mini-hydro (100kW and Above)
- 8.1. Market Analysis, Insights and Forecast - by Application
- 9. South America In-Pipe Hydro Systems Market Analysis, Insights and Forecast, 2019-2031
- 9.1. Market Analysis, Insights and Forecast - by Application
- 9.1.1. Municipal Water or Wastewater Systems
- 9.1.2. Industrial Water Systems
- 9.1.3. Other Ap
- 9.2. Market Analysis, Insights and Forecast - by Capacity
- 9.2.1. Pico-hydro (Up To 5kW)
- 9.2.2. Micro-hydro (Up To 100kW)
- 9.2.3. Mini-hydro (100kW and Above)
- 9.1. Market Analysis, Insights and Forecast - by Application
- 10. Middle East and Africa In-Pipe Hydro Systems Market Analysis, Insights and Forecast, 2019-2031
- 10.1. Market Analysis, Insights and Forecast - by Application
- 10.1.1. Municipal Water or Wastewater Systems
- 10.1.2. Industrial Water Systems
- 10.1.3. Other Ap
- 10.2. Market Analysis, Insights and Forecast - by Capacity
- 10.2.1. Pico-hydro (Up To 5kW)
- 10.2.2. Micro-hydro (Up To 100kW)
- 10.2.3. Mini-hydro (100kW and Above)
- 10.1. Market Analysis, Insights and Forecast - by Application
- 11. North America In-Pipe Hydro Systems Market Analysis, Insights and Forecast, 2019-2031
- 11.1. Market Analysis, Insights and Forecast - By Country/Sub-region
- 11.1.1 United States
- 11.1.2 Canada
- 11.1.3 Mexico
- 12. Europe In-Pipe Hydro Systems Market Analysis, Insights and Forecast, 2019-2031
- 12.1. Market Analysis, Insights and Forecast - By Country/Sub-region
- 12.1.1 Germany
- 12.1.2 United Kingdom
- 12.1.3 France
- 12.1.4 Spain
- 12.1.5 Italy
- 12.1.6 Spain
- 12.1.7 Belgium
- 12.1.8 Netherland
- 12.1.9 Nordics
- 12.1.10 Rest of Europe
- 13. Asia Pacific In-Pipe Hydro Systems Market Analysis, Insights and Forecast, 2019-2031
- 13.1. Market Analysis, Insights and Forecast - By Country/Sub-region
- 13.1.1 China
- 13.1.2 Japan
- 13.1.3 India
- 13.1.4 South Korea
- 13.1.5 Southeast Asia
- 13.1.6 Australia
- 13.1.7 Indonesia
- 13.1.8 Phillipes
- 13.1.9 Singapore
- 13.1.10 Thailandc
- 13.1.11 Rest of Asia Pacific
- 14. South America In-Pipe Hydro Systems Market Analysis, Insights and Forecast, 2019-2031
- 14.1. Market Analysis, Insights and Forecast - By Country/Sub-region
- 14.1.1 Brazil
- 14.1.2 Argentina
- 14.1.3 Peru
- 14.1.4 Chile
- 14.1.5 Colombia
- 14.1.6 Ecuador
- 14.1.7 Venezuela
- 14.1.8 Rest of South America
- 15. MEA In-Pipe Hydro Systems Market Analysis, Insights and Forecast, 2019-2031
- 15.1. Market Analysis, Insights and Forecast - By Country/Sub-region
- 15.1.1 United Arab Emirates
- 15.1.2 Saudi Arabia
- 15.1.3 South Africa
- 15.1.4 Rest of Middle East and Africa
- 16. Competitive Analysis
- 16.1. Global Market Share Analysis 2024
- 16.2. Company Profiles
- 16.2.1 Natel Energy
- 16.2.1.1. Overview
- 16.2.1.2. Products
- 16.2.1.3. SWOT Analysis
- 16.2.1.4. Recent Developments
- 16.2.1.5. Financials (Based on Availability)
- 16.2.2 Leviathan Energy
- 16.2.2.1. Overview
- 16.2.2.2. Products
- 16.2.2.3. SWOT Analysis
- 16.2.2.4. Recent Developments
- 16.2.2.5. Financials (Based on Availability)
- 16.2.3 Tecnoturbines SL
- 16.2.3.1. Overview
- 16.2.3.2. Products
- 16.2.3.3. SWOT Analysis
- 16.2.3.4. Recent Developments
- 16.2.3.5. Financials (Based on Availability)
- 16.2.4 Xinda Green Energy Co Limited
- 16.2.4.1. Overview
- 16.2.4.2. Products
- 16.2.4.3. SWOT Analysis
- 16.2.4.4. Recent Developments
- 16.2.4.5. Financials (Based on Availability)
- 16.2.5 InPipe Energy
- 16.2.5.1. Overview
- 16.2.5.2. Products
- 16.2.5.3. SWOT Analysis
- 16.2.5.4. Recent Developments
- 16.2.5.5. Financials (Based on Availability)
- 16.2.6 HS Dynamic Energy Co Ltd
- 16.2.6.1. Overview
- 16.2.6.2. Products
- 16.2.6.3. SWOT Analysis
- 16.2.6.4. Recent Developments
- 16.2.6.5. Financials (Based on Availability)
- 16.2.7 GS-Hydro
- 16.2.7.1. Overview
- 16.2.7.2. Products
- 16.2.7.3. SWOT Analysis
- 16.2.7.4. Recent Developments
- 16.2.7.5. Financials (Based on Availability)
- 16.2.8 Rentricity Inc
- 16.2.8.1. Overview
- 16.2.8.2. Products
- 16.2.8.3. SWOT Analysis
- 16.2.8.4. Recent Developments
- 16.2.8.5. Financials (Based on Availability)
- 16.2.9 Lucid Energy Inc
- 16.2.9.1. Overview
- 16.2.9.2. Products
- 16.2.9.3. SWOT Analysis
- 16.2.9.4. Recent Developments
- 16.2.9.5. Financials (Based on Availability)
- 16.2.1 Natel Energy
List of Figures
- Figure 1: Global In-Pipe Hydro Systems Market Revenue Breakdown (Million, %) by Region 2024 & 2032
- Figure 2: North America In-Pipe Hydro Systems Market Revenue (Million), by Country 2024 & 2032
- Figure 3: North America In-Pipe Hydro Systems Market Revenue Share (%), by Country 2024 & 2032
- Figure 4: Europe In-Pipe Hydro Systems Market Revenue (Million), by Country 2024 & 2032
- Figure 5: Europe In-Pipe Hydro Systems Market Revenue Share (%), by Country 2024 & 2032
- Figure 6: Asia Pacific In-Pipe Hydro Systems Market Revenue (Million), by Country 2024 & 2032
- Figure 7: Asia Pacific In-Pipe Hydro Systems Market Revenue Share (%), by Country 2024 & 2032
- Figure 8: South America In-Pipe Hydro Systems Market Revenue (Million), by Country 2024 & 2032
- Figure 9: South America In-Pipe Hydro Systems Market Revenue Share (%), by Country 2024 & 2032
- Figure 10: MEA In-Pipe Hydro Systems Market Revenue (Million), by Country 2024 & 2032
- Figure 11: MEA In-Pipe Hydro Systems Market Revenue Share (%), by Country 2024 & 2032
- Figure 12: North America In-Pipe Hydro Systems Market Revenue (Million), by Application 2024 & 2032
- Figure 13: North America In-Pipe Hydro Systems Market Revenue Share (%), by Application 2024 & 2032
- Figure 14: North America In-Pipe Hydro Systems Market Revenue (Million), by Capacity 2024 & 2032
- Figure 15: North America In-Pipe Hydro Systems Market Revenue Share (%), by Capacity 2024 & 2032
- Figure 16: North America In-Pipe Hydro Systems Market Revenue (Million), by Country 2024 & 2032
- Figure 17: North America In-Pipe Hydro Systems Market Revenue Share (%), by Country 2024 & 2032
- Figure 18: Asia Pacific In-Pipe Hydro Systems Market Revenue (Million), by Application 2024 & 2032
- Figure 19: Asia Pacific In-Pipe Hydro Systems Market Revenue Share (%), by Application 2024 & 2032
- Figure 20: Asia Pacific In-Pipe Hydro Systems Market Revenue (Million), by Capacity 2024 & 2032
- Figure 21: Asia Pacific In-Pipe Hydro Systems Market Revenue Share (%), by Capacity 2024 & 2032
- Figure 22: Asia Pacific In-Pipe Hydro Systems Market Revenue (Million), by Country 2024 & 2032
- Figure 23: Asia Pacific In-Pipe Hydro Systems Market Revenue Share (%), by Country 2024 & 2032
- Figure 24: Europe In-Pipe Hydro Systems Market Revenue (Million), by Application 2024 & 2032
- Figure 25: Europe In-Pipe Hydro Systems Market Revenue Share (%), by Application 2024 & 2032
- Figure 26: Europe In-Pipe Hydro Systems Market Revenue (Million), by Capacity 2024 & 2032
- Figure 27: Europe In-Pipe Hydro Systems Market Revenue Share (%), by Capacity 2024 & 2032
- Figure 28: Europe In-Pipe Hydro Systems Market Revenue (Million), by Country 2024 & 2032
- Figure 29: Europe In-Pipe Hydro Systems Market Revenue Share (%), by Country 2024 & 2032
- Figure 30: South America In-Pipe Hydro Systems Market Revenue (Million), by Application 2024 & 2032
- Figure 31: South America In-Pipe Hydro Systems Market Revenue Share (%), by Application 2024 & 2032
- Figure 32: South America In-Pipe Hydro Systems Market Revenue (Million), by Capacity 2024 & 2032
- Figure 33: South America In-Pipe Hydro Systems Market Revenue Share (%), by Capacity 2024 & 2032
- Figure 34: South America In-Pipe Hydro Systems Market Revenue (Million), by Country 2024 & 2032
- Figure 35: South America In-Pipe Hydro Systems Market Revenue Share (%), by Country 2024 & 2032
- Figure 36: Middle East and Africa In-Pipe Hydro Systems Market Revenue (Million), by Application 2024 & 2032
- Figure 37: Middle East and Africa In-Pipe Hydro Systems Market Revenue Share (%), by Application 2024 & 2032
- Figure 38: Middle East and Africa In-Pipe Hydro Systems Market Revenue (Million), by Capacity 2024 & 2032
- Figure 39: Middle East and Africa In-Pipe Hydro Systems Market Revenue Share (%), by Capacity 2024 & 2032
- Figure 40: Middle East and Africa In-Pipe Hydro Systems Market Revenue (Million), by Country 2024 & 2032
- Figure 41: Middle East and Africa In-Pipe Hydro Systems Market Revenue Share (%), by Country 2024 & 2032
List of Tables
- Table 1: Global In-Pipe Hydro Systems Market Revenue Million Forecast, by Region 2019 & 2032
- Table 2: Global In-Pipe Hydro Systems Market Revenue Million Forecast, by Application 2019 & 2032
- Table 3: Global In-Pipe Hydro Systems Market Revenue Million Forecast, by Capacity 2019 & 2032
- Table 4: Global In-Pipe Hydro Systems Market Revenue Million Forecast, by Region 2019 & 2032
- Table 5: Global In-Pipe Hydro Systems Market Revenue Million Forecast, by Country 2019 & 2032
- Table 6: United States In-Pipe Hydro Systems Market Revenue (Million) Forecast, by Application 2019 & 2032
- Table 7: Canada In-Pipe Hydro Systems Market Revenue (Million) Forecast, by Application 2019 & 2032
- Table 8: Mexico In-Pipe Hydro Systems Market Revenue (Million) Forecast, by Application 2019 & 2032
- Table 9: Global In-Pipe Hydro Systems Market Revenue Million Forecast, by Country 2019 & 2032
- Table 10: Germany In-Pipe Hydro Systems Market Revenue (Million) Forecast, by Application 2019 & 2032
- Table 11: United Kingdom In-Pipe Hydro Systems Market Revenue (Million) Forecast, by Application 2019 & 2032
- Table 12: France In-Pipe Hydro Systems Market Revenue (Million) Forecast, by Application 2019 & 2032
- Table 13: Spain In-Pipe Hydro Systems Market Revenue (Million) Forecast, by Application 2019 & 2032
- Table 14: Italy In-Pipe Hydro Systems Market Revenue (Million) Forecast, by Application 2019 & 2032
- Table 15: Spain In-Pipe Hydro Systems Market Revenue (Million) Forecast, by Application 2019 & 2032
- Table 16: Belgium In-Pipe Hydro Systems Market Revenue (Million) Forecast, by Application 2019 & 2032
- Table 17: Netherland In-Pipe Hydro Systems Market Revenue (Million) Forecast, by Application 2019 & 2032
- Table 18: Nordics In-Pipe Hydro Systems Market Revenue (Million) Forecast, by Application 2019 & 2032
- Table 19: Rest of Europe In-Pipe Hydro Systems Market Revenue (Million) Forecast, by Application 2019 & 2032
- Table 20: Global In-Pipe Hydro Systems Market Revenue Million Forecast, by Country 2019 & 2032
- Table 21: China In-Pipe Hydro Systems Market Revenue (Million) Forecast, by Application 2019 & 2032
- Table 22: Japan In-Pipe Hydro Systems Market Revenue (Million) Forecast, by Application 2019 & 2032
- Table 23: India In-Pipe Hydro Systems Market Revenue (Million) Forecast, by Application 2019 & 2032
- Table 24: South Korea In-Pipe Hydro Systems Market Revenue (Million) Forecast, by Application 2019 & 2032
- Table 25: Southeast Asia In-Pipe Hydro Systems Market Revenue (Million) Forecast, by Application 2019 & 2032
- Table 26: Australia In-Pipe Hydro Systems Market Revenue (Million) Forecast, by Application 2019 & 2032
- Table 27: Indonesia In-Pipe Hydro Systems Market Revenue (Million) Forecast, by Application 2019 & 2032
- Table 28: Phillipes In-Pipe Hydro Systems Market Revenue (Million) Forecast, by Application 2019 & 2032
- Table 29: Singapore In-Pipe Hydro Systems Market Revenue (Million) Forecast, by Application 2019 & 2032
- Table 30: Thailandc In-Pipe Hydro Systems Market Revenue (Million) Forecast, by Application 2019 & 2032
- Table 31: Rest of Asia Pacific In-Pipe Hydro Systems Market Revenue (Million) Forecast, by Application 2019 & 2032
- Table 32: Global In-Pipe Hydro Systems Market Revenue Million Forecast, by Country 2019 & 2032
- Table 33: Brazil In-Pipe Hydro Systems Market Revenue (Million) Forecast, by Application 2019 & 2032
- Table 34: Argentina In-Pipe Hydro Systems Market Revenue (Million) Forecast, by Application 2019 & 2032
- Table 35: Peru In-Pipe Hydro Systems Market Revenue (Million) Forecast, by Application 2019 & 2032
- Table 36: Chile In-Pipe Hydro Systems Market Revenue (Million) Forecast, by Application 2019 & 2032
- Table 37: Colombia In-Pipe Hydro Systems Market Revenue (Million) Forecast, by Application 2019 & 2032
- Table 38: Ecuador In-Pipe Hydro Systems Market Revenue (Million) Forecast, by Application 2019 & 2032
- Table 39: Venezuela In-Pipe Hydro Systems Market Revenue (Million) Forecast, by Application 2019 & 2032
- Table 40: Rest of South America In-Pipe Hydro Systems Market Revenue (Million) Forecast, by Application 2019 & 2032
- Table 41: Global In-Pipe Hydro Systems Market Revenue Million Forecast, by Country 2019 & 2032
- Table 42: United Arab Emirates In-Pipe Hydro Systems Market Revenue (Million) Forecast, by Application 2019 & 2032
- Table 43: Saudi Arabia In-Pipe Hydro Systems Market Revenue (Million) Forecast, by Application 2019 & 2032
- Table 44: South Africa In-Pipe Hydro Systems Market Revenue (Million) Forecast, by Application 2019 & 2032
- Table 45: Rest of Middle East and Africa In-Pipe Hydro Systems Market Revenue (Million) Forecast, by Application 2019 & 2032
- Table 46: Global In-Pipe Hydro Systems Market Revenue Million Forecast, by Application 2019 & 2032
- Table 47: Global In-Pipe Hydro Systems Market Revenue Million Forecast, by Capacity 2019 & 2032
- Table 48: Global In-Pipe Hydro Systems Market Revenue Million Forecast, by Country 2019 & 2032
- Table 49: United States In-Pipe Hydro Systems Market Revenue (Million) Forecast, by Application 2019 & 2032
- Table 50: Canada In-Pipe Hydro Systems Market Revenue (Million) Forecast, by Application 2019 & 2032
- Table 51: Rest of North America In-Pipe Hydro Systems Market Revenue (Million) Forecast, by Application 2019 & 2032
- Table 52: Global In-Pipe Hydro Systems Market Revenue Million Forecast, by Application 2019 & 2032
- Table 53: Global In-Pipe Hydro Systems Market Revenue Million Forecast, by Capacity 2019 & 2032
- Table 54: Global In-Pipe Hydro Systems Market Revenue Million Forecast, by Country 2019 & 2032
- Table 55: China In-Pipe Hydro Systems Market Revenue (Million) Forecast, by Application 2019 & 2032
- Table 56: Japan In-Pipe Hydro Systems Market Revenue (Million) Forecast, by Application 2019 & 2032
- Table 57: South Korea In-Pipe Hydro Systems Market Revenue (Million) Forecast, by Application 2019 & 2032
- Table 58: India In-Pipe Hydro Systems Market Revenue (Million) Forecast, by Application 2019 & 2032
- Table 59: Malaysia In-Pipe Hydro Systems Market Revenue (Million) Forecast, by Application 2019 & 2032
- Table 60: Thailand In-Pipe Hydro Systems Market Revenue (Million) Forecast, by Application 2019 & 2032
- Table 61: Indonesia In-Pipe Hydro Systems Market Revenue (Million) Forecast, by Application 2019 & 2032
- Table 62: Vietnam In-Pipe Hydro Systems Market Revenue (Million) Forecast, by Application 2019 & 2032
- Table 63: Rest of Asia Pacific In-Pipe Hydro Systems Market Revenue (Million) Forecast, by Application 2019 & 2032
- Table 64: Global In-Pipe Hydro Systems Market Revenue Million Forecast, by Application 2019 & 2032
- Table 65: Global In-Pipe Hydro Systems Market Revenue Million Forecast, by Capacity 2019 & 2032
- Table 66: Global In-Pipe Hydro Systems Market Revenue Million Forecast, by Country 2019 & 2032
- Table 67: United Kingdom In-Pipe Hydro Systems Market Revenue (Million) Forecast, by Application 2019 & 2032
- Table 68: Germany In-Pipe Hydro Systems Market Revenue (Million) Forecast, by Application 2019 & 2032
- Table 69: France In-Pipe Hydro Systems Market Revenue (Million) Forecast, by Application 2019 & 2032
- Table 70: Italy In-Pipe Hydro Systems Market Revenue (Million) Forecast, by Application 2019 & 2032
- Table 71: Spain In-Pipe Hydro Systems Market Revenue (Million) Forecast, by Application 2019 & 2032
- Table 72: Nordic Countries In-Pipe Hydro Systems Market Revenue (Million) Forecast, by Application 2019 & 2032
- Table 73: Turkey In-Pipe Hydro Systems Market Revenue (Million) Forecast, by Application 2019 & 2032
- Table 74: Russia In-Pipe Hydro Systems Market Revenue (Million) Forecast, by Application 2019 & 2032
- Table 75: Rest of Europe In-Pipe Hydro Systems Market Revenue (Million) Forecast, by Application 2019 & 2032
- Table 76: Global In-Pipe Hydro Systems Market Revenue Million Forecast, by Application 2019 & 2032
- Table 77: Global In-Pipe Hydro Systems Market Revenue Million Forecast, by Capacity 2019 & 2032
- Table 78: Global In-Pipe Hydro Systems Market Revenue Million Forecast, by Country 2019 & 2032
- Table 79: Brazil In-Pipe Hydro Systems Market Revenue (Million) Forecast, by Application 2019 & 2032
- Table 80: Argentina In-Pipe Hydro Systems Market Revenue (Million) Forecast, by Application 2019 & 2032
- Table 81: Colombia In-Pipe Hydro Systems Market Revenue (Million) Forecast, by Application 2019 & 2032
- Table 82: Rest of South America In-Pipe Hydro Systems Market Revenue (Million) Forecast, by Application 2019 & 2032
- Table 83: Global In-Pipe Hydro Systems Market Revenue Million Forecast, by Application 2019 & 2032
- Table 84: Global In-Pipe Hydro Systems Market Revenue Million Forecast, by Capacity 2019 & 2032
- Table 85: Global In-Pipe Hydro Systems Market Revenue Million Forecast, by Country 2019 & 2032
- Table 86: Saudi Arabia In-Pipe Hydro Systems Market Revenue (Million) Forecast, by Application 2019 & 2032
- Table 87: United Arab Emirates In-Pipe Hydro Systems Market Revenue (Million) Forecast, by Application 2019 & 2032
- Table 88: Nigeria In-Pipe Hydro Systems Market Revenue (Million) Forecast, by Application 2019 & 2032
- Table 89: Qatar In-Pipe Hydro Systems Market Revenue (Million) Forecast, by Application 2019 & 2032
- Table 90: Egypt In-Pipe Hydro Systems Market Revenue (Million) Forecast, by Application 2019 & 2032
- Table 91: Rest of Middle East and Africa In-Pipe Hydro Systems Market Revenue (Million) Forecast, by Application 2019 & 2032
Frequently Asked Questions
1. What is the projected Compound Annual Growth Rate (CAGR) of the In-Pipe Hydro Systems Market?
The projected CAGR is approximately 3.87%.
2. Which companies are prominent players in the In-Pipe Hydro Systems Market?
Key companies in the market include Natel Energy, Leviathan Energy, Tecnoturbines SL, Xinda Green Energy Co Limited, InPipe Energy, HS Dynamic Energy Co Ltd, GS-Hydro, Rentricity Inc, Lucid Energy Inc.
3. What are the main segments of the In-Pipe Hydro Systems Market?
The market segments include Application, Capacity.
4. Can you provide details about the market size?
The market size is estimated to be USD 109.34 Million as of 2022.
5. What are some drivers contributing to market growth?
Increased Focus on Renewable Power Generation4.; Rising Need for Efficient Power Generation.
6. What are the notable trends driving market growth?
Industrial Water Systems to Witness Significant Demand.
7. Are there any restraints impacting market growth?
High Initial Capital Investment.
8. Can you provide examples of recent developments in the market?
December 2023: The East Bay Municipal Utility District (EBMUD) partnered with InPipe Energy to generate electricity from the flow of water in its water distribution system. According to a release, this is the first installation of the InPipe technology in California. The new in-conduit hydroelectric system works similarly to traditional pressure-regulating valves in EBMUD’s water distribution system. However, it uses a turbine to reduce water pressure while generating electricity and creating a reliable, clean source of power.
9. What pricing options are available for accessing the report?
Pricing options include single-user, multi-user, and enterprise licenses priced at USD 4750, USD 5250, and USD 8750 respectively.
10. Is the market size provided in terms of value or volume?
The market size is provided in terms of value, measured in Million.
11. Are there any specific market keywords associated with the report?
Yes, the market keyword associated with the report is "In-Pipe Hydro Systems Market," which aids in identifying and referencing the specific market segment covered.
12. How do I determine which pricing option suits my needs best?
The pricing options vary based on user requirements and access needs. Individual users may opt for single-user licenses, while businesses requiring broader access may choose multi-user or enterprise licenses for cost-effective access to the report.
13. Are there any additional resources or data provided in the In-Pipe Hydro Systems Market report?
While the report offers comprehensive insights, it's advisable to review the specific contents or supplementary materials provided to ascertain if additional resources or data are available.
14. How can I stay updated on further developments or reports in the In-Pipe Hydro Systems Market?
To stay informed about further developments, trends, and reports in the In-Pipe Hydro Systems Market, consider subscribing to industry newsletters, following relevant companies and organizations, or regularly checking reputable industry news sources and publications.
Methodology
Step 1 - Identification of Relevant Samples Size from Population Database


Step 2 - Approaches for Defining Global Market Size (Value, Volume* & Price*)

Note*: In applicable scenarios
Step 3 - Data Sources
Primary Research
- Web Analytics
- Survey Reports
- Research Institute
- Latest Research Reports
- Opinion Leaders
Secondary Research
- Annual Reports
- White Paper
- Latest Press Release
- Industry Association
- Paid Database
- Investor Presentations

Step 4 - Data Triangulation
Involves using different sources of information in order to increase the validity of a study
These sources are likely to be stakeholders in a program - participants, other researchers, program staff, other community members, and so on.
Then we put all data in single framework & apply various statistical tools to find out the dynamic on the market.
During the analysis stage, feedback from the stakeholder groups would be compared to determine areas of agreement as well as areas of divergence
