

Key Insights
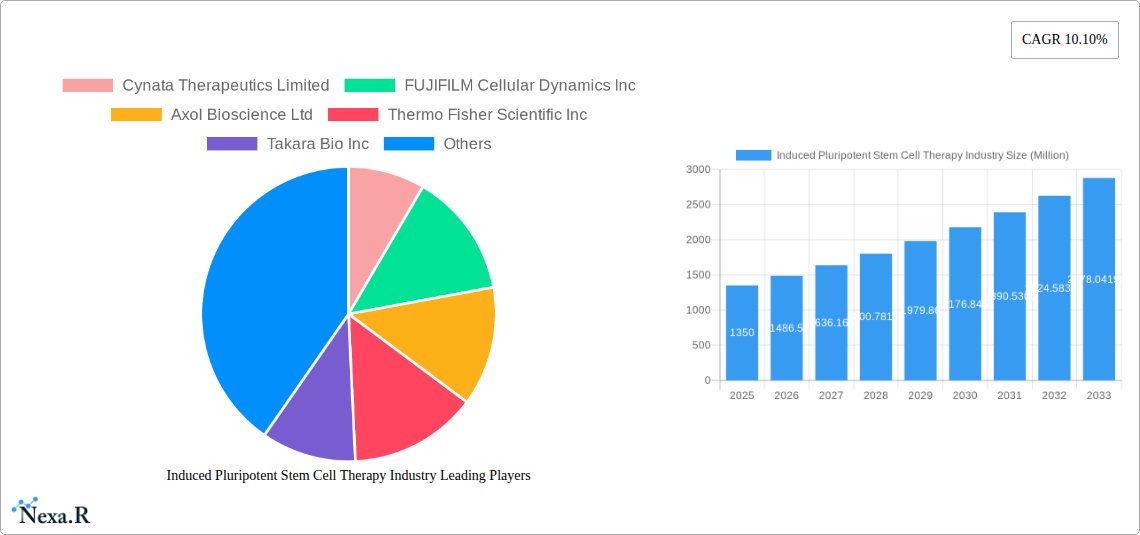
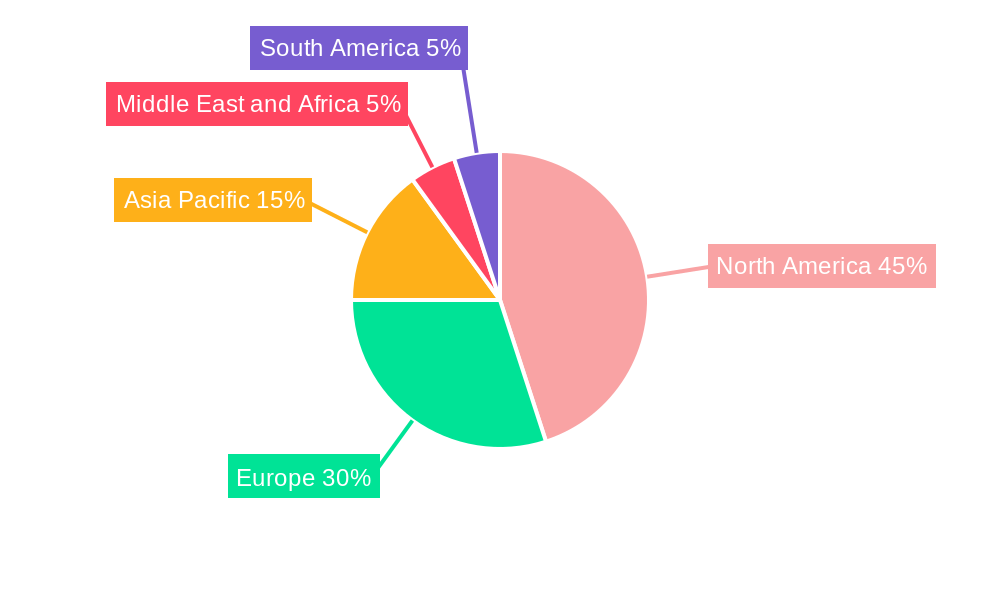
The induced pluripotent stem cell (iPSC) therapy market is experiencing robust growth, projected to reach $1.35 billion in 2025 and maintain a Compound Annual Growth Rate (CAGR) of 10.10% from 2025 to 2033. This expansion is fueled by several key drivers. Firstly, the increasing prevalence of chronic diseases like diabetes, Parkinson's disease, and heart failure is creating a significant demand for innovative treatment options. iPSC-based therapies offer a promising avenue for cell replacement and tissue regeneration, addressing unmet medical needs. Secondly, advancements in iPSC technology, including improved efficiency in reprogramming somatic cells and enhanced control over cell differentiation, are accelerating the development and commercialization of iPSC-derived products. Furthermore, supportive regulatory frameworks and increased funding for research and development are fostering a dynamic and competitive market landscape. The market segmentation reveals that drug development and regenerative medicine are currently the largest application areas, followed by toxicity testing and tissue engineering. Hepatocytes are the most commonly derived cell type, reflecting the significant need for liver-related therapies. North America currently holds the largest market share, driven by robust research infrastructure and early adoption of advanced therapies. However, the Asia-Pacific region is expected to witness significant growth in the coming years, fueled by increasing healthcare expenditure and growing awareness of iPSC therapies.
While the market exhibits substantial potential, several challenges remain. The high cost of iPSC-based therapies, the complexities associated with manufacturing and scaling up production, and the potential for immunological rejection represent hurdles that need to be overcome for wider adoption. Moreover, the long timelines involved in clinical trials and regulatory approvals could temporarily impact market growth. However, ongoing research efforts aimed at streamlining manufacturing processes, reducing costs, and improving safety profiles are expected to address these challenges and further accelerate market expansion. The competitive landscape is characterized by both established pharmaceutical companies and innovative biotech firms, creating a dynamic environment conducive to innovation and growth in this rapidly evolving therapeutic sector. The collaborative efforts between academic institutions, research organizations, and industry players are further accelerating the translation of iPSC-based research into clinical applications, promising transformative advances in healthcare.
Induced Pluripotent Stem Cell Therapy Industry Market Report: 2019-2033
This comprehensive report provides an in-depth analysis of the Induced Pluripotent Stem Cell (iPSC) therapy industry, encompassing market dynamics, growth trends, competitive landscape, and future outlook. The study period covers 2019-2033, with 2025 as the base and estimated year. This report is crucial for industry professionals, investors, and researchers seeking a clear understanding of this rapidly evolving sector.
Induced Pluripotent Stem Cell Therapy Industry Market Dynamics & Structure
The iPSC therapy market is characterized by a dynamic interplay of technological advancements, regulatory landscapes, and competitive strategies. Market concentration is currently moderate, with several key players vying for dominance. However, the sector is witnessing significant consolidation through mergers and acquisitions (M&A). The volume of M&A deals in the historical period (2019-2024) averaged xx deals annually, with a projected increase to xx deals annually during the forecast period (2025-2033). Technological innovation, particularly in iPSC derivation, differentiation, and scalability, is a primary growth driver. Stringent regulatory frameworks governing cell therapy products pose both challenges and opportunities, driving the need for robust quality control and clinical trial data. Competitive substitutes, such as traditional cell therapies and small molecule drugs, exist, but iPSC therapies offer unique advantages in terms of scalability and disease modeling capabilities.
- Market Concentration: Moderately concentrated, with a Herfindahl-Hirschman Index (HHI) of xx in 2025.
- Technological Innovation: Focus on improved efficiency of iPSC derivation and differentiation, automation of cell processing, and advanced screening techniques.
- Regulatory Frameworks: Stringent regulations regarding manufacturing, safety, and efficacy, impacting time to market and costs.
- Competitive Substitutes: Traditional cell therapies, small molecule drugs, and gene therapies.
- M&A Activity: Increasing consolidation, with large pharmaceutical companies acquiring smaller biotech firms specializing in iPSC technology.
- End-User Demographics: Primarily research institutions and pharmaceutical companies, with growing participation from hospitals and clinics.
Induced Pluripotent Stem Cell Therapy Industry Growth Trends & Insights
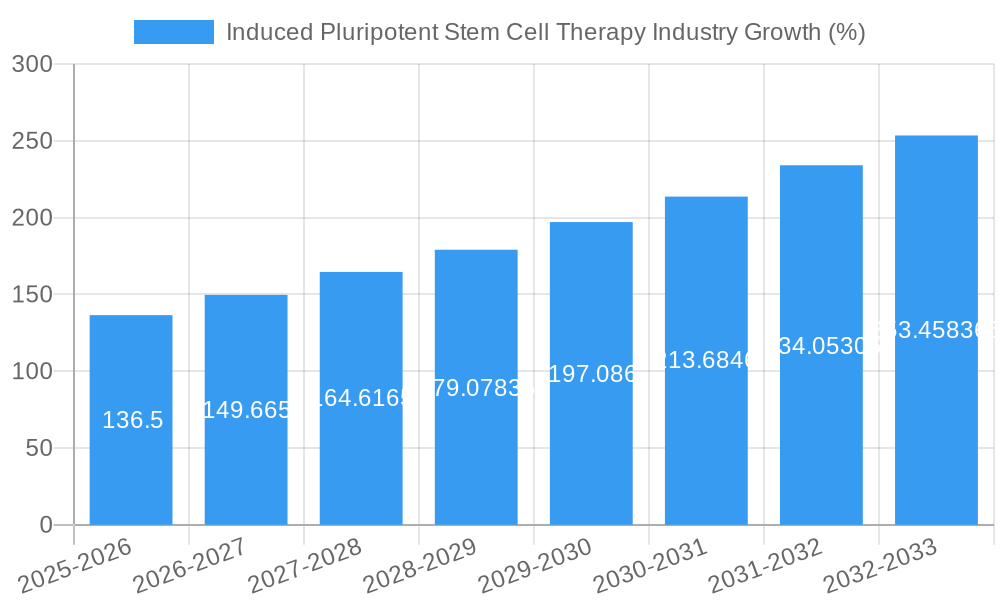
The iPSC therapy market is experiencing robust growth, driven by increasing investments in research and development, expanding clinical trials, and growing adoption across various applications. The market size reached xx million units in 2025 and is projected to witness a Compound Annual Growth Rate (CAGR) of xx% from 2025 to 2033, reaching xx million units by 2033. This growth reflects increasing adoption rates in drug development, regenerative medicine, and disease modeling. Technological disruptions, such as advancements in gene editing and automation, accelerate market penetration. The market is also witnessing a shift in consumer behavior towards personalized medicine, fueling the demand for iPSC-based therapies.
Dominant Regions, Countries, or Segments in Induced Pluripotent Stem Cell Therapy Industry
North America currently holds the largest market share in the iPSC therapy industry, driven by strong research infrastructure, high investments in biotechnology, and well-established regulatory frameworks. Europe follows as a significant market, benefiting from a robust healthcare system and increasing government support for regenerative medicine initiatives. Asia-Pacific is expected to experience substantial growth owing to rising healthcare expenditure, expanding pharmaceutical industry, and increased awareness of advanced therapies.
Dominant Segments:
- Derived Cell Type: Hepatocytes and neurons are currently the leading segments due to high demand in drug discovery and disease modeling.
- Application: Drug development currently holds the largest market share, followed by regenerative medicine. Toxicity testing and disease modeling applications are showing rapid growth.
- End User: Research institutions constitute the largest end-user segment, but the pharmaceutical/biotech sector is rapidly increasing its market share.
Key Drivers:
- North America: Robust funding for research and development, established regulatory frameworks.
- Europe: Strong healthcare infrastructure, supportive government policies for regenerative medicine.
- Asia-Pacific: Increasing healthcare expenditure, a growing pharmaceutical sector.
Induced Pluripotent Stem Cell Therapy Industry Product Landscape
The iPSC therapy product landscape encompasses a wide range of cell types, including hepatocytes, fibroblasts, keratinocytes, neurons, and others. These cells are utilized in diverse applications spanning drug discovery, regenerative medicine, toxicity testing, and disease modeling. Technological advancements, such as optimized iPSC derivation protocols, precise gene editing techniques, and automated cell processing systems, have significantly improved the efficiency, consistency, and quality of iPSC-derived products. This leads to enhanced performance metrics such as improved cell viability, differentiation efficiency, and functional capacity, which translate into unique selling propositions and improved efficacy in downstream applications.
Key Drivers, Barriers & Challenges in Induced Pluripotent Stem Cell Therapy Industry
Key Drivers:
- Growing demand for personalized medicine.
- Advancements in iPSC technology, including efficient derivation and differentiation protocols.
- Increased funding for research and development from both public and private sectors.
- Expanding clinical trials demonstrating efficacy of iPSC-based therapies.
Key Challenges and Restraints:
- High cost of production and manufacturing processes.
- Complex and lengthy regulatory approval pathways.
- Potential safety concerns related to the use of iPSCs.
- Limited access to skilled workforce and specialized facilities.
- Competition from other regenerative medicine therapies and drug modalities.
Emerging Opportunities in Induced Pluripotent Stem Cell Therapy Industry
- Expansion into new therapeutic areas: iPSCs hold immense promise for treating various diseases where current treatment options are limited.
- Development of novel applications: Further development of iPSC-based drug screening platforms and personalized medicine tools.
- Strategic collaborations: Synergistic partnerships between pharmaceutical companies and iPSC technology developers.
- Advancements in automation and scalability: Improved cost-effectiveness and access to treatments.
Growth Accelerators in the Induced Pluripotent Stem Cell Therapy Industry
The long-term growth of the iPSC therapy market will be significantly influenced by technological breakthroughs in iPSC derivation, differentiation, and scale-up, leading to cost reductions and improved product quality. Strategic partnerships between academic institutions, biotech companies, and pharmaceutical giants will accelerate the translation of research into clinically relevant therapies. Furthermore, expansion into novel therapeutic areas and innovative applications will fuel market growth.
Key Players Shaping the Induced Pluripotent Stem Cell Therapy Market
- Cynata Therapeutics Limited
- FUJIFILM Cellular Dynamics Inc
- Axol Bioscience Ltd
- Thermo Fisher Scientific Inc
- Takara Bio Inc
- REPROCELL USA Inc
- LizarBio Therapeutics (Pluricell Biotech)
- Fate Therapeutics Inc
- Sumitomo Dainippon Pharma Co Ltd
- Ncardia
- ViaCyte Inc
- Evotec SE
Notable Milestones in Induced Pluripotent Stem Cell Therapy Industry Sector
- November 2022: Prepaire Labs and Ncardia sign a 5-year agreement to accelerate drug discovery and development using iPSCs.
- October 2022: CiRA Foundation and CGT Catapult launch a collaborative research initiative focused on iPS cell characterization for regenerative medicine.
In-Depth Induced Pluripotent Stem Cell Therapy Industry Market Outlook
The iPSC therapy market is poised for significant expansion in the coming years, driven by ongoing technological advancements, increasing research and development investments, and growing clinical validation. Strategic collaborations and the emergence of novel applications will further fuel market growth. The market presents substantial opportunities for both established players and emerging companies, presenting significant potential for investors and stakeholders involved in the development and commercialization of iPSC-based therapies.
Induced Pluripotent Stem Cell Therapy Industry Segmentation
-
1. Derived Cell Type
- 1.1. Hepatocytes
- 1.2. Fibroblasts
- 1.3. Keratinocytes
- 1.4. Neurons
- 1.5. Others
-
2. Application
- 2.1. Drug Development
- 2.2. Regenerative Medicine
- 2.3. Toxicity Testing
- 2.4. Tissue Engineering
- 2.5. Cell Therapy
- 2.6. Disease Modeling
-
3. End User
- 3.1. Research Institutions
- 3.2. Other End Users
Induced Pluripotent Stem Cell Therapy Industry Segmentation By Geography
-
1. North America
- 1.1. United States
- 1.2. Canada
- 1.3. Mexico
-
2. Europe
- 2.1. Germany
- 2.2. United Kingdom
- 2.3. France
- 2.4. Italy
- 2.5. Spain
- 2.6. Rest of Europe
-
3. Asia Pacific
- 3.1. China
- 3.2. Japan
- 3.3. India
- 3.4. Australia
- 3.5. South Korea
- 3.6. Rest of Asia Pacific
-
4. Middle East and Africa
- 4.1. GCC
- 4.2. South Africa
- 4.3. Rest of Middle East and Africa
-
5. South America
- 5.1. Brazil
- 5.2. Argentina
- 5.3. Rest of South America
Induced Pluripotent Stem Cell Therapy Industry REPORT HIGHLIGHTS
| Aspects | Details |
|---|---|
| Study Period | 2019-2033 |
| Base Year | 2024 |
| Estimated Year | 2025 |
| Forecast Period | 2025-2033 |
| Historical Period | 2019-2024 |
| Growth Rate | CAGR of 10.10% from 2019-2033 |
| Segmentation |
|
Table of Contents
- 1. Introduction
- 1.1. Research Scope
- 1.2. Market Segmentation
- 1.3. Research Methodology
- 1.4. Definitions and Assumptions
- 2. Executive Summary
- 2.1. Introduction
- 3. Market Dynamics
- 3.1. Introduction
- 3.2. Market Drivers
- 3.2.1. Increase in Research and Development Activities in Stem Cells Therapies; Surge in Adoption of Personalized Medicine
- 3.3. Market Restrains
- 3.3.1. Lack of Awareness Regarding Stem Cell Therapies and High Cost of Treatment
- 3.4. Market Trends
- 3.4.1. Regenerative Medicine Segment is Expected to Witness Significant Growth Over the Forecast Period
- 4. Market Factor Analysis
- 4.1. Porters Five Forces
- 4.2. Supply/Value Chain
- 4.3. PESTEL analysis
- 4.4. Market Entropy
- 4.5. Patent/Trademark Analysis
- 5. Global Induced Pluripotent Stem Cell Therapy Industry Analysis, Insights and Forecast, 2019-2031
- 5.1. Market Analysis, Insights and Forecast - by Derived Cell Type
- 5.1.1. Hepatocytes
- 5.1.2. Fibroblasts
- 5.1.3. Keratinocytes
- 5.1.4. Neurons
- 5.1.5. Others
- 5.2. Market Analysis, Insights and Forecast - by Application
- 5.2.1. Drug Development
- 5.2.2. Regenerative Medicine
- 5.2.3. Toxicity Testing
- 5.2.4. Tissue Engineering
- 5.2.5. Cell Therapy
- 5.2.6. Disease Modeling
- 5.3. Market Analysis, Insights and Forecast - by End User
- 5.3.1. Research Institutions
- 5.3.2. Other End Users
- 5.4. Market Analysis, Insights and Forecast - by Region
- 5.4.1. North America
- 5.4.2. Europe
- 5.4.3. Asia Pacific
- 5.4.4. Middle East and Africa
- 5.4.5. South America
- 5.1. Market Analysis, Insights and Forecast - by Derived Cell Type
- 6. North America Induced Pluripotent Stem Cell Therapy Industry Analysis, Insights and Forecast, 2019-2031
- 6.1. Market Analysis, Insights and Forecast - by Derived Cell Type
- 6.1.1. Hepatocytes
- 6.1.2. Fibroblasts
- 6.1.3. Keratinocytes
- 6.1.4. Neurons
- 6.1.5. Others
- 6.2. Market Analysis, Insights and Forecast - by Application
- 6.2.1. Drug Development
- 6.2.2. Regenerative Medicine
- 6.2.3. Toxicity Testing
- 6.2.4. Tissue Engineering
- 6.2.5. Cell Therapy
- 6.2.6. Disease Modeling
- 6.3. Market Analysis, Insights and Forecast - by End User
- 6.3.1. Research Institutions
- 6.3.2. Other End Users
- 6.1. Market Analysis, Insights and Forecast - by Derived Cell Type
- 7. Europe Induced Pluripotent Stem Cell Therapy Industry Analysis, Insights and Forecast, 2019-2031
- 7.1. Market Analysis, Insights and Forecast - by Derived Cell Type
- 7.1.1. Hepatocytes
- 7.1.2. Fibroblasts
- 7.1.3. Keratinocytes
- 7.1.4. Neurons
- 7.1.5. Others
- 7.2. Market Analysis, Insights and Forecast - by Application
- 7.2.1. Drug Development
- 7.2.2. Regenerative Medicine
- 7.2.3. Toxicity Testing
- 7.2.4. Tissue Engineering
- 7.2.5. Cell Therapy
- 7.2.6. Disease Modeling
- 7.3. Market Analysis, Insights and Forecast - by End User
- 7.3.1. Research Institutions
- 7.3.2. Other End Users
- 7.1. Market Analysis, Insights and Forecast - by Derived Cell Type
- 8. Asia Pacific Induced Pluripotent Stem Cell Therapy Industry Analysis, Insights and Forecast, 2019-2031
- 8.1. Market Analysis, Insights and Forecast - by Derived Cell Type
- 8.1.1. Hepatocytes
- 8.1.2. Fibroblasts
- 8.1.3. Keratinocytes
- 8.1.4. Neurons
- 8.1.5. Others
- 8.2. Market Analysis, Insights and Forecast - by Application
- 8.2.1. Drug Development
- 8.2.2. Regenerative Medicine
- 8.2.3. Toxicity Testing
- 8.2.4. Tissue Engineering
- 8.2.5. Cell Therapy
- 8.2.6. Disease Modeling
- 8.3. Market Analysis, Insights and Forecast - by End User
- 8.3.1. Research Institutions
- 8.3.2. Other End Users
- 8.1. Market Analysis, Insights and Forecast - by Derived Cell Type
- 9. Middle East and Africa Induced Pluripotent Stem Cell Therapy Industry Analysis, Insights and Forecast, 2019-2031
- 9.1. Market Analysis, Insights and Forecast - by Derived Cell Type
- 9.1.1. Hepatocytes
- 9.1.2. Fibroblasts
- 9.1.3. Keratinocytes
- 9.1.4. Neurons
- 9.1.5. Others
- 9.2. Market Analysis, Insights and Forecast - by Application
- 9.2.1. Drug Development
- 9.2.2. Regenerative Medicine
- 9.2.3. Toxicity Testing
- 9.2.4. Tissue Engineering
- 9.2.5. Cell Therapy
- 9.2.6. Disease Modeling
- 9.3. Market Analysis, Insights and Forecast - by End User
- 9.3.1. Research Institutions
- 9.3.2. Other End Users
- 9.1. Market Analysis, Insights and Forecast - by Derived Cell Type
- 10. South America Induced Pluripotent Stem Cell Therapy Industry Analysis, Insights and Forecast, 2019-2031
- 10.1. Market Analysis, Insights and Forecast - by Derived Cell Type
- 10.1.1. Hepatocytes
- 10.1.2. Fibroblasts
- 10.1.3. Keratinocytes
- 10.1.4. Neurons
- 10.1.5. Others
- 10.2. Market Analysis, Insights and Forecast - by Application
- 10.2.1. Drug Development
- 10.2.2. Regenerative Medicine
- 10.2.3. Toxicity Testing
- 10.2.4. Tissue Engineering
- 10.2.5. Cell Therapy
- 10.2.6. Disease Modeling
- 10.3. Market Analysis, Insights and Forecast - by End User
- 10.3.1. Research Institutions
- 10.3.2. Other End Users
- 10.1. Market Analysis, Insights and Forecast - by Derived Cell Type
- 11. North America Induced Pluripotent Stem Cell Therapy Industry Analysis, Insights and Forecast, 2019-2031
- 11.1. Market Analysis, Insights and Forecast - By Country/Sub-region
- 11.1.1. undefined
- 12. Europe Induced Pluripotent Stem Cell Therapy Industry Analysis, Insights and Forecast, 2019-2031
- 12.1. Market Analysis, Insights and Forecast - By Country/Sub-region
- 12.1.1. undefined
- 13. Asia Pacific Induced Pluripotent Stem Cell Therapy Industry Analysis, Insights and Forecast, 2019-2031
- 13.1. Market Analysis, Insights and Forecast - By Country/Sub-region
- 13.1.1. undefined
- 14. Middle East and Africa Induced Pluripotent Stem Cell Therapy Industry Analysis, Insights and Forecast, 2019-2031
- 14.1. Market Analysis, Insights and Forecast - By Country/Sub-region
- 14.1.1. undefined
- 15. South America Induced Pluripotent Stem Cell Therapy Industry Analysis, Insights and Forecast, 2019-2031
- 15.1. Market Analysis, Insights and Forecast - By Country/Sub-region
- 15.1.1. undefined
- 16. Competitive Analysis
- 16.1. Global Market Share Analysis 2024
- 16.2. Company Profiles
- 16.2.1 Cynata Therapeutics Limited
- 16.2.1.1. Overview
- 16.2.1.2. Products
- 16.2.1.3. SWOT Analysis
- 16.2.1.4. Recent Developments
- 16.2.1.5. Financials (Based on Availability)
- 16.2.2 FUJIFILM Cellular Dynamics Inc
- 16.2.2.1. Overview
- 16.2.2.2. Products
- 16.2.2.3. SWOT Analysis
- 16.2.2.4. Recent Developments
- 16.2.2.5. Financials (Based on Availability)
- 16.2.3 Axol Bioscience Ltd
- 16.2.3.1. Overview
- 16.2.3.2. Products
- 16.2.3.3. SWOT Analysis
- 16.2.3.4. Recent Developments
- 16.2.3.5. Financials (Based on Availability)
- 16.2.4 Thermo Fisher Scientific Inc
- 16.2.4.1. Overview
- 16.2.4.2. Products
- 16.2.4.3. SWOT Analysis
- 16.2.4.4. Recent Developments
- 16.2.4.5. Financials (Based on Availability)
- 16.2.5 Takara Bio Inc
- 16.2.5.1. Overview
- 16.2.5.2. Products
- 16.2.5.3. SWOT Analysis
- 16.2.5.4. Recent Developments
- 16.2.5.5. Financials (Based on Availability)
- 16.2.6 REPROCELL USA Inc
- 16.2.6.1. Overview
- 16.2.6.2. Products
- 16.2.6.3. SWOT Analysis
- 16.2.6.4. Recent Developments
- 16.2.6.5. Financials (Based on Availability)
- 16.2.7 LizarBio Therapeutics (Pluricell Biotech)
- 16.2.7.1. Overview
- 16.2.7.2. Products
- 16.2.7.3. SWOT Analysis
- 16.2.7.4. Recent Developments
- 16.2.7.5. Financials (Based on Availability)
- 16.2.8 Fate Therapeutics Inc
- 16.2.8.1. Overview
- 16.2.8.2. Products
- 16.2.8.3. SWOT Analysis
- 16.2.8.4. Recent Developments
- 16.2.8.5. Financials (Based on Availability)
- 16.2.9 Sumitomo Dainippon Pharma Co Ltd
- 16.2.9.1. Overview
- 16.2.9.2. Products
- 16.2.9.3. SWOT Analysis
- 16.2.9.4. Recent Developments
- 16.2.9.5. Financials (Based on Availability)
- 16.2.10 Ncardia
- 16.2.10.1. Overview
- 16.2.10.2. Products
- 16.2.10.3. SWOT Analysis
- 16.2.10.4. Recent Developments
- 16.2.10.5. Financials (Based on Availability)
- 16.2.11 ViaCyte Inc
- 16.2.11.1. Overview
- 16.2.11.2. Products
- 16.2.11.3. SWOT Analysis
- 16.2.11.4. Recent Developments
- 16.2.11.5. Financials (Based on Availability)
- 16.2.12 Evotec SE
- 16.2.12.1. Overview
- 16.2.12.2. Products
- 16.2.12.3. SWOT Analysis
- 16.2.12.4. Recent Developments
- 16.2.12.5. Financials (Based on Availability)
- 16.2.1 Cynata Therapeutics Limited
List of Figures
- Figure 1: Global Induced Pluripotent Stem Cell Therapy Industry Revenue Breakdown (Million, %) by Region 2024 & 2032
- Figure 2: Global Induced Pluripotent Stem Cell Therapy Industry Volume Breakdown (K unit, %) by Region 2024 & 2032
- Figure 3: North America Induced Pluripotent Stem Cell Therapy Industry Revenue (Million), by Country 2024 & 2032
- Figure 4: North America Induced Pluripotent Stem Cell Therapy Industry Volume (K unit), by Country 2024 & 2032
- Figure 5: North America Induced Pluripotent Stem Cell Therapy Industry Revenue Share (%), by Country 2024 & 2032
- Figure 6: North America Induced Pluripotent Stem Cell Therapy Industry Volume Share (%), by Country 2024 & 2032
- Figure 7: Europe Induced Pluripotent Stem Cell Therapy Industry Revenue (Million), by Country 2024 & 2032
- Figure 8: Europe Induced Pluripotent Stem Cell Therapy Industry Volume (K unit), by Country 2024 & 2032
- Figure 9: Europe Induced Pluripotent Stem Cell Therapy Industry Revenue Share (%), by Country 2024 & 2032
- Figure 10: Europe Induced Pluripotent Stem Cell Therapy Industry Volume Share (%), by Country 2024 & 2032
- Figure 11: Asia Pacific Induced Pluripotent Stem Cell Therapy Industry Revenue (Million), by Country 2024 & 2032
- Figure 12: Asia Pacific Induced Pluripotent Stem Cell Therapy Industry Volume (K unit), by Country 2024 & 2032
- Figure 13: Asia Pacific Induced Pluripotent Stem Cell Therapy Industry Revenue Share (%), by Country 2024 & 2032
- Figure 14: Asia Pacific Induced Pluripotent Stem Cell Therapy Industry Volume Share (%), by Country 2024 & 2032
- Figure 15: Middle East and Africa Induced Pluripotent Stem Cell Therapy Industry Revenue (Million), by Country 2024 & 2032
- Figure 16: Middle East and Africa Induced Pluripotent Stem Cell Therapy Industry Volume (K unit), by Country 2024 & 2032
- Figure 17: Middle East and Africa Induced Pluripotent Stem Cell Therapy Industry Revenue Share (%), by Country 2024 & 2032
- Figure 18: Middle East and Africa Induced Pluripotent Stem Cell Therapy Industry Volume Share (%), by Country 2024 & 2032
- Figure 19: South America Induced Pluripotent Stem Cell Therapy Industry Revenue (Million), by Country 2024 & 2032
- Figure 20: South America Induced Pluripotent Stem Cell Therapy Industry Volume (K unit), by Country 2024 & 2032
- Figure 21: South America Induced Pluripotent Stem Cell Therapy Industry Revenue Share (%), by Country 2024 & 2032
- Figure 22: South America Induced Pluripotent Stem Cell Therapy Industry Volume Share (%), by Country 2024 & 2032
- Figure 23: North America Induced Pluripotent Stem Cell Therapy Industry Revenue (Million), by Derived Cell Type 2024 & 2032
- Figure 24: North America Induced Pluripotent Stem Cell Therapy Industry Volume (K unit), by Derived Cell Type 2024 & 2032
- Figure 25: North America Induced Pluripotent Stem Cell Therapy Industry Revenue Share (%), by Derived Cell Type 2024 & 2032
- Figure 26: North America Induced Pluripotent Stem Cell Therapy Industry Volume Share (%), by Derived Cell Type 2024 & 2032
- Figure 27: North America Induced Pluripotent Stem Cell Therapy Industry Revenue (Million), by Application 2024 & 2032
- Figure 28: North America Induced Pluripotent Stem Cell Therapy Industry Volume (K unit), by Application 2024 & 2032
- Figure 29: North America Induced Pluripotent Stem Cell Therapy Industry Revenue Share (%), by Application 2024 & 2032
- Figure 30: North America Induced Pluripotent Stem Cell Therapy Industry Volume Share (%), by Application 2024 & 2032
- Figure 31: North America Induced Pluripotent Stem Cell Therapy Industry Revenue (Million), by End User 2024 & 2032
- Figure 32: North America Induced Pluripotent Stem Cell Therapy Industry Volume (K unit), by End User 2024 & 2032
- Figure 33: North America Induced Pluripotent Stem Cell Therapy Industry Revenue Share (%), by End User 2024 & 2032
- Figure 34: North America Induced Pluripotent Stem Cell Therapy Industry Volume Share (%), by End User 2024 & 2032
- Figure 35: North America Induced Pluripotent Stem Cell Therapy Industry Revenue (Million), by Country 2024 & 2032
- Figure 36: North America Induced Pluripotent Stem Cell Therapy Industry Volume (K unit), by Country 2024 & 2032
- Figure 37: North America Induced Pluripotent Stem Cell Therapy Industry Revenue Share (%), by Country 2024 & 2032
- Figure 38: North America Induced Pluripotent Stem Cell Therapy Industry Volume Share (%), by Country 2024 & 2032
- Figure 39: Europe Induced Pluripotent Stem Cell Therapy Industry Revenue (Million), by Derived Cell Type 2024 & 2032
- Figure 40: Europe Induced Pluripotent Stem Cell Therapy Industry Volume (K unit), by Derived Cell Type 2024 & 2032
- Figure 41: Europe Induced Pluripotent Stem Cell Therapy Industry Revenue Share (%), by Derived Cell Type 2024 & 2032
- Figure 42: Europe Induced Pluripotent Stem Cell Therapy Industry Volume Share (%), by Derived Cell Type 2024 & 2032
- Figure 43: Europe Induced Pluripotent Stem Cell Therapy Industry Revenue (Million), by Application 2024 & 2032
- Figure 44: Europe Induced Pluripotent Stem Cell Therapy Industry Volume (K unit), by Application 2024 & 2032
- Figure 45: Europe Induced Pluripotent Stem Cell Therapy Industry Revenue Share (%), by Application 2024 & 2032
- Figure 46: Europe Induced Pluripotent Stem Cell Therapy Industry Volume Share (%), by Application 2024 & 2032
- Figure 47: Europe Induced Pluripotent Stem Cell Therapy Industry Revenue (Million), by End User 2024 & 2032
- Figure 48: Europe Induced Pluripotent Stem Cell Therapy Industry Volume (K unit), by End User 2024 & 2032
- Figure 49: Europe Induced Pluripotent Stem Cell Therapy Industry Revenue Share (%), by End User 2024 & 2032
- Figure 50: Europe Induced Pluripotent Stem Cell Therapy Industry Volume Share (%), by End User 2024 & 2032
- Figure 51: Europe Induced Pluripotent Stem Cell Therapy Industry Revenue (Million), by Country 2024 & 2032
- Figure 52: Europe Induced Pluripotent Stem Cell Therapy Industry Volume (K unit), by Country 2024 & 2032
- Figure 53: Europe Induced Pluripotent Stem Cell Therapy Industry Revenue Share (%), by Country 2024 & 2032
- Figure 54: Europe Induced Pluripotent Stem Cell Therapy Industry Volume Share (%), by Country 2024 & 2032
- Figure 55: Asia Pacific Induced Pluripotent Stem Cell Therapy Industry Revenue (Million), by Derived Cell Type 2024 & 2032
- Figure 56: Asia Pacific Induced Pluripotent Stem Cell Therapy Industry Volume (K unit), by Derived Cell Type 2024 & 2032
- Figure 57: Asia Pacific Induced Pluripotent Stem Cell Therapy Industry Revenue Share (%), by Derived Cell Type 2024 & 2032
- Figure 58: Asia Pacific Induced Pluripotent Stem Cell Therapy Industry Volume Share (%), by Derived Cell Type 2024 & 2032
- Figure 59: Asia Pacific Induced Pluripotent Stem Cell Therapy Industry Revenue (Million), by Application 2024 & 2032
- Figure 60: Asia Pacific Induced Pluripotent Stem Cell Therapy Industry Volume (K unit), by Application 2024 & 2032
- Figure 61: Asia Pacific Induced Pluripotent Stem Cell Therapy Industry Revenue Share (%), by Application 2024 & 2032
- Figure 62: Asia Pacific Induced Pluripotent Stem Cell Therapy Industry Volume Share (%), by Application 2024 & 2032
- Figure 63: Asia Pacific Induced Pluripotent Stem Cell Therapy Industry Revenue (Million), by End User 2024 & 2032
- Figure 64: Asia Pacific Induced Pluripotent Stem Cell Therapy Industry Volume (K unit), by End User 2024 & 2032
- Figure 65: Asia Pacific Induced Pluripotent Stem Cell Therapy Industry Revenue Share (%), by End User 2024 & 2032
- Figure 66: Asia Pacific Induced Pluripotent Stem Cell Therapy Industry Volume Share (%), by End User 2024 & 2032
- Figure 67: Asia Pacific Induced Pluripotent Stem Cell Therapy Industry Revenue (Million), by Country 2024 & 2032
- Figure 68: Asia Pacific Induced Pluripotent Stem Cell Therapy Industry Volume (K unit), by Country 2024 & 2032
- Figure 69: Asia Pacific Induced Pluripotent Stem Cell Therapy Industry Revenue Share (%), by Country 2024 & 2032
- Figure 70: Asia Pacific Induced Pluripotent Stem Cell Therapy Industry Volume Share (%), by Country 2024 & 2032
- Figure 71: Middle East and Africa Induced Pluripotent Stem Cell Therapy Industry Revenue (Million), by Derived Cell Type 2024 & 2032
- Figure 72: Middle East and Africa Induced Pluripotent Stem Cell Therapy Industry Volume (K unit), by Derived Cell Type 2024 & 2032
- Figure 73: Middle East and Africa Induced Pluripotent Stem Cell Therapy Industry Revenue Share (%), by Derived Cell Type 2024 & 2032
- Figure 74: Middle East and Africa Induced Pluripotent Stem Cell Therapy Industry Volume Share (%), by Derived Cell Type 2024 & 2032
- Figure 75: Middle East and Africa Induced Pluripotent Stem Cell Therapy Industry Revenue (Million), by Application 2024 & 2032
- Figure 76: Middle East and Africa Induced Pluripotent Stem Cell Therapy Industry Volume (K unit), by Application 2024 & 2032
- Figure 77: Middle East and Africa Induced Pluripotent Stem Cell Therapy Industry Revenue Share (%), by Application 2024 & 2032
- Figure 78: Middle East and Africa Induced Pluripotent Stem Cell Therapy Industry Volume Share (%), by Application 2024 & 2032
- Figure 79: Middle East and Africa Induced Pluripotent Stem Cell Therapy Industry Revenue (Million), by End User 2024 & 2032
- Figure 80: Middle East and Africa Induced Pluripotent Stem Cell Therapy Industry Volume (K unit), by End User 2024 & 2032
- Figure 81: Middle East and Africa Induced Pluripotent Stem Cell Therapy Industry Revenue Share (%), by End User 2024 & 2032
- Figure 82: Middle East and Africa Induced Pluripotent Stem Cell Therapy Industry Volume Share (%), by End User 2024 & 2032
- Figure 83: Middle East and Africa Induced Pluripotent Stem Cell Therapy Industry Revenue (Million), by Country 2024 & 2032
- Figure 84: Middle East and Africa Induced Pluripotent Stem Cell Therapy Industry Volume (K unit), by Country 2024 & 2032
- Figure 85: Middle East and Africa Induced Pluripotent Stem Cell Therapy Industry Revenue Share (%), by Country 2024 & 2032
- Figure 86: Middle East and Africa Induced Pluripotent Stem Cell Therapy Industry Volume Share (%), by Country 2024 & 2032
- Figure 87: South America Induced Pluripotent Stem Cell Therapy Industry Revenue (Million), by Derived Cell Type 2024 & 2032
- Figure 88: South America Induced Pluripotent Stem Cell Therapy Industry Volume (K unit), by Derived Cell Type 2024 & 2032
- Figure 89: South America Induced Pluripotent Stem Cell Therapy Industry Revenue Share (%), by Derived Cell Type 2024 & 2032
- Figure 90: South America Induced Pluripotent Stem Cell Therapy Industry Volume Share (%), by Derived Cell Type 2024 & 2032
- Figure 91: South America Induced Pluripotent Stem Cell Therapy Industry Revenue (Million), by Application 2024 & 2032
- Figure 92: South America Induced Pluripotent Stem Cell Therapy Industry Volume (K unit), by Application 2024 & 2032
- Figure 93: South America Induced Pluripotent Stem Cell Therapy Industry Revenue Share (%), by Application 2024 & 2032
- Figure 94: South America Induced Pluripotent Stem Cell Therapy Industry Volume Share (%), by Application 2024 & 2032
- Figure 95: South America Induced Pluripotent Stem Cell Therapy Industry Revenue (Million), by End User 2024 & 2032
- Figure 96: South America Induced Pluripotent Stem Cell Therapy Industry Volume (K unit), by End User 2024 & 2032
- Figure 97: South America Induced Pluripotent Stem Cell Therapy Industry Revenue Share (%), by End User 2024 & 2032
- Figure 98: South America Induced Pluripotent Stem Cell Therapy Industry Volume Share (%), by End User 2024 & 2032
- Figure 99: South America Induced Pluripotent Stem Cell Therapy Industry Revenue (Million), by Country 2024 & 2032
- Figure 100: South America Induced Pluripotent Stem Cell Therapy Industry Volume (K unit), by Country 2024 & 2032
- Figure 101: South America Induced Pluripotent Stem Cell Therapy Industry Revenue Share (%), by Country 2024 & 2032
- Figure 102: South America Induced Pluripotent Stem Cell Therapy Industry Volume Share (%), by Country 2024 & 2032
List of Tables
- Table 1: Global Induced Pluripotent Stem Cell Therapy Industry Revenue Million Forecast, by Region 2019 & 2032
- Table 2: Global Induced Pluripotent Stem Cell Therapy Industry Volume K unit Forecast, by Region 2019 & 2032
- Table 3: Global Induced Pluripotent Stem Cell Therapy Industry Revenue Million Forecast, by Derived Cell Type 2019 & 2032
- Table 4: Global Induced Pluripotent Stem Cell Therapy Industry Volume K unit Forecast, by Derived Cell Type 2019 & 2032
- Table 5: Global Induced Pluripotent Stem Cell Therapy Industry Revenue Million Forecast, by Application 2019 & 2032
- Table 6: Global Induced Pluripotent Stem Cell Therapy Industry Volume K unit Forecast, by Application 2019 & 2032
- Table 7: Global Induced Pluripotent Stem Cell Therapy Industry Revenue Million Forecast, by End User 2019 & 2032
- Table 8: Global Induced Pluripotent Stem Cell Therapy Industry Volume K unit Forecast, by End User 2019 & 2032
- Table 9: Global Induced Pluripotent Stem Cell Therapy Industry Revenue Million Forecast, by Region 2019 & 2032
- Table 10: Global Induced Pluripotent Stem Cell Therapy Industry Volume K unit Forecast, by Region 2019 & 2032
- Table 11: Global Induced Pluripotent Stem Cell Therapy Industry Revenue Million Forecast, by Country 2019 & 2032
- Table 12: Global Induced Pluripotent Stem Cell Therapy Industry Volume K unit Forecast, by Country 2019 & 2032
- Table 13: Global Induced Pluripotent Stem Cell Therapy Industry Revenue Million Forecast, by Country 2019 & 2032
- Table 14: Global Induced Pluripotent Stem Cell Therapy Industry Volume K unit Forecast, by Country 2019 & 2032
- Table 15: Global Induced Pluripotent Stem Cell Therapy Industry Revenue Million Forecast, by Country 2019 & 2032
- Table 16: Global Induced Pluripotent Stem Cell Therapy Industry Volume K unit Forecast, by Country 2019 & 2032
- Table 17: Global Induced Pluripotent Stem Cell Therapy Industry Revenue Million Forecast, by Country 2019 & 2032
- Table 18: Global Induced Pluripotent Stem Cell Therapy Industry Volume K unit Forecast, by Country 2019 & 2032
- Table 19: Global Induced Pluripotent Stem Cell Therapy Industry Revenue Million Forecast, by Country 2019 & 2032
- Table 20: Global Induced Pluripotent Stem Cell Therapy Industry Volume K unit Forecast, by Country 2019 & 2032
- Table 21: Global Induced Pluripotent Stem Cell Therapy Industry Revenue Million Forecast, by Derived Cell Type 2019 & 2032
- Table 22: Global Induced Pluripotent Stem Cell Therapy Industry Volume K unit Forecast, by Derived Cell Type 2019 & 2032
- Table 23: Global Induced Pluripotent Stem Cell Therapy Industry Revenue Million Forecast, by Application 2019 & 2032
- Table 24: Global Induced Pluripotent Stem Cell Therapy Industry Volume K unit Forecast, by Application 2019 & 2032
- Table 25: Global Induced Pluripotent Stem Cell Therapy Industry Revenue Million Forecast, by End User 2019 & 2032
- Table 26: Global Induced Pluripotent Stem Cell Therapy Industry Volume K unit Forecast, by End User 2019 & 2032
- Table 27: Global Induced Pluripotent Stem Cell Therapy Industry Revenue Million Forecast, by Country 2019 & 2032
- Table 28: Global Induced Pluripotent Stem Cell Therapy Industry Volume K unit Forecast, by Country 2019 & 2032
- Table 29: United States Induced Pluripotent Stem Cell Therapy Industry Revenue (Million) Forecast, by Application 2019 & 2032
- Table 30: United States Induced Pluripotent Stem Cell Therapy Industry Volume (K unit) Forecast, by Application 2019 & 2032
- Table 31: Canada Induced Pluripotent Stem Cell Therapy Industry Revenue (Million) Forecast, by Application 2019 & 2032
- Table 32: Canada Induced Pluripotent Stem Cell Therapy Industry Volume (K unit) Forecast, by Application 2019 & 2032
- Table 33: Mexico Induced Pluripotent Stem Cell Therapy Industry Revenue (Million) Forecast, by Application 2019 & 2032
- Table 34: Mexico Induced Pluripotent Stem Cell Therapy Industry Volume (K unit) Forecast, by Application 2019 & 2032
- Table 35: Global Induced Pluripotent Stem Cell Therapy Industry Revenue Million Forecast, by Derived Cell Type 2019 & 2032
- Table 36: Global Induced Pluripotent Stem Cell Therapy Industry Volume K unit Forecast, by Derived Cell Type 2019 & 2032
- Table 37: Global Induced Pluripotent Stem Cell Therapy Industry Revenue Million Forecast, by Application 2019 & 2032
- Table 38: Global Induced Pluripotent Stem Cell Therapy Industry Volume K unit Forecast, by Application 2019 & 2032
- Table 39: Global Induced Pluripotent Stem Cell Therapy Industry Revenue Million Forecast, by End User 2019 & 2032
- Table 40: Global Induced Pluripotent Stem Cell Therapy Industry Volume K unit Forecast, by End User 2019 & 2032
- Table 41: Global Induced Pluripotent Stem Cell Therapy Industry Revenue Million Forecast, by Country 2019 & 2032
- Table 42: Global Induced Pluripotent Stem Cell Therapy Industry Volume K unit Forecast, by Country 2019 & 2032
- Table 43: Germany Induced Pluripotent Stem Cell Therapy Industry Revenue (Million) Forecast, by Application 2019 & 2032
- Table 44: Germany Induced Pluripotent Stem Cell Therapy Industry Volume (K unit) Forecast, by Application 2019 & 2032
- Table 45: United Kingdom Induced Pluripotent Stem Cell Therapy Industry Revenue (Million) Forecast, by Application 2019 & 2032
- Table 46: United Kingdom Induced Pluripotent Stem Cell Therapy Industry Volume (K unit) Forecast, by Application 2019 & 2032
- Table 47: France Induced Pluripotent Stem Cell Therapy Industry Revenue (Million) Forecast, by Application 2019 & 2032
- Table 48: France Induced Pluripotent Stem Cell Therapy Industry Volume (K unit) Forecast, by Application 2019 & 2032
- Table 49: Italy Induced Pluripotent Stem Cell Therapy Industry Revenue (Million) Forecast, by Application 2019 & 2032
- Table 50: Italy Induced Pluripotent Stem Cell Therapy Industry Volume (K unit) Forecast, by Application 2019 & 2032
- Table 51: Spain Induced Pluripotent Stem Cell Therapy Industry Revenue (Million) Forecast, by Application 2019 & 2032
- Table 52: Spain Induced Pluripotent Stem Cell Therapy Industry Volume (K unit) Forecast, by Application 2019 & 2032
- Table 53: Rest of Europe Induced Pluripotent Stem Cell Therapy Industry Revenue (Million) Forecast, by Application 2019 & 2032
- Table 54: Rest of Europe Induced Pluripotent Stem Cell Therapy Industry Volume (K unit) Forecast, by Application 2019 & 2032
- Table 55: Global Induced Pluripotent Stem Cell Therapy Industry Revenue Million Forecast, by Derived Cell Type 2019 & 2032
- Table 56: Global Induced Pluripotent Stem Cell Therapy Industry Volume K unit Forecast, by Derived Cell Type 2019 & 2032
- Table 57: Global Induced Pluripotent Stem Cell Therapy Industry Revenue Million Forecast, by Application 2019 & 2032
- Table 58: Global Induced Pluripotent Stem Cell Therapy Industry Volume K unit Forecast, by Application 2019 & 2032
- Table 59: Global Induced Pluripotent Stem Cell Therapy Industry Revenue Million Forecast, by End User 2019 & 2032
- Table 60: Global Induced Pluripotent Stem Cell Therapy Industry Volume K unit Forecast, by End User 2019 & 2032
- Table 61: Global Induced Pluripotent Stem Cell Therapy Industry Revenue Million Forecast, by Country 2019 & 2032
- Table 62: Global Induced Pluripotent Stem Cell Therapy Industry Volume K unit Forecast, by Country 2019 & 2032
- Table 63: China Induced Pluripotent Stem Cell Therapy Industry Revenue (Million) Forecast, by Application 2019 & 2032
- Table 64: China Induced Pluripotent Stem Cell Therapy Industry Volume (K unit) Forecast, by Application 2019 & 2032
- Table 65: Japan Induced Pluripotent Stem Cell Therapy Industry Revenue (Million) Forecast, by Application 2019 & 2032
- Table 66: Japan Induced Pluripotent Stem Cell Therapy Industry Volume (K unit) Forecast, by Application 2019 & 2032
- Table 67: India Induced Pluripotent Stem Cell Therapy Industry Revenue (Million) Forecast, by Application 2019 & 2032
- Table 68: India Induced Pluripotent Stem Cell Therapy Industry Volume (K unit) Forecast, by Application 2019 & 2032
- Table 69: Australia Induced Pluripotent Stem Cell Therapy Industry Revenue (Million) Forecast, by Application 2019 & 2032
- Table 70: Australia Induced Pluripotent Stem Cell Therapy Industry Volume (K unit) Forecast, by Application 2019 & 2032
- Table 71: South Korea Induced Pluripotent Stem Cell Therapy Industry Revenue (Million) Forecast, by Application 2019 & 2032
- Table 72: South Korea Induced Pluripotent Stem Cell Therapy Industry Volume (K unit) Forecast, by Application 2019 & 2032
- Table 73: Rest of Asia Pacific Induced Pluripotent Stem Cell Therapy Industry Revenue (Million) Forecast, by Application 2019 & 2032
- Table 74: Rest of Asia Pacific Induced Pluripotent Stem Cell Therapy Industry Volume (K unit) Forecast, by Application 2019 & 2032
- Table 75: Global Induced Pluripotent Stem Cell Therapy Industry Revenue Million Forecast, by Derived Cell Type 2019 & 2032
- Table 76: Global Induced Pluripotent Stem Cell Therapy Industry Volume K unit Forecast, by Derived Cell Type 2019 & 2032
- Table 77: Global Induced Pluripotent Stem Cell Therapy Industry Revenue Million Forecast, by Application 2019 & 2032
- Table 78: Global Induced Pluripotent Stem Cell Therapy Industry Volume K unit Forecast, by Application 2019 & 2032
- Table 79: Global Induced Pluripotent Stem Cell Therapy Industry Revenue Million Forecast, by End User 2019 & 2032
- Table 80: Global Induced Pluripotent Stem Cell Therapy Industry Volume K unit Forecast, by End User 2019 & 2032
- Table 81: Global Induced Pluripotent Stem Cell Therapy Industry Revenue Million Forecast, by Country 2019 & 2032
- Table 82: Global Induced Pluripotent Stem Cell Therapy Industry Volume K unit Forecast, by Country 2019 & 2032
- Table 83: GCC Induced Pluripotent Stem Cell Therapy Industry Revenue (Million) Forecast, by Application 2019 & 2032
- Table 84: GCC Induced Pluripotent Stem Cell Therapy Industry Volume (K unit) Forecast, by Application 2019 & 2032
- Table 85: South Africa Induced Pluripotent Stem Cell Therapy Industry Revenue (Million) Forecast, by Application 2019 & 2032
- Table 86: South Africa Induced Pluripotent Stem Cell Therapy Industry Volume (K unit) Forecast, by Application 2019 & 2032
- Table 87: Rest of Middle East and Africa Induced Pluripotent Stem Cell Therapy Industry Revenue (Million) Forecast, by Application 2019 & 2032
- Table 88: Rest of Middle East and Africa Induced Pluripotent Stem Cell Therapy Industry Volume (K unit) Forecast, by Application 2019 & 2032
- Table 89: Global Induced Pluripotent Stem Cell Therapy Industry Revenue Million Forecast, by Derived Cell Type 2019 & 2032
- Table 90: Global Induced Pluripotent Stem Cell Therapy Industry Volume K unit Forecast, by Derived Cell Type 2019 & 2032
- Table 91: Global Induced Pluripotent Stem Cell Therapy Industry Revenue Million Forecast, by Application 2019 & 2032
- Table 92: Global Induced Pluripotent Stem Cell Therapy Industry Volume K unit Forecast, by Application 2019 & 2032
- Table 93: Global Induced Pluripotent Stem Cell Therapy Industry Revenue Million Forecast, by End User 2019 & 2032
- Table 94: Global Induced Pluripotent Stem Cell Therapy Industry Volume K unit Forecast, by End User 2019 & 2032
- Table 95: Global Induced Pluripotent Stem Cell Therapy Industry Revenue Million Forecast, by Country 2019 & 2032
- Table 96: Global Induced Pluripotent Stem Cell Therapy Industry Volume K unit Forecast, by Country 2019 & 2032
- Table 97: Brazil Induced Pluripotent Stem Cell Therapy Industry Revenue (Million) Forecast, by Application 2019 & 2032
- Table 98: Brazil Induced Pluripotent Stem Cell Therapy Industry Volume (K unit) Forecast, by Application 2019 & 2032
- Table 99: Argentina Induced Pluripotent Stem Cell Therapy Industry Revenue (Million) Forecast, by Application 2019 & 2032
- Table 100: Argentina Induced Pluripotent Stem Cell Therapy Industry Volume (K unit) Forecast, by Application 2019 & 2032
- Table 101: Rest of South America Induced Pluripotent Stem Cell Therapy Industry Revenue (Million) Forecast, by Application 2019 & 2032
- Table 102: Rest of South America Induced Pluripotent Stem Cell Therapy Industry Volume (K unit) Forecast, by Application 2019 & 2032
Frequently Asked Questions
1. What is the projected Compound Annual Growth Rate (CAGR) of the Induced Pluripotent Stem Cell Therapy Industry?
The projected CAGR is approximately 10.10%.
2. Which companies are prominent players in the Induced Pluripotent Stem Cell Therapy Industry?
Key companies in the market include Cynata Therapeutics Limited, FUJIFILM Cellular Dynamics Inc, Axol Bioscience Ltd, Thermo Fisher Scientific Inc, Takara Bio Inc, REPROCELL USA Inc, LizarBio Therapeutics (Pluricell Biotech), Fate Therapeutics Inc, Sumitomo Dainippon Pharma Co Ltd, Ncardia, ViaCyte Inc , Evotec SE.
3. What are the main segments of the Induced Pluripotent Stem Cell Therapy Industry?
The market segments include Derived Cell Type, Application, End User.
4. Can you provide details about the market size?
The market size is estimated to be USD 1.35 Million as of 2022.
5. What are some drivers contributing to market growth?
Increase in Research and Development Activities in Stem Cells Therapies; Surge in Adoption of Personalized Medicine.
6. What are the notable trends driving market growth?
Regenerative Medicine Segment is Expected to Witness Significant Growth Over the Forecast Period.
7. Are there any restraints impacting market growth?
Lack of Awareness Regarding Stem Cell Therapies and High Cost of Treatment.
8. Can you provide examples of recent developments in the market?
In November 2022, Prepaire Labs signed a 5-year agreement with Ncardia to accelerate drug discovery and development including target discovery, lead optimization, toxicity assessment, and trial design. The new initiative assists in the development of iPSCs by reprogramming adult cells (such as skin and blood cells) into an embryonic stem cell-like state, which can differentiate into any type of human body cell.
9. What pricing options are available for accessing the report?
Pricing options include single-user, multi-user, and enterprise licenses priced at USD 4750, USD 5250, and USD 8750 respectively.
10. Is the market size provided in terms of value or volume?
The market size is provided in terms of value, measured in Million and volume, measured in K unit.
11. Are there any specific market keywords associated with the report?
Yes, the market keyword associated with the report is "Induced Pluripotent Stem Cell Therapy Industry," which aids in identifying and referencing the specific market segment covered.
12. How do I determine which pricing option suits my needs best?
The pricing options vary based on user requirements and access needs. Individual users may opt for single-user licenses, while businesses requiring broader access may choose multi-user or enterprise licenses for cost-effective access to the report.
13. Are there any additional resources or data provided in the Induced Pluripotent Stem Cell Therapy Industry report?
While the report offers comprehensive insights, it's advisable to review the specific contents or supplementary materials provided to ascertain if additional resources or data are available.
14. How can I stay updated on further developments or reports in the Induced Pluripotent Stem Cell Therapy Industry?
To stay informed about further developments, trends, and reports in the Induced Pluripotent Stem Cell Therapy Industry, consider subscribing to industry newsletters, following relevant companies and organizations, or regularly checking reputable industry news sources and publications.
Methodology
Step 1 - Identification of Relevant Samples Size from Population Database


Step 2 - Approaches for Defining Global Market Size (Value, Volume* & Price*)

Note*: In applicable scenarios
Step 3 - Data Sources
Primary Research
- Web Analytics
- Survey Reports
- Research Institute
- Latest Research Reports
- Opinion Leaders
Secondary Research
- Annual Reports
- White Paper
- Latest Press Release
- Industry Association
- Paid Database
- Investor Presentations

Step 4 - Data Triangulation
Involves using different sources of information in order to increase the validity of a study
These sources are likely to be stakeholders in a program - participants, other researchers, program staff, other community members, and so on.
Then we put all data in single framework & apply various statistical tools to find out the dynamic on the market.
During the analysis stage, feedback from the stakeholder groups would be compared to determine areas of agreement as well as areas of divergence
