

Key Insights
The Kingdom of Saudi Arabia (KSA) satellite imagery services market is experiencing robust growth, driven by increasing government investments in infrastructure development, a burgeoning construction sector, and a rising need for efficient natural resource management. The market's Compound Annual Growth Rate (CAGR) of 12.01% from 2019-2033 indicates significant potential, with the market projected to reach substantial value by 2033. Key applications driving this growth include geospatial data acquisition and mapping for urban planning and infrastructure projects, natural resource management for sustainable development initiatives, surveillance and security for national defense and border protection, and disaster management for improved response capabilities. The involvement of major players like Airbus, Thales, and Leonardo S.p.A., coupled with the growing adoption of advanced technologies, indicates a mature and expanding market landscape. The government sector is the largest end-user, followed by the construction, transportation, and logistics sectors. The market’s growth is fueled by increasing urbanization, expanding digital infrastructure, and the government's Vision 2030 initiative that pushes for technological advancement and sustainable development within the Kingdom.
This market presents lucrative opportunities for both established and emerging players. The ongoing digital transformation across various sectors provides fertile ground for satellite imagery providers to offer advanced solutions, including high-resolution imagery, analytics, and integrated platforms. However, challenges remain, including the need for robust data security measures and the necessity for skilled professionals to effectively utilize and interpret satellite imagery data. Continued investment in technology and talent development will be key to unlocking the full potential of the KSA satellite imagery services market. The market's expansion will likely be further bolstered by partnerships between international companies and local firms fostering knowledge transfer and technology localization. The increasing demand for precise, up-to-date geospatial information will further propel the market's trajectory in the coming years.
KSA Satellite Imagery Services Market: A Comprehensive Report (2019-2033)
This in-depth report provides a comprehensive analysis of the Kingdom of Saudi Arabia (KSA) satellite imagery services market, encompassing market size, growth trends, key players, and future prospects. The report covers the period from 2019 to 2033, with a focus on the forecast period from 2025 to 2033. This detailed analysis is invaluable for businesses, investors, and researchers seeking to understand and capitalize on opportunities within this rapidly expanding sector. The parent market is the broader Middle East & North Africa (MENA) geospatial intelligence market, while the child market focuses specifically on satellite imagery services within KSA.
KSA Satellite Imagery Services Market Dynamics & Structure
The KSA satellite imagery services market is experiencing significant growth driven by increasing government investment in infrastructure development, national security initiatives, and a burgeoning demand for precise geospatial data across diverse sectors. Market concentration is moderate, with both international players and local businesses vying for market share. Technological advancements, such as higher-resolution sensors and improved data processing capabilities, are key innovation drivers. Furthermore, supportive government regulations are fostering market expansion. However, high initial investment costs and the need for specialized expertise present barriers to entry. Competitive substitutes, including aerial photography and LiDAR, exist but offer limited scalability and real-time capabilities. The end-user demographic is diverse, encompassing government agencies, military & defense, construction, transportation, and agriculture. M&A activity within the sector remains relatively low (xx deals in the historical period), but is expected to increase as larger players seek to consolidate their positions.
- Market Concentration: Moderate, with both international and local players.
- Technological Innovation: High-resolution sensors, advanced data analytics are key drivers.
- Regulatory Framework: Supportive government policies and regulations encourage growth.
- Competitive Substitutes: Aerial photography and LiDAR offer limited competition.
- End-User Demographics: Diverse, including government, military, construction, agriculture.
- M&A Trends: Low activity historically (xx deals), potential for increased consolidation.
KSA Satellite Imagery Services Market Growth Trends & Insights
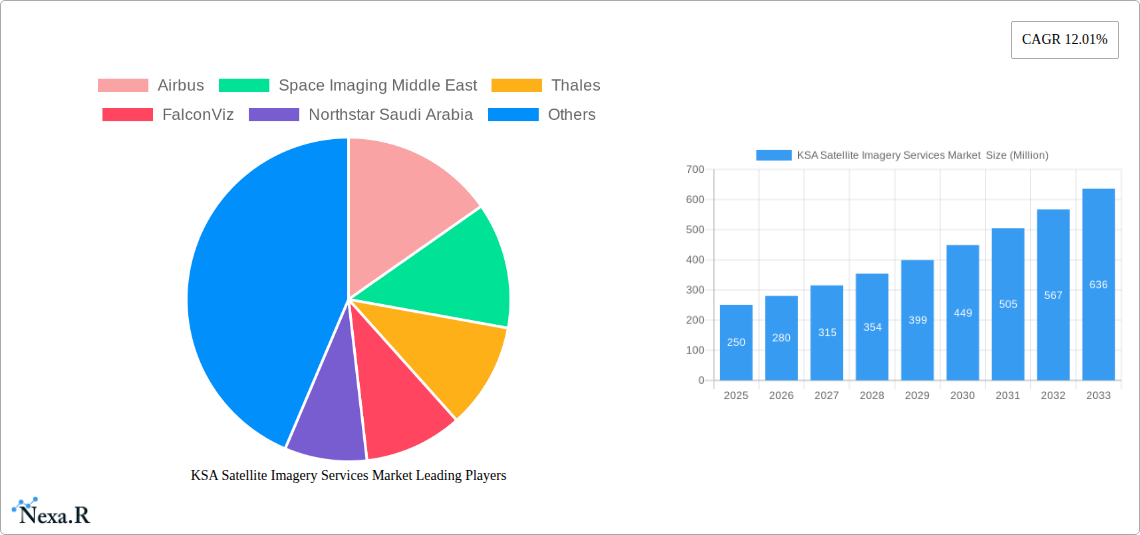
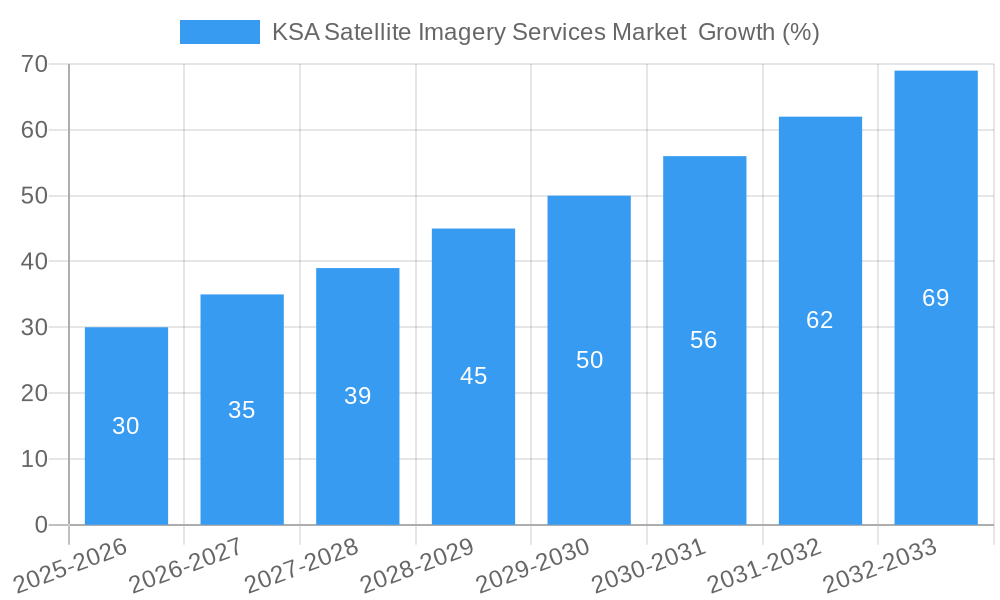
The KSA satellite imagery services market exhibited a CAGR of xx% during the historical period (2019-2024) and is projected to maintain a strong CAGR of xx% during the forecast period (2025-2033). This growth is fueled by rising demand for high-resolution imagery across various applications, coupled with advancements in satellite technology and data analytics. The market size is estimated at 300 Million USD in 2025 and is expected to reach 800 Million USD by 2033. Market penetration is currently at xx% and is expected to increase to xx% by 2033. Technological disruptions, such as the proliferation of small satellite constellations and cloud-based data processing, are accelerating market adoption. Consumer behavior is shifting towards greater reliance on real-time, readily accessible geospatial data, driving demand for value-added services and data analytics capabilities.
Dominant Regions, Countries, or Segments in KSA Satellite Imagery Services Market
The Government segment dominates the end-user market, accounting for approximately 60% of the total market share in 2025, driven by significant investments in national security and infrastructure projects. The Geospatial Data Acquisition and Mapping application segment leads the application market (45% market share in 2025), reflecting the crucial need for precise mapping data in urban planning and resource management.
- Key Drivers (Government Segment): National security initiatives, infrastructure development, urban planning.
- Key Drivers (Geospatial Data Acquisition and Mapping): Urban development, resource management, infrastructure projects.
- Dominance Factors: Government spending, strategic importance of geospatial data.
- Growth Potential: High, driven by ongoing infrastructure development and increasing adoption across various sectors.
KSA Satellite Imagery Services Market Product Landscape
The market offers a range of satellite imagery products and services, including high-resolution panchromatic and multispectral imagery, hyperspectral imagery, and value-added services like data analytics and GIS integration. Recent product innovations focus on improved resolution, faster data delivery, and advanced analytics capabilities. Unique selling propositions include real-time data access, customized data solutions, and integration with existing GIS platforms. The market is witnessing a shift towards cloud-based platforms and AI-driven analytics solutions.
Key Drivers, Barriers & Challenges in KSA Satellite Imagery Services Market
Key Drivers: Government initiatives promoting digital transformation, increasing investments in infrastructure development, and the rising need for accurate geospatial data across various sectors. For example, Vision 2030 aims to modernize the Saudi economy, which heavily relies on precise mapping and resource management.
Challenges: High initial investment costs for satellite technology, the need for specialized expertise, and potential regulatory hurdles related to data security and privacy, impacting market growth. The competitive landscape also presents challenges with several international and local players vying for market share, potentially leading to price wars and margin compression.
Emerging Opportunities in KSA Satellite Imagery Services Market
Untapped market potential exists in applications such as precision agriculture, environmental monitoring, and disaster management. The growing adoption of IoT and AI technologies presents opportunities for the development of innovative solutions integrating satellite data with other data sources. Evolving consumer preferences towards more user-friendly data access and analytics tools create new avenues for value-added services.
Growth Accelerators in the KSA Satellite Imagery Services Market Industry
Technological advancements in satellite technology, particularly the development of high-resolution and hyperspectral sensors, are driving market growth. Strategic partnerships between satellite imagery providers, data analytics companies, and end-users are enabling the development of innovative solutions. Expansion into new applications and markets, such as precision agriculture and disaster management, will further accelerate growth.
Key Players Shaping the KSA Satellite Imagery Services Market Market
- Airbus
- Space Imaging Middle East
- Thales
- FalconViz
- Northstar Saudi Arabia
- Soar Earth Ltd
- Leonardo S.p.A
- Serco
- NOVAsat
Notable Milestones in KSA Satellite Imagery Services Market Sector
- April 2023: King Abdullah University of Science and Technology (KAUST) launched a CubeSat nanosatellite in partnership with Spire Global, enhancing Earth observation capabilities and resource monitoring.
- August 2023: Satellogic partnered with Quant Data & Analytics to provide high-resolution satellite imagery for the Saudi property tech market.
In-Depth KSA Satellite Imagery Services Market Market Outlook
The KSA satellite imagery services market holds substantial future potential, driven by continuous technological advancements, increasing government spending on infrastructure and national security, and the growing adoption of satellite data across various sectors. Strategic partnerships, investments in R&D, and expansion into new application areas will be crucial for realizing this potential. The market is poised for sustained growth, presenting significant opportunities for both established players and new entrants.
KSA Satellite Imagery Services Market Segmentation
-
1. Application
- 1.1. Geospatial Data Acquisition and Mapping
- 1.2. Natural Resource Management
- 1.3. Surveillance and Security
- 1.4. Conservation and Research
- 1.5. Disaster Management
- 1.6. Intelligence
-
2. End-User
- 2.1. Government
- 2.2. Construction
- 2.3. Transportation and Logistics
- 2.4. Military and Defense
- 2.5. Forestry and Agriculture
- 2.6. Others
KSA Satellite Imagery Services Market Segmentation By Geography
-
1. North America
- 1.1. United States
- 1.2. Canada
- 1.3. Mexico
-
2. South America
- 2.1. Brazil
- 2.2. Argentina
- 2.3. Rest of South America
-
3. Europe
- 3.1. United Kingdom
- 3.2. Germany
- 3.3. France
- 3.4. Italy
- 3.5. Spain
- 3.6. Russia
- 3.7. Benelux
- 3.8. Nordics
- 3.9. Rest of Europe
-
4. Middle East & Africa
- 4.1. Turkey
- 4.2. Israel
- 4.3. GCC
- 4.4. North Africa
- 4.5. South Africa
- 4.6. Rest of Middle East & Africa
-
5. Asia Pacific
- 5.1. China
- 5.2. India
- 5.3. Japan
- 5.4. South Korea
- 5.5. ASEAN
- 5.6. Oceania
- 5.7. Rest of Asia Pacific
KSA Satellite Imagery Services Market REPORT HIGHLIGHTS
| Aspects | Details |
|---|---|
| Study Period | 2019-2033 |
| Base Year | 2024 |
| Estimated Year | 2025 |
| Forecast Period | 2025-2033 |
| Historical Period | 2019-2024 |
| Growth Rate | CAGR of 12.01% from 2019-2033 |
| Segmentation |
|
Table of Contents
- 1. Introduction
- 1.1. Research Scope
- 1.2. Market Segmentation
- 1.3. Research Methodology
- 1.4. Definitions and Assumptions
- 2. Executive Summary
- 2.1. Introduction
- 3. Market Dynamics
- 3.1. Introduction
- 3.2. Market Drivers
- 3.2.1. The Growth in the KSA Government's investment in the space sector In Line With Saudi Vision; Adoption of Big Data and Imagery Analytics
- 3.3. Market Restrains
- 3.3.1. High Cost of Satellite Imaging Data Acquisition and Processing
- 3.4. Market Trends
- 3.4.1. Natural Resource Management Segment is Expected to Witness Significant Growth
- 4. Market Factor Analysis
- 4.1. Porters Five Forces
- 4.2. Supply/Value Chain
- 4.3. PESTEL analysis
- 4.4. Market Entropy
- 4.5. Patent/Trademark Analysis
- 5. Global KSA Satellite Imagery Services Market Analysis, Insights and Forecast, 2019-2031
- 5.1. Market Analysis, Insights and Forecast - by Application
- 5.1.1. Geospatial Data Acquisition and Mapping
- 5.1.2. Natural Resource Management
- 5.1.3. Surveillance and Security
- 5.1.4. Conservation and Research
- 5.1.5. Disaster Management
- 5.1.6. Intelligence
- 5.2. Market Analysis, Insights and Forecast - by End-User
- 5.2.1. Government
- 5.2.2. Construction
- 5.2.3. Transportation and Logistics
- 5.2.4. Military and Defense
- 5.2.5. Forestry and Agriculture
- 5.2.6. Others
- 5.3. Market Analysis, Insights and Forecast - by Region
- 5.3.1. North America
- 5.3.2. South America
- 5.3.3. Europe
- 5.3.4. Middle East & Africa
- 5.3.5. Asia Pacific
- 5.1. Market Analysis, Insights and Forecast - by Application
- 6. North America KSA Satellite Imagery Services Market Analysis, Insights and Forecast, 2019-2031
- 6.1. Market Analysis, Insights and Forecast - by Application
- 6.1.1. Geospatial Data Acquisition and Mapping
- 6.1.2. Natural Resource Management
- 6.1.3. Surveillance and Security
- 6.1.4. Conservation and Research
- 6.1.5. Disaster Management
- 6.1.6. Intelligence
- 6.2. Market Analysis, Insights and Forecast - by End-User
- 6.2.1. Government
- 6.2.2. Construction
- 6.2.3. Transportation and Logistics
- 6.2.4. Military and Defense
- 6.2.5. Forestry and Agriculture
- 6.2.6. Others
- 6.1. Market Analysis, Insights and Forecast - by Application
- 7. South America KSA Satellite Imagery Services Market Analysis, Insights and Forecast, 2019-2031
- 7.1. Market Analysis, Insights and Forecast - by Application
- 7.1.1. Geospatial Data Acquisition and Mapping
- 7.1.2. Natural Resource Management
- 7.1.3. Surveillance and Security
- 7.1.4. Conservation and Research
- 7.1.5. Disaster Management
- 7.1.6. Intelligence
- 7.2. Market Analysis, Insights and Forecast - by End-User
- 7.2.1. Government
- 7.2.2. Construction
- 7.2.3. Transportation and Logistics
- 7.2.4. Military and Defense
- 7.2.5. Forestry and Agriculture
- 7.2.6. Others
- 7.1. Market Analysis, Insights and Forecast - by Application
- 8. Europe KSA Satellite Imagery Services Market Analysis, Insights and Forecast, 2019-2031
- 8.1. Market Analysis, Insights and Forecast - by Application
- 8.1.1. Geospatial Data Acquisition and Mapping
- 8.1.2. Natural Resource Management
- 8.1.3. Surveillance and Security
- 8.1.4. Conservation and Research
- 8.1.5. Disaster Management
- 8.1.6. Intelligence
- 8.2. Market Analysis, Insights and Forecast - by End-User
- 8.2.1. Government
- 8.2.2. Construction
- 8.2.3. Transportation and Logistics
- 8.2.4. Military and Defense
- 8.2.5. Forestry and Agriculture
- 8.2.6. Others
- 8.1. Market Analysis, Insights and Forecast - by Application
- 9. Middle East & Africa KSA Satellite Imagery Services Market Analysis, Insights and Forecast, 2019-2031
- 9.1. Market Analysis, Insights and Forecast - by Application
- 9.1.1. Geospatial Data Acquisition and Mapping
- 9.1.2. Natural Resource Management
- 9.1.3. Surveillance and Security
- 9.1.4. Conservation and Research
- 9.1.5. Disaster Management
- 9.1.6. Intelligence
- 9.2. Market Analysis, Insights and Forecast - by End-User
- 9.2.1. Government
- 9.2.2. Construction
- 9.2.3. Transportation and Logistics
- 9.2.4. Military and Defense
- 9.2.5. Forestry and Agriculture
- 9.2.6. Others
- 9.1. Market Analysis, Insights and Forecast - by Application
- 10. Asia Pacific KSA Satellite Imagery Services Market Analysis, Insights and Forecast, 2019-2031
- 10.1. Market Analysis, Insights and Forecast - by Application
- 10.1.1. Geospatial Data Acquisition and Mapping
- 10.1.2. Natural Resource Management
- 10.1.3. Surveillance and Security
- 10.1.4. Conservation and Research
- 10.1.5. Disaster Management
- 10.1.6. Intelligence
- 10.2. Market Analysis, Insights and Forecast - by End-User
- 10.2.1. Government
- 10.2.2. Construction
- 10.2.3. Transportation and Logistics
- 10.2.4. Military and Defense
- 10.2.5. Forestry and Agriculture
- 10.2.6. Others
- 10.1. Market Analysis, Insights and Forecast - by Application
- 11. UAE KSA Satellite Imagery Services Market Analysis, Insights and Forecast, 2019-2031
- 11.1. Market Analysis, Insights and Forecast - By Country/Sub-region
- 11.1.1.
- 12. Saudi Arabia KSA Satellite Imagery Services Market Analysis, Insights and Forecast, 2019-2031
- 12.1. Market Analysis, Insights and Forecast - By Country/Sub-region
- 12.1.1.
- 13. Competitive Analysis
- 13.1. Global Market Share Analysis 2024
- 13.2. Company Profiles
- 13.2.1 Airbus
- 13.2.1.1. Overview
- 13.2.1.2. Products
- 13.2.1.3. SWOT Analysis
- 13.2.1.4. Recent Developments
- 13.2.1.5. Financials (Based on Availability)
- 13.2.2 Space Imaging Middle East
- 13.2.2.1. Overview
- 13.2.2.2. Products
- 13.2.2.3. SWOT Analysis
- 13.2.2.4. Recent Developments
- 13.2.2.5. Financials (Based on Availability)
- 13.2.3 Thales
- 13.2.3.1. Overview
- 13.2.3.2. Products
- 13.2.3.3. SWOT Analysis
- 13.2.3.4. Recent Developments
- 13.2.3.5. Financials (Based on Availability)
- 13.2.4 FalconViz
- 13.2.4.1. Overview
- 13.2.4.2. Products
- 13.2.4.3. SWOT Analysis
- 13.2.4.4. Recent Developments
- 13.2.4.5. Financials (Based on Availability)
- 13.2.5 Northstar Saudi Arabia
- 13.2.5.1. Overview
- 13.2.5.2. Products
- 13.2.5.3. SWOT Analysis
- 13.2.5.4. Recent Developments
- 13.2.5.5. Financials (Based on Availability)
- 13.2.6 Soar Earth Ltd
- 13.2.6.1. Overview
- 13.2.6.2. Products
- 13.2.6.3. SWOT Analysis
- 13.2.6.4. Recent Developments
- 13.2.6.5. Financials (Based on Availability)
- 13.2.7 Leonardo S p A
- 13.2.7.1. Overview
- 13.2.7.2. Products
- 13.2.7.3. SWOT Analysis
- 13.2.7.4. Recent Developments
- 13.2.7.5. Financials (Based on Availability)
- 13.2.8 Serco
- 13.2.8.1. Overview
- 13.2.8.2. Products
- 13.2.8.3. SWOT Analysis
- 13.2.8.4. Recent Developments
- 13.2.8.5. Financials (Based on Availability)
- 13.2.9 NOVAsat
- 13.2.9.1. Overview
- 13.2.9.2. Products
- 13.2.9.3. SWOT Analysis
- 13.2.9.4. Recent Developments
- 13.2.9.5. Financials (Based on Availability)
- 13.2.1 Airbus
List of Figures
- Figure 1: Global KSA Satellite Imagery Services Market Revenue Breakdown (Million, %) by Region 2024 & 2032
- Figure 2: Global KSA Satellite Imagery Services Market Volume Breakdown (K Unit, %) by Region 2024 & 2032
- Figure 3: UAE KSA Satellite Imagery Services Market Revenue (Million), by Country 2024 & 2032
- Figure 4: UAE KSA Satellite Imagery Services Market Volume (K Unit), by Country 2024 & 2032
- Figure 5: UAE KSA Satellite Imagery Services Market Revenue Share (%), by Country 2024 & 2032
- Figure 6: UAE KSA Satellite Imagery Services Market Volume Share (%), by Country 2024 & 2032
- Figure 7: Saudi Arabia KSA Satellite Imagery Services Market Revenue (Million), by Country 2024 & 2032
- Figure 8: Saudi Arabia KSA Satellite Imagery Services Market Volume (K Unit), by Country 2024 & 2032
- Figure 9: Saudi Arabia KSA Satellite Imagery Services Market Revenue Share (%), by Country 2024 & 2032
- Figure 10: Saudi Arabia KSA Satellite Imagery Services Market Volume Share (%), by Country 2024 & 2032
- Figure 11: North America KSA Satellite Imagery Services Market Revenue (Million), by Application 2024 & 2032
- Figure 12: North America KSA Satellite Imagery Services Market Volume (K Unit), by Application 2024 & 2032
- Figure 13: North America KSA Satellite Imagery Services Market Revenue Share (%), by Application 2024 & 2032
- Figure 14: North America KSA Satellite Imagery Services Market Volume Share (%), by Application 2024 & 2032
- Figure 15: North America KSA Satellite Imagery Services Market Revenue (Million), by End-User 2024 & 2032
- Figure 16: North America KSA Satellite Imagery Services Market Volume (K Unit), by End-User 2024 & 2032
- Figure 17: North America KSA Satellite Imagery Services Market Revenue Share (%), by End-User 2024 & 2032
- Figure 18: North America KSA Satellite Imagery Services Market Volume Share (%), by End-User 2024 & 2032
- Figure 19: North America KSA Satellite Imagery Services Market Revenue (Million), by Country 2024 & 2032
- Figure 20: North America KSA Satellite Imagery Services Market Volume (K Unit), by Country 2024 & 2032
- Figure 21: North America KSA Satellite Imagery Services Market Revenue Share (%), by Country 2024 & 2032
- Figure 22: North America KSA Satellite Imagery Services Market Volume Share (%), by Country 2024 & 2032
- Figure 23: South America KSA Satellite Imagery Services Market Revenue (Million), by Application 2024 & 2032
- Figure 24: South America KSA Satellite Imagery Services Market Volume (K Unit), by Application 2024 & 2032
- Figure 25: South America KSA Satellite Imagery Services Market Revenue Share (%), by Application 2024 & 2032
- Figure 26: South America KSA Satellite Imagery Services Market Volume Share (%), by Application 2024 & 2032
- Figure 27: South America KSA Satellite Imagery Services Market Revenue (Million), by End-User 2024 & 2032
- Figure 28: South America KSA Satellite Imagery Services Market Volume (K Unit), by End-User 2024 & 2032
- Figure 29: South America KSA Satellite Imagery Services Market Revenue Share (%), by End-User 2024 & 2032
- Figure 30: South America KSA Satellite Imagery Services Market Volume Share (%), by End-User 2024 & 2032
- Figure 31: South America KSA Satellite Imagery Services Market Revenue (Million), by Country 2024 & 2032
- Figure 32: South America KSA Satellite Imagery Services Market Volume (K Unit), by Country 2024 & 2032
- Figure 33: South America KSA Satellite Imagery Services Market Revenue Share (%), by Country 2024 & 2032
- Figure 34: South America KSA Satellite Imagery Services Market Volume Share (%), by Country 2024 & 2032
- Figure 35: Europe KSA Satellite Imagery Services Market Revenue (Million), by Application 2024 & 2032
- Figure 36: Europe KSA Satellite Imagery Services Market Volume (K Unit), by Application 2024 & 2032
- Figure 37: Europe KSA Satellite Imagery Services Market Revenue Share (%), by Application 2024 & 2032
- Figure 38: Europe KSA Satellite Imagery Services Market Volume Share (%), by Application 2024 & 2032
- Figure 39: Europe KSA Satellite Imagery Services Market Revenue (Million), by End-User 2024 & 2032
- Figure 40: Europe KSA Satellite Imagery Services Market Volume (K Unit), by End-User 2024 & 2032
- Figure 41: Europe KSA Satellite Imagery Services Market Revenue Share (%), by End-User 2024 & 2032
- Figure 42: Europe KSA Satellite Imagery Services Market Volume Share (%), by End-User 2024 & 2032
- Figure 43: Europe KSA Satellite Imagery Services Market Revenue (Million), by Country 2024 & 2032
- Figure 44: Europe KSA Satellite Imagery Services Market Volume (K Unit), by Country 2024 & 2032
- Figure 45: Europe KSA Satellite Imagery Services Market Revenue Share (%), by Country 2024 & 2032
- Figure 46: Europe KSA Satellite Imagery Services Market Volume Share (%), by Country 2024 & 2032
- Figure 47: Middle East & Africa KSA Satellite Imagery Services Market Revenue (Million), by Application 2024 & 2032
- Figure 48: Middle East & Africa KSA Satellite Imagery Services Market Volume (K Unit), by Application 2024 & 2032
- Figure 49: Middle East & Africa KSA Satellite Imagery Services Market Revenue Share (%), by Application 2024 & 2032
- Figure 50: Middle East & Africa KSA Satellite Imagery Services Market Volume Share (%), by Application 2024 & 2032
- Figure 51: Middle East & Africa KSA Satellite Imagery Services Market Revenue (Million), by End-User 2024 & 2032
- Figure 52: Middle East & Africa KSA Satellite Imagery Services Market Volume (K Unit), by End-User 2024 & 2032
- Figure 53: Middle East & Africa KSA Satellite Imagery Services Market Revenue Share (%), by End-User 2024 & 2032
- Figure 54: Middle East & Africa KSA Satellite Imagery Services Market Volume Share (%), by End-User 2024 & 2032
- Figure 55: Middle East & Africa KSA Satellite Imagery Services Market Revenue (Million), by Country 2024 & 2032
- Figure 56: Middle East & Africa KSA Satellite Imagery Services Market Volume (K Unit), by Country 2024 & 2032
- Figure 57: Middle East & Africa KSA Satellite Imagery Services Market Revenue Share (%), by Country 2024 & 2032
- Figure 58: Middle East & Africa KSA Satellite Imagery Services Market Volume Share (%), by Country 2024 & 2032
- Figure 59: Asia Pacific KSA Satellite Imagery Services Market Revenue (Million), by Application 2024 & 2032
- Figure 60: Asia Pacific KSA Satellite Imagery Services Market Volume (K Unit), by Application 2024 & 2032
- Figure 61: Asia Pacific KSA Satellite Imagery Services Market Revenue Share (%), by Application 2024 & 2032
- Figure 62: Asia Pacific KSA Satellite Imagery Services Market Volume Share (%), by Application 2024 & 2032
- Figure 63: Asia Pacific KSA Satellite Imagery Services Market Revenue (Million), by End-User 2024 & 2032
- Figure 64: Asia Pacific KSA Satellite Imagery Services Market Volume (K Unit), by End-User 2024 & 2032
- Figure 65: Asia Pacific KSA Satellite Imagery Services Market Revenue Share (%), by End-User 2024 & 2032
- Figure 66: Asia Pacific KSA Satellite Imagery Services Market Volume Share (%), by End-User 2024 & 2032
- Figure 67: Asia Pacific KSA Satellite Imagery Services Market Revenue (Million), by Country 2024 & 2032
- Figure 68: Asia Pacific KSA Satellite Imagery Services Market Volume (K Unit), by Country 2024 & 2032
- Figure 69: Asia Pacific KSA Satellite Imagery Services Market Revenue Share (%), by Country 2024 & 2032
- Figure 70: Asia Pacific KSA Satellite Imagery Services Market Volume Share (%), by Country 2024 & 2032
List of Tables
- Table 1: Global KSA Satellite Imagery Services Market Revenue Million Forecast, by Region 2019 & 2032
- Table 2: Global KSA Satellite Imagery Services Market Volume K Unit Forecast, by Region 2019 & 2032
- Table 3: Global KSA Satellite Imagery Services Market Revenue Million Forecast, by Application 2019 & 2032
- Table 4: Global KSA Satellite Imagery Services Market Volume K Unit Forecast, by Application 2019 & 2032
- Table 5: Global KSA Satellite Imagery Services Market Revenue Million Forecast, by End-User 2019 & 2032
- Table 6: Global KSA Satellite Imagery Services Market Volume K Unit Forecast, by End-User 2019 & 2032
- Table 7: Global KSA Satellite Imagery Services Market Revenue Million Forecast, by Region 2019 & 2032
- Table 8: Global KSA Satellite Imagery Services Market Volume K Unit Forecast, by Region 2019 & 2032
- Table 9: Global KSA Satellite Imagery Services Market Revenue Million Forecast, by Country 2019 & 2032
- Table 10: Global KSA Satellite Imagery Services Market Volume K Unit Forecast, by Country 2019 & 2032
- Table 11: KSA Satellite Imagery Services Market Revenue (Million) Forecast, by Application 2019 & 2032
- Table 12: KSA Satellite Imagery Services Market Volume (K Unit) Forecast, by Application 2019 & 2032
- Table 13: Global KSA Satellite Imagery Services Market Revenue Million Forecast, by Country 2019 & 2032
- Table 14: Global KSA Satellite Imagery Services Market Volume K Unit Forecast, by Country 2019 & 2032
- Table 15: KSA Satellite Imagery Services Market Revenue (Million) Forecast, by Application 2019 & 2032
- Table 16: KSA Satellite Imagery Services Market Volume (K Unit) Forecast, by Application 2019 & 2032
- Table 17: Global KSA Satellite Imagery Services Market Revenue Million Forecast, by Application 2019 & 2032
- Table 18: Global KSA Satellite Imagery Services Market Volume K Unit Forecast, by Application 2019 & 2032
- Table 19: Global KSA Satellite Imagery Services Market Revenue Million Forecast, by End-User 2019 & 2032
- Table 20: Global KSA Satellite Imagery Services Market Volume K Unit Forecast, by End-User 2019 & 2032
- Table 21: Global KSA Satellite Imagery Services Market Revenue Million Forecast, by Country 2019 & 2032
- Table 22: Global KSA Satellite Imagery Services Market Volume K Unit Forecast, by Country 2019 & 2032
- Table 23: United States KSA Satellite Imagery Services Market Revenue (Million) Forecast, by Application 2019 & 2032
- Table 24: United States KSA Satellite Imagery Services Market Volume (K Unit) Forecast, by Application 2019 & 2032
- Table 25: Canada KSA Satellite Imagery Services Market Revenue (Million) Forecast, by Application 2019 & 2032
- Table 26: Canada KSA Satellite Imagery Services Market Volume (K Unit) Forecast, by Application 2019 & 2032
- Table 27: Mexico KSA Satellite Imagery Services Market Revenue (Million) Forecast, by Application 2019 & 2032
- Table 28: Mexico KSA Satellite Imagery Services Market Volume (K Unit) Forecast, by Application 2019 & 2032
- Table 29: Global KSA Satellite Imagery Services Market Revenue Million Forecast, by Application 2019 & 2032
- Table 30: Global KSA Satellite Imagery Services Market Volume K Unit Forecast, by Application 2019 & 2032
- Table 31: Global KSA Satellite Imagery Services Market Revenue Million Forecast, by End-User 2019 & 2032
- Table 32: Global KSA Satellite Imagery Services Market Volume K Unit Forecast, by End-User 2019 & 2032
- Table 33: Global KSA Satellite Imagery Services Market Revenue Million Forecast, by Country 2019 & 2032
- Table 34: Global KSA Satellite Imagery Services Market Volume K Unit Forecast, by Country 2019 & 2032
- Table 35: Brazil KSA Satellite Imagery Services Market Revenue (Million) Forecast, by Application 2019 & 2032
- Table 36: Brazil KSA Satellite Imagery Services Market Volume (K Unit) Forecast, by Application 2019 & 2032
- Table 37: Argentina KSA Satellite Imagery Services Market Revenue (Million) Forecast, by Application 2019 & 2032
- Table 38: Argentina KSA Satellite Imagery Services Market Volume (K Unit) Forecast, by Application 2019 & 2032
- Table 39: Rest of South America KSA Satellite Imagery Services Market Revenue (Million) Forecast, by Application 2019 & 2032
- Table 40: Rest of South America KSA Satellite Imagery Services Market Volume (K Unit) Forecast, by Application 2019 & 2032
- Table 41: Global KSA Satellite Imagery Services Market Revenue Million Forecast, by Application 2019 & 2032
- Table 42: Global KSA Satellite Imagery Services Market Volume K Unit Forecast, by Application 2019 & 2032
- Table 43: Global KSA Satellite Imagery Services Market Revenue Million Forecast, by End-User 2019 & 2032
- Table 44: Global KSA Satellite Imagery Services Market Volume K Unit Forecast, by End-User 2019 & 2032
- Table 45: Global KSA Satellite Imagery Services Market Revenue Million Forecast, by Country 2019 & 2032
- Table 46: Global KSA Satellite Imagery Services Market Volume K Unit Forecast, by Country 2019 & 2032
- Table 47: United Kingdom KSA Satellite Imagery Services Market Revenue (Million) Forecast, by Application 2019 & 2032
- Table 48: United Kingdom KSA Satellite Imagery Services Market Volume (K Unit) Forecast, by Application 2019 & 2032
- Table 49: Germany KSA Satellite Imagery Services Market Revenue (Million) Forecast, by Application 2019 & 2032
- Table 50: Germany KSA Satellite Imagery Services Market Volume (K Unit) Forecast, by Application 2019 & 2032
- Table 51: France KSA Satellite Imagery Services Market Revenue (Million) Forecast, by Application 2019 & 2032
- Table 52: France KSA Satellite Imagery Services Market Volume (K Unit) Forecast, by Application 2019 & 2032
- Table 53: Italy KSA Satellite Imagery Services Market Revenue (Million) Forecast, by Application 2019 & 2032
- Table 54: Italy KSA Satellite Imagery Services Market Volume (K Unit) Forecast, by Application 2019 & 2032
- Table 55: Spain KSA Satellite Imagery Services Market Revenue (Million) Forecast, by Application 2019 & 2032
- Table 56: Spain KSA Satellite Imagery Services Market Volume (K Unit) Forecast, by Application 2019 & 2032
- Table 57: Russia KSA Satellite Imagery Services Market Revenue (Million) Forecast, by Application 2019 & 2032
- Table 58: Russia KSA Satellite Imagery Services Market Volume (K Unit) Forecast, by Application 2019 & 2032
- Table 59: Benelux KSA Satellite Imagery Services Market Revenue (Million) Forecast, by Application 2019 & 2032
- Table 60: Benelux KSA Satellite Imagery Services Market Volume (K Unit) Forecast, by Application 2019 & 2032
- Table 61: Nordics KSA Satellite Imagery Services Market Revenue (Million) Forecast, by Application 2019 & 2032
- Table 62: Nordics KSA Satellite Imagery Services Market Volume (K Unit) Forecast, by Application 2019 & 2032
- Table 63: Rest of Europe KSA Satellite Imagery Services Market Revenue (Million) Forecast, by Application 2019 & 2032
- Table 64: Rest of Europe KSA Satellite Imagery Services Market Volume (K Unit) Forecast, by Application 2019 & 2032
- Table 65: Global KSA Satellite Imagery Services Market Revenue Million Forecast, by Application 2019 & 2032
- Table 66: Global KSA Satellite Imagery Services Market Volume K Unit Forecast, by Application 2019 & 2032
- Table 67: Global KSA Satellite Imagery Services Market Revenue Million Forecast, by End-User 2019 & 2032
- Table 68: Global KSA Satellite Imagery Services Market Volume K Unit Forecast, by End-User 2019 & 2032
- Table 69: Global KSA Satellite Imagery Services Market Revenue Million Forecast, by Country 2019 & 2032
- Table 70: Global KSA Satellite Imagery Services Market Volume K Unit Forecast, by Country 2019 & 2032
- Table 71: Turkey KSA Satellite Imagery Services Market Revenue (Million) Forecast, by Application 2019 & 2032
- Table 72: Turkey KSA Satellite Imagery Services Market Volume (K Unit) Forecast, by Application 2019 & 2032
- Table 73: Israel KSA Satellite Imagery Services Market Revenue (Million) Forecast, by Application 2019 & 2032
- Table 74: Israel KSA Satellite Imagery Services Market Volume (K Unit) Forecast, by Application 2019 & 2032
- Table 75: GCC KSA Satellite Imagery Services Market Revenue (Million) Forecast, by Application 2019 & 2032
- Table 76: GCC KSA Satellite Imagery Services Market Volume (K Unit) Forecast, by Application 2019 & 2032
- Table 77: North Africa KSA Satellite Imagery Services Market Revenue (Million) Forecast, by Application 2019 & 2032
- Table 78: North Africa KSA Satellite Imagery Services Market Volume (K Unit) Forecast, by Application 2019 & 2032
- Table 79: South Africa KSA Satellite Imagery Services Market Revenue (Million) Forecast, by Application 2019 & 2032
- Table 80: South Africa KSA Satellite Imagery Services Market Volume (K Unit) Forecast, by Application 2019 & 2032
- Table 81: Rest of Middle East & Africa KSA Satellite Imagery Services Market Revenue (Million) Forecast, by Application 2019 & 2032
- Table 82: Rest of Middle East & Africa KSA Satellite Imagery Services Market Volume (K Unit) Forecast, by Application 2019 & 2032
- Table 83: Global KSA Satellite Imagery Services Market Revenue Million Forecast, by Application 2019 & 2032
- Table 84: Global KSA Satellite Imagery Services Market Volume K Unit Forecast, by Application 2019 & 2032
- Table 85: Global KSA Satellite Imagery Services Market Revenue Million Forecast, by End-User 2019 & 2032
- Table 86: Global KSA Satellite Imagery Services Market Volume K Unit Forecast, by End-User 2019 & 2032
- Table 87: Global KSA Satellite Imagery Services Market Revenue Million Forecast, by Country 2019 & 2032
- Table 88: Global KSA Satellite Imagery Services Market Volume K Unit Forecast, by Country 2019 & 2032
- Table 89: China KSA Satellite Imagery Services Market Revenue (Million) Forecast, by Application 2019 & 2032
- Table 90: China KSA Satellite Imagery Services Market Volume (K Unit) Forecast, by Application 2019 & 2032
- Table 91: India KSA Satellite Imagery Services Market Revenue (Million) Forecast, by Application 2019 & 2032
- Table 92: India KSA Satellite Imagery Services Market Volume (K Unit) Forecast, by Application 2019 & 2032
- Table 93: Japan KSA Satellite Imagery Services Market Revenue (Million) Forecast, by Application 2019 & 2032
- Table 94: Japan KSA Satellite Imagery Services Market Volume (K Unit) Forecast, by Application 2019 & 2032
- Table 95: South Korea KSA Satellite Imagery Services Market Revenue (Million) Forecast, by Application 2019 & 2032
- Table 96: South Korea KSA Satellite Imagery Services Market Volume (K Unit) Forecast, by Application 2019 & 2032
- Table 97: ASEAN KSA Satellite Imagery Services Market Revenue (Million) Forecast, by Application 2019 & 2032
- Table 98: ASEAN KSA Satellite Imagery Services Market Volume (K Unit) Forecast, by Application 2019 & 2032
- Table 99: Oceania KSA Satellite Imagery Services Market Revenue (Million) Forecast, by Application 2019 & 2032
- Table 100: Oceania KSA Satellite Imagery Services Market Volume (K Unit) Forecast, by Application 2019 & 2032
- Table 101: Rest of Asia Pacific KSA Satellite Imagery Services Market Revenue (Million) Forecast, by Application 2019 & 2032
- Table 102: Rest of Asia Pacific KSA Satellite Imagery Services Market Volume (K Unit) Forecast, by Application 2019 & 2032
Frequently Asked Questions
1. What is the projected Compound Annual Growth Rate (CAGR) of the KSA Satellite Imagery Services Market ?
The projected CAGR is approximately 12.01%.
2. Which companies are prominent players in the KSA Satellite Imagery Services Market ?
Key companies in the market include Airbus, Space Imaging Middle East, Thales, FalconViz, Northstar Saudi Arabia, Soar Earth Ltd, Leonardo S p A, Serco, NOVAsat.
3. What are the main segments of the KSA Satellite Imagery Services Market ?
The market segments include Application, End-User.
4. Can you provide details about the market size?
The market size is estimated to be USD XX Million as of 2022.
5. What are some drivers contributing to market growth?
The Growth in the KSA Government's investment in the space sector In Line With Saudi Vision; Adoption of Big Data and Imagery Analytics.
6. What are the notable trends driving market growth?
Natural Resource Management Segment is Expected to Witness Significant Growth.
7. Are there any restraints impacting market growth?
High Cost of Satellite Imaging Data Acquisition and Processing.
8. Can you provide examples of recent developments in the market?
August 2023 - Satellogic signed an agreement with Quant Data & Analytics, a Saudi data solutions provider for real estate and retail sectors. Quant Data & Analytics plans to use Satellogic's high-resolution satellite imagery to serve the property tech landscape in Saudi Arabia and the Gulf region.
9. What pricing options are available for accessing the report?
Pricing options include single-user, multi-user, and enterprise licenses priced at USD 3800, USD 4500, and USD 5800 respectively.
10. Is the market size provided in terms of value or volume?
The market size is provided in terms of value, measured in Million and volume, measured in K Unit.
11. Are there any specific market keywords associated with the report?
Yes, the market keyword associated with the report is "KSA Satellite Imagery Services Market ," which aids in identifying and referencing the specific market segment covered.
12. How do I determine which pricing option suits my needs best?
The pricing options vary based on user requirements and access needs. Individual users may opt for single-user licenses, while businesses requiring broader access may choose multi-user or enterprise licenses for cost-effective access to the report.
13. Are there any additional resources or data provided in the KSA Satellite Imagery Services Market report?
While the report offers comprehensive insights, it's advisable to review the specific contents or supplementary materials provided to ascertain if additional resources or data are available.
14. How can I stay updated on further developments or reports in the KSA Satellite Imagery Services Market ?
To stay informed about further developments, trends, and reports in the KSA Satellite Imagery Services Market , consider subscribing to industry newsletters, following relevant companies and organizations, or regularly checking reputable industry news sources and publications.
Methodology
Step 1 - Identification of Relevant Samples Size from Population Database


Step 2 - Approaches for Defining Global Market Size (Value, Volume* & Price*)

Note*: In applicable scenarios
Step 3 - Data Sources
Primary Research
- Web Analytics
- Survey Reports
- Research Institute
- Latest Research Reports
- Opinion Leaders
Secondary Research
- Annual Reports
- White Paper
- Latest Press Release
- Industry Association
- Paid Database
- Investor Presentations

Step 4 - Data Triangulation
Involves using different sources of information in order to increase the validity of a study
These sources are likely to be stakeholders in a program - participants, other researchers, program staff, other community members, and so on.
Then we put all data in single framework & apply various statistical tools to find out the dynamic on the market.
During the analysis stage, feedback from the stakeholder groups would be compared to determine areas of agreement as well as areas of divergence
