

Key Insights
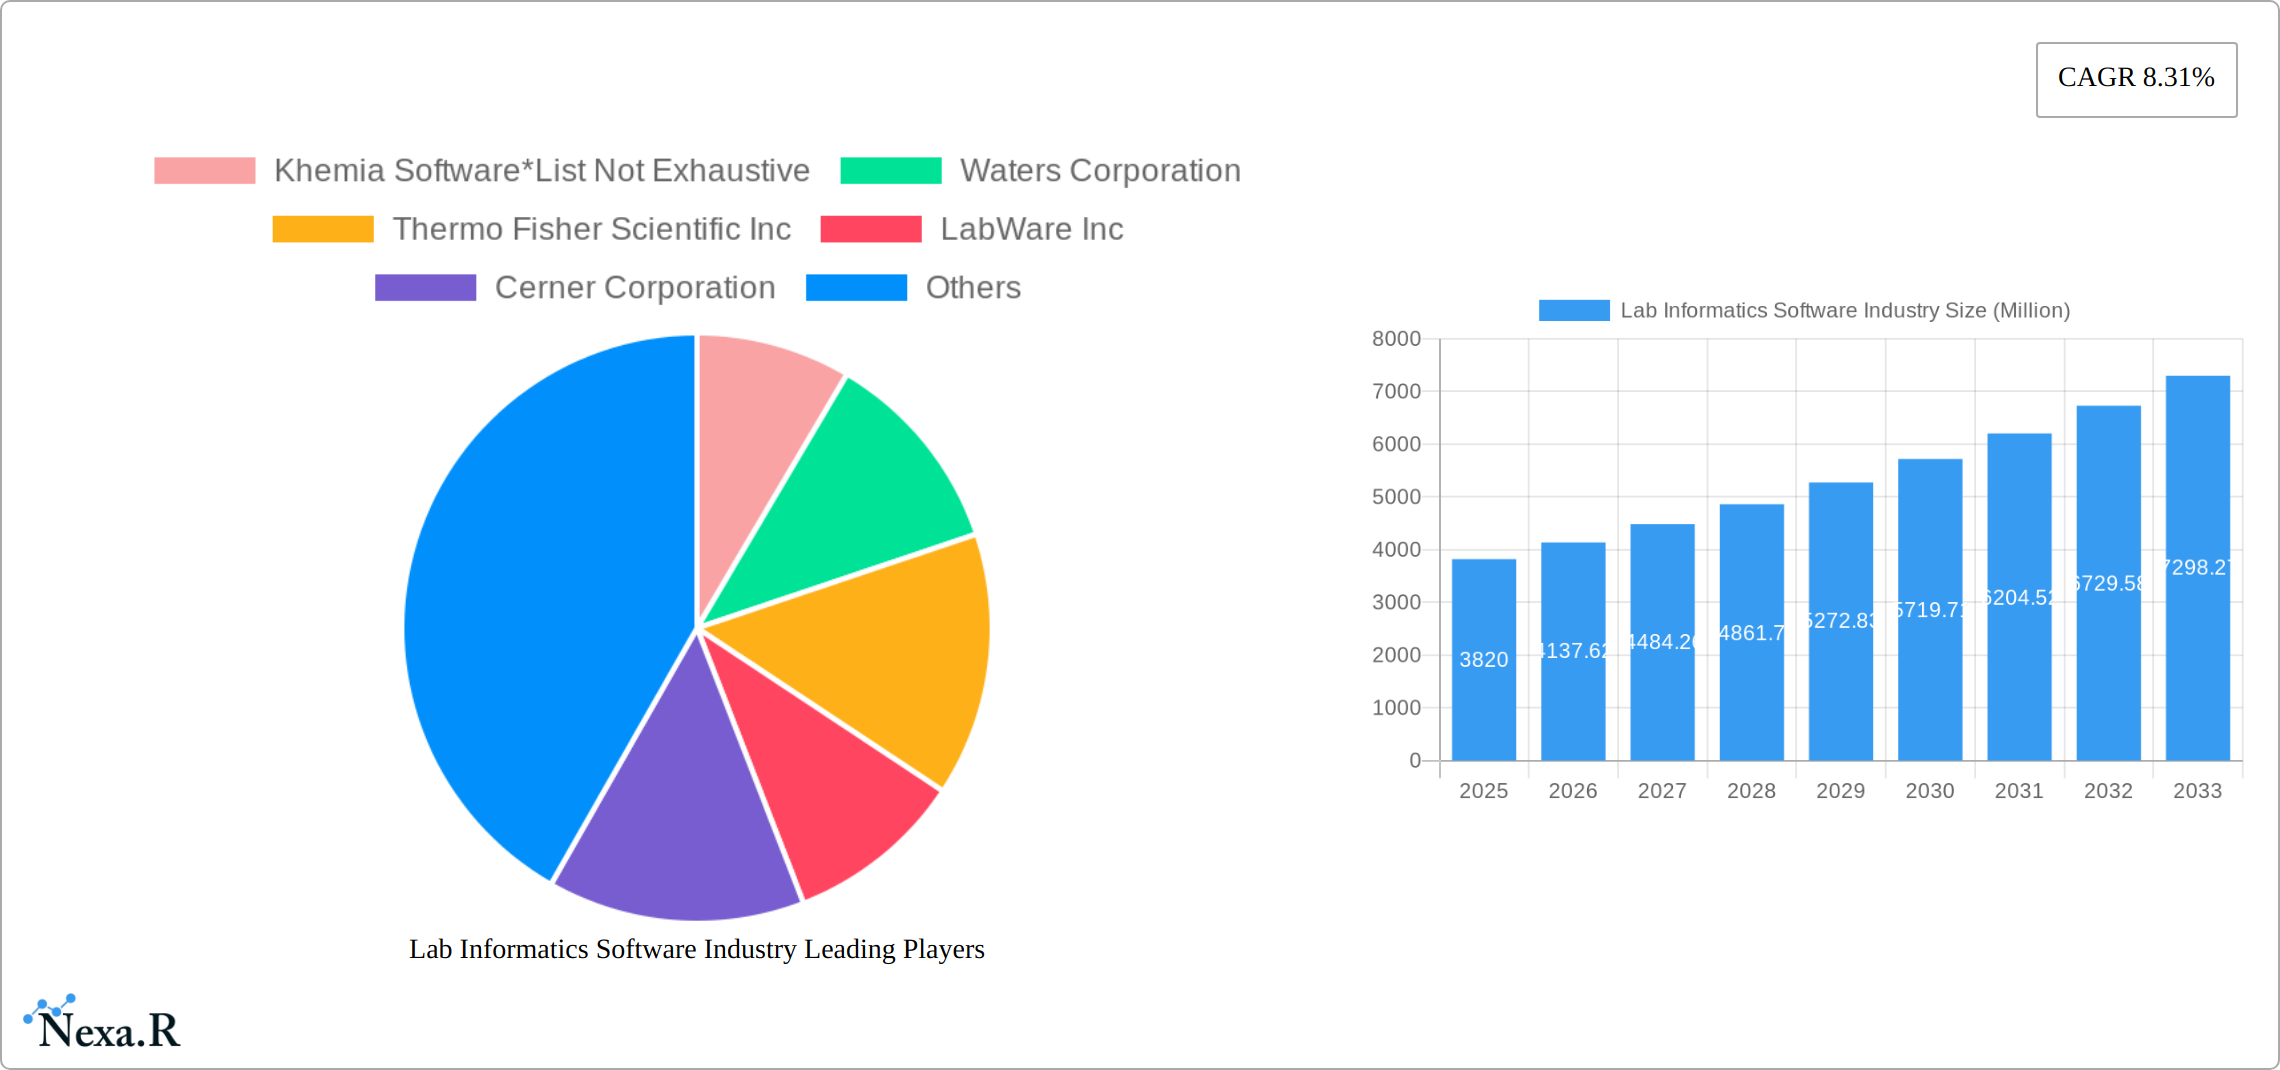
The Lab Informatics Software market, valued at $3.82 billion in 2025, is experiencing robust growth, projected to expand at a compound annual growth rate (CAGR) of 8.31% from 2025 to 2033. This expansion is driven by several key factors. Increasing regulatory pressures on data management within the life sciences and healthcare industries necessitate the adoption of sophisticated software solutions for data integrity, compliance, and efficient workflows. Furthermore, the growing adoption of cloud-based solutions offers enhanced scalability, accessibility, and cost-effectiveness, fueling market growth. The rising volume of data generated in research and development, coupled with the need for advanced analytics and data visualization tools, further propels demand. Significant advancements in software capabilities, including AI-driven automation and integration with laboratory instruments, are also contributing to market expansion. The market is segmented by product (LIMS, ELN, ECM, LES, CDS, SDMS, EDC, CDMS), component (software, services), and delivery mode (on-premise, web-hosted, cloud-based). The cloud-based segment is expected to witness the highest growth due to its inherent advantages. North America currently holds a significant market share, driven by a strong presence of pharmaceutical and biotechnology companies and advanced technological infrastructure. However, the Asia-Pacific region is poised for rapid growth due to increasing R&D investments and expanding healthcare infrastructure. Competition is intense, with established players like Thermo Fisher Scientific, Waters Corporation, and Agilent Technologies competing with specialized software providers.
The competitive landscape is characterized by both large multinational corporations and smaller, specialized software companies. Large players leverage their established brand recognition and extensive customer networks to maintain market leadership. Smaller companies often focus on niche applications or innovative solutions, driving innovation and offering specialized services. Strategic alliances, partnerships, and acquisitions are prevalent strategies for market expansion and diversification. The market's future growth hinges on continued technological advancements, regulatory compliance mandates, and increasing adoption in emerging markets. The focus on data security and interoperability will be crucial for vendors to succeed in this rapidly evolving market. Future growth will also depend on addressing challenges associated with data integration, user training, and the need for customized solutions to meet diverse laboratory requirements.
Lab Informatics Software Market Report: 2019-2033
This comprehensive report provides an in-depth analysis of the Lab Informatics Software industry, encompassing market dynamics, growth trends, regional analysis, competitive landscape, and future outlook. The study period covers 2019-2033, with 2025 as the base year and a forecast period of 2025-2033. The report segments the market by product (LIMS, ELN, ECM, LES, CDS, SDMS, EDC, CDMS), component (services, software), and delivery mode (on-premise, web-hosted, cloud-based). The total market value in 2025 is estimated at xx Million and is projected to reach xx Million by 2033.
Lab Informatics Software Industry Market Dynamics & Structure
The Lab Informatics Software market is characterized by a moderately concentrated structure, with key players such as Thermo Fisher Scientific Inc, Waters Corporation, and Agilent Technologies holding significant market share. However, the emergence of specialized niche players and the increasing adoption of cloud-based solutions are fostering competition. Technological innovation, particularly in AI and machine learning for data analysis, is a key driver. Regulatory frameworks, such as HIPAA and GDPR, influence data security and privacy practices, shaping product development. The market is also witnessing increased M&A activity, with larger companies acquiring smaller, specialized firms to expand their product portfolios and market reach.
- Market Concentration: Moderately concentrated, with top 5 players holding approximately xx% market share in 2025.
- Technological Innovation: AI, machine learning, and cloud computing are driving product development and enhanced data analysis capabilities.
- Regulatory Framework: Compliance with HIPAA, GDPR, and other regulations influences software design and data security protocols.
- Competitive Substitutes: Limited direct substitutes exist; however, manual processes remain a competitive challenge, particularly in smaller labs.
- End-User Demographics: Primarily pharmaceutical, biotechnology, clinical research, and academic research institutions.
- M&A Trends: Increasing consolidation, with larger firms acquiring smaller companies to broaden their offerings and geographic reach; an estimated xx M&A deals were recorded between 2019-2024.
Lab Informatics Software Industry Growth Trends & Insights
The Lab Informatics Software market is experiencing robust growth, driven by increasing data volumes in research and development, the demand for improved efficiency and collaboration, and a growing preference for cloud-based solutions. The market witnessed a Compound Annual Growth Rate (CAGR) of xx% during the historical period (2019-2024) and is projected to maintain a CAGR of xx% during the forecast period (2025-2033). This growth is fueled by technological advancements that enhance data analysis, automation, and integration across various laboratory systems. The adoption rate of LIMS and ELN software is particularly high, exceeding xx% in developed regions. The shift towards cloud-based solutions is further accelerating market expansion, driven by scalability, accessibility, and reduced IT infrastructure costs. Changing consumer behavior favors user-friendly interfaces and integrated platforms.

Dominant Regions, Countries, or Segments in Lab Informatics Software Industry
North America holds the dominant position in the Lab Informatics Software market, driven by robust research and development spending, a large pharmaceutical and biotech sector, and early adoption of advanced technologies. Europe follows closely, with significant growth in the life sciences sector. Within product segments, LIMS dominates market share, owing to its critical role in managing laboratory workflows and data. The cloud-based delivery mode is witnessing the fastest growth, surpassing xx% CAGR during the forecast period, driven by flexibility and cost-effectiveness.
Key Regional Drivers:
- North America: High R&D spending, established life sciences industry, early technology adoption.
- Europe: Growing life sciences sector, regulatory compliance needs, increased digitalization efforts.
- Asia-Pacific: Rising R&D investment, expanding pharmaceutical and biotech industries, increasing government support.
Dominant Segments:
- By Product: LIMS (xx% market share in 2025), followed by ELN and SDMS.
- By Component: Software segment holds the largest market share, while services are experiencing faster growth.
- By Delivery Mode: Cloud-based deployments are witnessing the highest growth rate.
Lab Informatics Software Industry Product Landscape
The Lab Informatics Software market showcases a wide range of products, from standalone LIMS systems to fully integrated platforms encompassing ELN, SDMS, and LES functionalities. Recent innovations include AI-powered data analysis tools, enhanced data visualization capabilities, and improved integration with laboratory instruments. Key selling propositions include improved data quality, enhanced workflow efficiency, reduced operational costs, and streamlined regulatory compliance. Technological advancements center on improved user experience, robust data security, and scalable cloud architectures.
Key Drivers, Barriers & Challenges in Lab Informatics Software Industry
Key Drivers:
- Increasing demand for data management and analysis in research and development
- Growing adoption of automation and digitalization in laboratories
- Stringent regulatory requirements for data integrity and security
- Rising need for improved collaboration and data sharing across research teams.
Key Challenges:
- High initial investment costs for software implementation and integration
- Complexity of integrating diverse laboratory systems
- Concerns regarding data security and privacy breaches (estimated xx Million loss annually due to data breaches).
- Lack of skilled personnel to operate and maintain complex software systems.
Emerging Opportunities in Lab Informatics Software Industry
- Expansion into emerging markets with growing R&D activities
- Development of specialized software solutions for niche applications (e.g., genomics, proteomics)
- Integration of blockchain technology for enhanced data security and provenance tracking
- Growing demand for mobile-accessible platforms for remote data access and analysis.
Growth Accelerators in the Lab Informatics Software Industry
Technological advancements, particularly in AI and machine learning, are pivotal in accelerating market growth by enabling advanced data analysis and automation capabilities. Strategic partnerships between software vendors and instrument manufacturers ensure seamless integration and expanded market reach. Furthermore, the increasing focus on cloud-based solutions enhances scalability, accessibility, and reduces IT infrastructure costs, furthering market expansion.
Key Players Shaping the Lab Informatics Software Market
- Khemia Software *List Not Exhaustive
- Waters Corporation
- Thermo Fisher Scientific Inc
- LabWare Inc
- Cerner Corporation
- Abbott Laboratories (Abbott Informatics Corporation)
- PerkinElmer Inc
- LabVantage Solutions Inc
- McKesson Corporation
- Agilent Technologies
- LabLynx Inc
Notable Milestones in Lab Informatics Software Industry Sector
- August 2021: CTI Clinical Trial and Consulting Services partnered with LabWare, Inc. to expand laboratory services for rare disease and cell & gene therapy research.
- March 2021: LabVantage Solutions, Inc. launched LabVantage Analytics, a self-service advanced analytics solution for LIMS data.
In-Depth Lab Informatics Software Industry Market Outlook
The Lab Informatics Software market is poised for continued robust growth, driven by technological advancements, increasing data volumes, and a growing need for efficient data management and analysis across various industries. Strategic partnerships, product innovation, and expansion into emerging markets will further fuel market expansion. The increasing adoption of cloud-based solutions presents significant opportunities for vendors to capitalize on scalability, cost-effectiveness, and enhanced accessibility. The focus on AI-powered tools and improved data visualization capabilities will shape future market trends and ensure continued growth.
Lab Informatics Software Industry Segmentation
-
1. Product
- 1.1. Laboratory Information Management System (LIMS)
- 1.2. Electronic Lab Notebooks (ELN)
- 1.3. Enterprise Content Management (ECM)
- 1.4. Laboratory Execution System (LES)
- 1.5. Chromatography Data System (CDS)
- 1.6. Scientific Data Management System (SDMS)
- 1.7. Electron
-
2. Component
- 2.1. Services
- 2.2. Software
-
3. Delivery Mode
- 3.1. On-premise
- 3.2. Web-hosted
- 3.3. Cloud-based
Lab Informatics Software Industry Segmentation By Geography
-
1. North America
- 1.1. United States
- 1.2. Canada
- 1.3. Mexico
-
2. Europe
- 2.1. Germany
- 2.2. United Kingdom
- 2.3. France
- 2.4. Italy
- 2.5. Spain
- 2.6. Rest of Europe
-
3. Asia Pacific
- 3.1. China
- 3.2. Japan
- 3.3. India
- 3.4. Australia
- 3.5. South Korea
- 3.6. Rest of Asia Pacific
-
4. Middle East and Africa
- 4.1. GCC
- 4.2. South Africa
- 4.3. Rest of Middle East and Africa
-
5. South America
- 5.1. Brazil
- 5.2. Argentina
- 5.3. Rest of South America

Lab Informatics Software Industry REPORT HIGHLIGHTS
| Aspects | Details |
|---|---|
| Study Period | 2019-2033 |
| Base Year | 2024 |
| Estimated Year | 2025 |
| Forecast Period | 2025-2033 |
| Historical Period | 2019-2024 |
| Growth Rate | CAGR of 8.31% from 2019-2033 |
| Segmentation |
|
Table of Contents
- 1. Introduction
- 1.1. Research Scope
- 1.2. Market Segmentation
- 1.3. Research Methodology
- 1.4. Definitions and Assumptions
- 2. Executive Summary
- 2.1. Introduction
- 3. Market Dynamics
- 3.1. Introduction
- 3.2. Market Drivers
- 3.2.1. High Accuracy and Efficiency of Results; Increasing Applications of Lab Informatics Solutions; Increasing Number of Diagnoses
- 3.3. Market Restrains
- 3.3.1. Lack of Integration Standards for Laboratory Informatics; Lack of Skilled Professionals
- 3.4. Market Trends
- 3.4.1. Laboratory Information Management System is Expected to Hold its Highest Market Share in the Product
- 4. Market Factor Analysis
- 4.1. Porters Five Forces
- 4.2. Supply/Value Chain
- 4.3. PESTEL analysis
- 4.4. Market Entropy
- 4.5. Patent/Trademark Analysis
- 5. Global Lab Informatics Software Industry Analysis, Insights and Forecast, 2019-2031
- 5.1. Market Analysis, Insights and Forecast - by Product
- 5.1.1. Laboratory Information Management System (LIMS)
- 5.1.2. Electronic Lab Notebooks (ELN)
- 5.1.3. Enterprise Content Management (ECM)
- 5.1.4. Laboratory Execution System (LES)
- 5.1.5. Chromatography Data System (CDS)
- 5.1.6. Scientific Data Management System (SDMS)
- 5.1.7. Electron
- 5.2. Market Analysis, Insights and Forecast - by Component
- 5.2.1. Services
- 5.2.2. Software
- 5.3. Market Analysis, Insights and Forecast - by Delivery Mode
- 5.3.1. On-premise
- 5.3.2. Web-hosted
- 5.3.3. Cloud-based
- 5.4. Market Analysis, Insights and Forecast - by Region
- 5.4.1. North America
- 5.4.2. Europe
- 5.4.3. Asia Pacific
- 5.4.4. Middle East and Africa
- 5.4.5. South America
- 5.1. Market Analysis, Insights and Forecast - by Product
- 6. North America Lab Informatics Software Industry Analysis, Insights and Forecast, 2019-2031
- 6.1. Market Analysis, Insights and Forecast - by Product
- 6.1.1. Laboratory Information Management System (LIMS)
- 6.1.2. Electronic Lab Notebooks (ELN)
- 6.1.3. Enterprise Content Management (ECM)
- 6.1.4. Laboratory Execution System (LES)
- 6.1.5. Chromatography Data System (CDS)
- 6.1.6. Scientific Data Management System (SDMS)
- 6.1.7. Electron
- 6.2. Market Analysis, Insights and Forecast - by Component
- 6.2.1. Services
- 6.2.2. Software
- 6.3. Market Analysis, Insights and Forecast - by Delivery Mode
- 6.3.1. On-premise
- 6.3.2. Web-hosted
- 6.3.3. Cloud-based
- 6.1. Market Analysis, Insights and Forecast - by Product
- 7. Europe Lab Informatics Software Industry Analysis, Insights and Forecast, 2019-2031
- 7.1. Market Analysis, Insights and Forecast - by Product
- 7.1.1. Laboratory Information Management System (LIMS)
- 7.1.2. Electronic Lab Notebooks (ELN)
- 7.1.3. Enterprise Content Management (ECM)
- 7.1.4. Laboratory Execution System (LES)
- 7.1.5. Chromatography Data System (CDS)
- 7.1.6. Scientific Data Management System (SDMS)
- 7.1.7. Electron
- 7.2. Market Analysis, Insights and Forecast - by Component
- 7.2.1. Services
- 7.2.2. Software
- 7.3. Market Analysis, Insights and Forecast - by Delivery Mode
- 7.3.1. On-premise
- 7.3.2. Web-hosted
- 7.3.3. Cloud-based
- 7.1. Market Analysis, Insights and Forecast - by Product
- 8. Asia Pacific Lab Informatics Software Industry Analysis, Insights and Forecast, 2019-2031
- 8.1. Market Analysis, Insights and Forecast - by Product
- 8.1.1. Laboratory Information Management System (LIMS)
- 8.1.2. Electronic Lab Notebooks (ELN)
- 8.1.3. Enterprise Content Management (ECM)
- 8.1.4. Laboratory Execution System (LES)
- 8.1.5. Chromatography Data System (CDS)
- 8.1.6. Scientific Data Management System (SDMS)
- 8.1.7. Electron
- 8.2. Market Analysis, Insights and Forecast - by Component
- 8.2.1. Services
- 8.2.2. Software
- 8.3. Market Analysis, Insights and Forecast - by Delivery Mode
- 8.3.1. On-premise
- 8.3.2. Web-hosted
- 8.3.3. Cloud-based
- 8.1. Market Analysis, Insights and Forecast - by Product
- 9. Middle East and Africa Lab Informatics Software Industry Analysis, Insights and Forecast, 2019-2031
- 9.1. Market Analysis, Insights and Forecast - by Product
- 9.1.1. Laboratory Information Management System (LIMS)
- 9.1.2. Electronic Lab Notebooks (ELN)
- 9.1.3. Enterprise Content Management (ECM)
- 9.1.4. Laboratory Execution System (LES)
- 9.1.5. Chromatography Data System (CDS)
- 9.1.6. Scientific Data Management System (SDMS)
- 9.1.7. Electron
- 9.2. Market Analysis, Insights and Forecast - by Component
- 9.2.1. Services
- 9.2.2. Software
- 9.3. Market Analysis, Insights and Forecast - by Delivery Mode
- 9.3.1. On-premise
- 9.3.2. Web-hosted
- 9.3.3. Cloud-based
- 9.1. Market Analysis, Insights and Forecast - by Product
- 10. South America Lab Informatics Software Industry Analysis, Insights and Forecast, 2019-2031
- 10.1. Market Analysis, Insights and Forecast - by Product
- 10.1.1. Laboratory Information Management System (LIMS)
- 10.1.2. Electronic Lab Notebooks (ELN)
- 10.1.3. Enterprise Content Management (ECM)
- 10.1.4. Laboratory Execution System (LES)
- 10.1.5. Chromatography Data System (CDS)
- 10.1.6. Scientific Data Management System (SDMS)
- 10.1.7. Electron
- 10.2. Market Analysis, Insights and Forecast - by Component
- 10.2.1. Services
- 10.2.2. Software
- 10.3. Market Analysis, Insights and Forecast - by Delivery Mode
- 10.3.1. On-premise
- 10.3.2. Web-hosted
- 10.3.3. Cloud-based
- 10.1. Market Analysis, Insights and Forecast - by Product
- 11. North Americ Lab Informatics Software Industry Analysis, Insights and Forecast, 2019-2031
- 11.1. Market Analysis, Insights and Forecast - By Country/Sub-region
- 11.1.1 United States
- 11.1.2 Canada
- 11.1.3 Mexico
- 12. South America Lab Informatics Software Industry Analysis, Insights and Forecast, 2019-2031
- 12.1. Market Analysis, Insights and Forecast - By Country/Sub-region
- 12.1.1 Brazil
- 12.1.2 Mexico
- 12.1.3 Rest of South America
- 13. Europe Lab Informatics Software Industry Analysis, Insights and Forecast, 2019-2031
- 13.1. Market Analysis, Insights and Forecast - By Country/Sub-region
- 13.1.1 Germany
- 13.1.2 United Kingdom
- 13.1.3 France
- 13.1.4 Italy
- 13.1.5 Spain
- 13.1.6 Rest of Europe
- 14. Asia Pacific Lab Informatics Software Industry Analysis, Insights and Forecast, 2019-2031
- 14.1. Market Analysis, Insights and Forecast - By Country/Sub-region
- 14.1.1 China
- 14.1.2 Japan
- 14.1.3 India
- 14.1.4 South Korea
- 14.1.5 Taiwan
- 14.1.6 Australia
- 14.1.7 Rest of Asia-Pacific
- 15. MEA Lab Informatics Software Industry Analysis, Insights and Forecast, 2019-2031
- 15.1. Market Analysis, Insights and Forecast - By Country/Sub-region
- 15.1.1 Middle East
- 15.1.2 Africa
- 16. Competitive Analysis
- 16.1. Global Market Share Analysis 2024
- 16.2. Company Profiles
- 16.2.1 Khemia Software*List Not Exhaustive
- 16.2.1.1. Overview
- 16.2.1.2. Products
- 16.2.1.3. SWOT Analysis
- 16.2.1.4. Recent Developments
- 16.2.1.5. Financials (Based on Availability)
- 16.2.2 Waters Corporation
- 16.2.2.1. Overview
- 16.2.2.2. Products
- 16.2.2.3. SWOT Analysis
- 16.2.2.4. Recent Developments
- 16.2.2.5. Financials (Based on Availability)
- 16.2.3 Thermo Fisher Scientific Inc
- 16.2.3.1. Overview
- 16.2.3.2. Products
- 16.2.3.3. SWOT Analysis
- 16.2.3.4. Recent Developments
- 16.2.3.5. Financials (Based on Availability)
- 16.2.4 LabWare Inc
- 16.2.4.1. Overview
- 16.2.4.2. Products
- 16.2.4.3. SWOT Analysis
- 16.2.4.4. Recent Developments
- 16.2.4.5. Financials (Based on Availability)
- 16.2.5 Cerner Corporation
- 16.2.5.1. Overview
- 16.2.5.2. Products
- 16.2.5.3. SWOT Analysis
- 16.2.5.4. Recent Developments
- 16.2.5.5. Financials (Based on Availability)
- 16.2.6 Abbott Laboratories (Abbott Informatics Corporation)
- 16.2.6.1. Overview
- 16.2.6.2. Products
- 16.2.6.3. SWOT Analysis
- 16.2.6.4. Recent Developments
- 16.2.6.5. Financials (Based on Availability)
- 16.2.7 PerkinElmer Inc
- 16.2.7.1. Overview
- 16.2.7.2. Products
- 16.2.7.3. SWOT Analysis
- 16.2.7.4. Recent Developments
- 16.2.7.5. Financials (Based on Availability)
- 16.2.8 LabVantage Solutions Inc
- 16.2.8.1. Overview
- 16.2.8.2. Products
- 16.2.8.3. SWOT Analysis
- 16.2.8.4. Recent Developments
- 16.2.8.5. Financials (Based on Availability)
- 16.2.9 McKesson Corporation
- 16.2.9.1. Overview
- 16.2.9.2. Products
- 16.2.9.3. SWOT Analysis
- 16.2.9.4. Recent Developments
- 16.2.9.5. Financials (Based on Availability)
- 16.2.10 Agilent Technologies
- 16.2.10.1. Overview
- 16.2.10.2. Products
- 16.2.10.3. SWOT Analysis
- 16.2.10.4. Recent Developments
- 16.2.10.5. Financials (Based on Availability)
- 16.2.11 LabLynx Inc
- 16.2.11.1. Overview
- 16.2.11.2. Products
- 16.2.11.3. SWOT Analysis
- 16.2.11.4. Recent Developments
- 16.2.11.5. Financials (Based on Availability)
- 16.2.1 Khemia Software*List Not Exhaustive
List of Figures
- Figure 1: Global Lab Informatics Software Industry Revenue Breakdown (Million, %) by Region 2024 & 2032
- Figure 2: North Americ Lab Informatics Software Industry Revenue (Million), by Country 2024 & 2032
- Figure 3: North Americ Lab Informatics Software Industry Revenue Share (%), by Country 2024 & 2032
- Figure 4: South America Lab Informatics Software Industry Revenue (Million), by Country 2024 & 2032
- Figure 5: South America Lab Informatics Software Industry Revenue Share (%), by Country 2024 & 2032
- Figure 6: Europe Lab Informatics Software Industry Revenue (Million), by Country 2024 & 2032
- Figure 7: Europe Lab Informatics Software Industry Revenue Share (%), by Country 2024 & 2032
- Figure 8: Asia Pacific Lab Informatics Software Industry Revenue (Million), by Country 2024 & 2032
- Figure 9: Asia Pacific Lab Informatics Software Industry Revenue Share (%), by Country 2024 & 2032
- Figure 10: MEA Lab Informatics Software Industry Revenue (Million), by Country 2024 & 2032
- Figure 11: MEA Lab Informatics Software Industry Revenue Share (%), by Country 2024 & 2032
- Figure 12: North America Lab Informatics Software Industry Revenue (Million), by Product 2024 & 2032
- Figure 13: North America Lab Informatics Software Industry Revenue Share (%), by Product 2024 & 2032
- Figure 14: North America Lab Informatics Software Industry Revenue (Million), by Component 2024 & 2032
- Figure 15: North America Lab Informatics Software Industry Revenue Share (%), by Component 2024 & 2032
- Figure 16: North America Lab Informatics Software Industry Revenue (Million), by Delivery Mode 2024 & 2032
- Figure 17: North America Lab Informatics Software Industry Revenue Share (%), by Delivery Mode 2024 & 2032
- Figure 18: North America Lab Informatics Software Industry Revenue (Million), by Country 2024 & 2032
- Figure 19: North America Lab Informatics Software Industry Revenue Share (%), by Country 2024 & 2032
- Figure 20: Europe Lab Informatics Software Industry Revenue (Million), by Product 2024 & 2032
- Figure 21: Europe Lab Informatics Software Industry Revenue Share (%), by Product 2024 & 2032
- Figure 22: Europe Lab Informatics Software Industry Revenue (Million), by Component 2024 & 2032
- Figure 23: Europe Lab Informatics Software Industry Revenue Share (%), by Component 2024 & 2032
- Figure 24: Europe Lab Informatics Software Industry Revenue (Million), by Delivery Mode 2024 & 2032
- Figure 25: Europe Lab Informatics Software Industry Revenue Share (%), by Delivery Mode 2024 & 2032
- Figure 26: Europe Lab Informatics Software Industry Revenue (Million), by Country 2024 & 2032
- Figure 27: Europe Lab Informatics Software Industry Revenue Share (%), by Country 2024 & 2032
- Figure 28: Asia Pacific Lab Informatics Software Industry Revenue (Million), by Product 2024 & 2032
- Figure 29: Asia Pacific Lab Informatics Software Industry Revenue Share (%), by Product 2024 & 2032
- Figure 30: Asia Pacific Lab Informatics Software Industry Revenue (Million), by Component 2024 & 2032
- Figure 31: Asia Pacific Lab Informatics Software Industry Revenue Share (%), by Component 2024 & 2032
- Figure 32: Asia Pacific Lab Informatics Software Industry Revenue (Million), by Delivery Mode 2024 & 2032
- Figure 33: Asia Pacific Lab Informatics Software Industry Revenue Share (%), by Delivery Mode 2024 & 2032
- Figure 34: Asia Pacific Lab Informatics Software Industry Revenue (Million), by Country 2024 & 2032
- Figure 35: Asia Pacific Lab Informatics Software Industry Revenue Share (%), by Country 2024 & 2032
- Figure 36: Middle East and Africa Lab Informatics Software Industry Revenue (Million), by Product 2024 & 2032
- Figure 37: Middle East and Africa Lab Informatics Software Industry Revenue Share (%), by Product 2024 & 2032
- Figure 38: Middle East and Africa Lab Informatics Software Industry Revenue (Million), by Component 2024 & 2032
- Figure 39: Middle East and Africa Lab Informatics Software Industry Revenue Share (%), by Component 2024 & 2032
- Figure 40: Middle East and Africa Lab Informatics Software Industry Revenue (Million), by Delivery Mode 2024 & 2032
- Figure 41: Middle East and Africa Lab Informatics Software Industry Revenue Share (%), by Delivery Mode 2024 & 2032
- Figure 42: Middle East and Africa Lab Informatics Software Industry Revenue (Million), by Country 2024 & 2032
- Figure 43: Middle East and Africa Lab Informatics Software Industry Revenue Share (%), by Country 2024 & 2032
- Figure 44: South America Lab Informatics Software Industry Revenue (Million), by Product 2024 & 2032
- Figure 45: South America Lab Informatics Software Industry Revenue Share (%), by Product 2024 & 2032
- Figure 46: South America Lab Informatics Software Industry Revenue (Million), by Component 2024 & 2032
- Figure 47: South America Lab Informatics Software Industry Revenue Share (%), by Component 2024 & 2032
- Figure 48: South America Lab Informatics Software Industry Revenue (Million), by Delivery Mode 2024 & 2032
- Figure 49: South America Lab Informatics Software Industry Revenue Share (%), by Delivery Mode 2024 & 2032
- Figure 50: South America Lab Informatics Software Industry Revenue (Million), by Country 2024 & 2032
- Figure 51: South America Lab Informatics Software Industry Revenue Share (%), by Country 2024 & 2032
List of Tables
- Table 1: Global Lab Informatics Software Industry Revenue Million Forecast, by Region 2019 & 2032
- Table 2: Global Lab Informatics Software Industry Revenue Million Forecast, by Product 2019 & 2032
- Table 3: Global Lab Informatics Software Industry Revenue Million Forecast, by Component 2019 & 2032
- Table 4: Global Lab Informatics Software Industry Revenue Million Forecast, by Delivery Mode 2019 & 2032
- Table 5: Global Lab Informatics Software Industry Revenue Million Forecast, by Region 2019 & 2032
- Table 6: Global Lab Informatics Software Industry Revenue Million Forecast, by Country 2019 & 2032
- Table 7: United States Lab Informatics Software Industry Revenue (Million) Forecast, by Application 2019 & 2032
- Table 8: Canada Lab Informatics Software Industry Revenue (Million) Forecast, by Application 2019 & 2032
- Table 9: Mexico Lab Informatics Software Industry Revenue (Million) Forecast, by Application 2019 & 2032
- Table 10: Global Lab Informatics Software Industry Revenue Million Forecast, by Country 2019 & 2032
- Table 11: Brazil Lab Informatics Software Industry Revenue (Million) Forecast, by Application 2019 & 2032
- Table 12: Mexico Lab Informatics Software Industry Revenue (Million) Forecast, by Application 2019 & 2032
- Table 13: Rest of South America Lab Informatics Software Industry Revenue (Million) Forecast, by Application 2019 & 2032
- Table 14: Global Lab Informatics Software Industry Revenue Million Forecast, by Country 2019 & 2032
- Table 15: Germany Lab Informatics Software Industry Revenue (Million) Forecast, by Application 2019 & 2032
- Table 16: United Kingdom Lab Informatics Software Industry Revenue (Million) Forecast, by Application 2019 & 2032
- Table 17: France Lab Informatics Software Industry Revenue (Million) Forecast, by Application 2019 & 2032
- Table 18: Italy Lab Informatics Software Industry Revenue (Million) Forecast, by Application 2019 & 2032
- Table 19: Spain Lab Informatics Software Industry Revenue (Million) Forecast, by Application 2019 & 2032
- Table 20: Rest of Europe Lab Informatics Software Industry Revenue (Million) Forecast, by Application 2019 & 2032
- Table 21: Global Lab Informatics Software Industry Revenue Million Forecast, by Country 2019 & 2032
- Table 22: China Lab Informatics Software Industry Revenue (Million) Forecast, by Application 2019 & 2032
- Table 23: Japan Lab Informatics Software Industry Revenue (Million) Forecast, by Application 2019 & 2032
- Table 24: India Lab Informatics Software Industry Revenue (Million) Forecast, by Application 2019 & 2032
- Table 25: South Korea Lab Informatics Software Industry Revenue (Million) Forecast, by Application 2019 & 2032
- Table 26: Taiwan Lab Informatics Software Industry Revenue (Million) Forecast, by Application 2019 & 2032
- Table 27: Australia Lab Informatics Software Industry Revenue (Million) Forecast, by Application 2019 & 2032
- Table 28: Rest of Asia-Pacific Lab Informatics Software Industry Revenue (Million) Forecast, by Application 2019 & 2032
- Table 29: Global Lab Informatics Software Industry Revenue Million Forecast, by Country 2019 & 2032
- Table 30: Middle East Lab Informatics Software Industry Revenue (Million) Forecast, by Application 2019 & 2032
- Table 31: Africa Lab Informatics Software Industry Revenue (Million) Forecast, by Application 2019 & 2032
- Table 32: Global Lab Informatics Software Industry Revenue Million Forecast, by Product 2019 & 2032
- Table 33: Global Lab Informatics Software Industry Revenue Million Forecast, by Component 2019 & 2032
- Table 34: Global Lab Informatics Software Industry Revenue Million Forecast, by Delivery Mode 2019 & 2032
- Table 35: Global Lab Informatics Software Industry Revenue Million Forecast, by Country 2019 & 2032
- Table 36: United States Lab Informatics Software Industry Revenue (Million) Forecast, by Application 2019 & 2032
- Table 37: Canada Lab Informatics Software Industry Revenue (Million) Forecast, by Application 2019 & 2032
- Table 38: Mexico Lab Informatics Software Industry Revenue (Million) Forecast, by Application 2019 & 2032
- Table 39: Global Lab Informatics Software Industry Revenue Million Forecast, by Product 2019 & 2032
- Table 40: Global Lab Informatics Software Industry Revenue Million Forecast, by Component 2019 & 2032
- Table 41: Global Lab Informatics Software Industry Revenue Million Forecast, by Delivery Mode 2019 & 2032
- Table 42: Global Lab Informatics Software Industry Revenue Million Forecast, by Country 2019 & 2032
- Table 43: Germany Lab Informatics Software Industry Revenue (Million) Forecast, by Application 2019 & 2032
- Table 44: United Kingdom Lab Informatics Software Industry Revenue (Million) Forecast, by Application 2019 & 2032
- Table 45: France Lab Informatics Software Industry Revenue (Million) Forecast, by Application 2019 & 2032
- Table 46: Italy Lab Informatics Software Industry Revenue (Million) Forecast, by Application 2019 & 2032
- Table 47: Spain Lab Informatics Software Industry Revenue (Million) Forecast, by Application 2019 & 2032
- Table 48: Rest of Europe Lab Informatics Software Industry Revenue (Million) Forecast, by Application 2019 & 2032
- Table 49: Global Lab Informatics Software Industry Revenue Million Forecast, by Product 2019 & 2032
- Table 50: Global Lab Informatics Software Industry Revenue Million Forecast, by Component 2019 & 2032
- Table 51: Global Lab Informatics Software Industry Revenue Million Forecast, by Delivery Mode 2019 & 2032
- Table 52: Global Lab Informatics Software Industry Revenue Million Forecast, by Country 2019 & 2032
- Table 53: China Lab Informatics Software Industry Revenue (Million) Forecast, by Application 2019 & 2032
- Table 54: Japan Lab Informatics Software Industry Revenue (Million) Forecast, by Application 2019 & 2032
- Table 55: India Lab Informatics Software Industry Revenue (Million) Forecast, by Application 2019 & 2032
- Table 56: Australia Lab Informatics Software Industry Revenue (Million) Forecast, by Application 2019 & 2032
- Table 57: South Korea Lab Informatics Software Industry Revenue (Million) Forecast, by Application 2019 & 2032
- Table 58: Rest of Asia Pacific Lab Informatics Software Industry Revenue (Million) Forecast, by Application 2019 & 2032
- Table 59: Global Lab Informatics Software Industry Revenue Million Forecast, by Product 2019 & 2032
- Table 60: Global Lab Informatics Software Industry Revenue Million Forecast, by Component 2019 & 2032
- Table 61: Global Lab Informatics Software Industry Revenue Million Forecast, by Delivery Mode 2019 & 2032
- Table 62: Global Lab Informatics Software Industry Revenue Million Forecast, by Country 2019 & 2032
- Table 63: GCC Lab Informatics Software Industry Revenue (Million) Forecast, by Application 2019 & 2032
- Table 64: South Africa Lab Informatics Software Industry Revenue (Million) Forecast, by Application 2019 & 2032
- Table 65: Rest of Middle East and Africa Lab Informatics Software Industry Revenue (Million) Forecast, by Application 2019 & 2032
- Table 66: Global Lab Informatics Software Industry Revenue Million Forecast, by Product 2019 & 2032
- Table 67: Global Lab Informatics Software Industry Revenue Million Forecast, by Component 2019 & 2032
- Table 68: Global Lab Informatics Software Industry Revenue Million Forecast, by Delivery Mode 2019 & 2032
- Table 69: Global Lab Informatics Software Industry Revenue Million Forecast, by Country 2019 & 2032
- Table 70: Brazil Lab Informatics Software Industry Revenue (Million) Forecast, by Application 2019 & 2032
- Table 71: Argentina Lab Informatics Software Industry Revenue (Million) Forecast, by Application 2019 & 2032
- Table 72: Rest of South America Lab Informatics Software Industry Revenue (Million) Forecast, by Application 2019 & 2032
Frequently Asked Questions
1. What is the projected Compound Annual Growth Rate (CAGR) of the Lab Informatics Software Industry?
The projected CAGR is approximately 8.31%.
2. Which companies are prominent players in the Lab Informatics Software Industry?
Key companies in the market include Khemia Software*List Not Exhaustive, Waters Corporation, Thermo Fisher Scientific Inc, LabWare Inc, Cerner Corporation, Abbott Laboratories (Abbott Informatics Corporation), PerkinElmer Inc, LabVantage Solutions Inc, McKesson Corporation, Agilent Technologies, LabLynx Inc.
3. What are the main segments of the Lab Informatics Software Industry?
The market segments include Product, Component, Delivery Mode.
4. Can you provide details about the market size?
The market size is estimated to be USD 3.82 Million as of 2022.
5. What are some drivers contributing to market growth?
High Accuracy and Efficiency of Results; Increasing Applications of Lab Informatics Solutions; Increasing Number of Diagnoses.
6. What are the notable trends driving market growth?
Laboratory Information Management System is Expected to Hold its Highest Market Share in the Product.
7. Are there any restraints impacting market growth?
Lack of Integration Standards for Laboratory Informatics; Lack of Skilled Professionals.
8. Can you provide examples of recent developments in the market?
In August 2021, CTI Clinical Trial and Consulting Services (CTI) entered into a partnership with LabWare, Inc. to expand laboratory services to support rare disease and cell & gene therapy research across all regions of the world.
9. What pricing options are available for accessing the report?
Pricing options include single-user, multi-user, and enterprise licenses priced at USD 4750, USD 5250, and USD 8750 respectively.
10. Is the market size provided in terms of value or volume?
The market size is provided in terms of value, measured in Million.
11. Are there any specific market keywords associated with the report?
Yes, the market keyword associated with the report is "Lab Informatics Software Industry," which aids in identifying and referencing the specific market segment covered.
12. How do I determine which pricing option suits my needs best?
The pricing options vary based on user requirements and access needs. Individual users may opt for single-user licenses, while businesses requiring broader access may choose multi-user or enterprise licenses for cost-effective access to the report.
13. Are there any additional resources or data provided in the Lab Informatics Software Industry report?
While the report offers comprehensive insights, it's advisable to review the specific contents or supplementary materials provided to ascertain if additional resources or data are available.
14. How can I stay updated on further developments or reports in the Lab Informatics Software Industry?
To stay informed about further developments, trends, and reports in the Lab Informatics Software Industry, consider subscribing to industry newsletters, following relevant companies and organizations, or regularly checking reputable industry news sources and publications.
Methodology
Step 1 - Identification of Relevant Samples Size from Population Database


Step 2 - Approaches for Defining Global Market Size (Value, Volume* & Price*)

Note*: In applicable scenarios
Step 3 - Data Sources
Primary Research
- Web Analytics
- Survey Reports
- Research Institute
- Latest Research Reports
- Opinion Leaders
Secondary Research
- Annual Reports
- White Paper
- Latest Press Release
- Industry Association
- Paid Database
- Investor Presentations

Step 4 - Data Triangulation
Involves using different sources of information in order to increase the validity of a study
These sources are likely to be stakeholders in a program - participants, other researchers, program staff, other community members, and so on.
Then we put all data in single framework & apply various statistical tools to find out the dynamic on the market.
During the analysis stage, feedback from the stakeholder groups would be compared to determine areas of agreement as well as areas of divergence
