

Key Insights
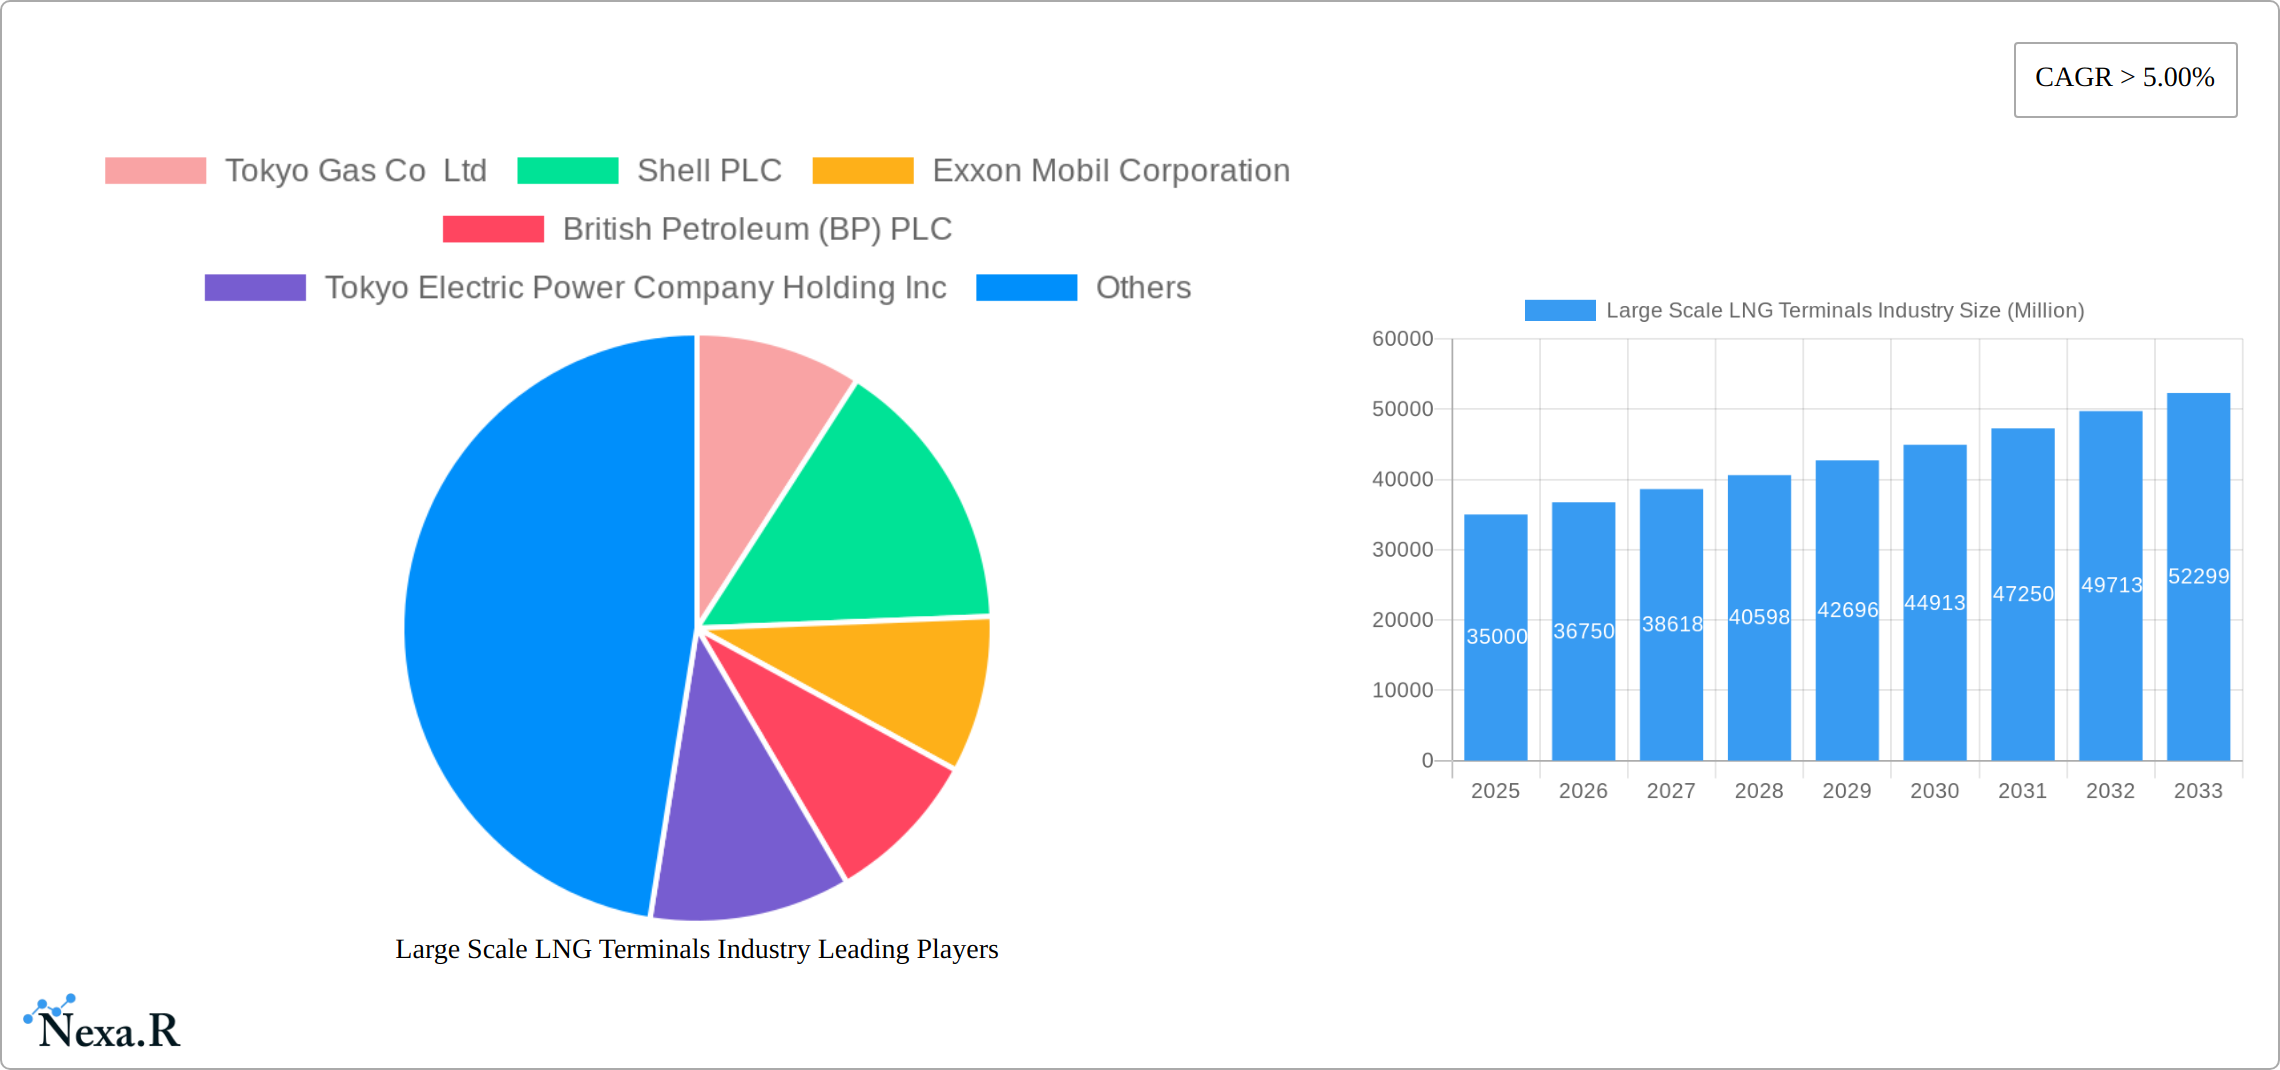
The global large-scale LNG (liquefied natural gas) terminals market is experiencing robust growth, driven by increasing global energy demand, particularly in Asia, and the transition towards cleaner energy sources. The market, currently valued in the billions (exact figure unavailable but estimated based on a significant market size and 5%+ CAGR), is projected to maintain a Compound Annual Growth Rate (CAGR) exceeding 5% through 2033. This growth is fueled by several key factors. Firstly, the increasing adoption of LNG as a cleaner-burning fossil fuel compared to coal and oil is driving significant investment in import and export terminals globally. Secondly, the expanding LNG shipping infrastructure is facilitating trade between regions with surplus and deficit in LNG production, further boosting terminal development. Finally, government policies promoting energy security and diversification are incentivizing investments in large-scale LNG terminal infrastructure. The market is segmented by location (onshore and offshore) and operation (liquefaction and regasification), with onshore regasification currently dominating. Key players such as Tokyo Gas, Shell, ExxonMobil, and Cheniere Energy are actively shaping the market landscape through strategic investments and expansions.
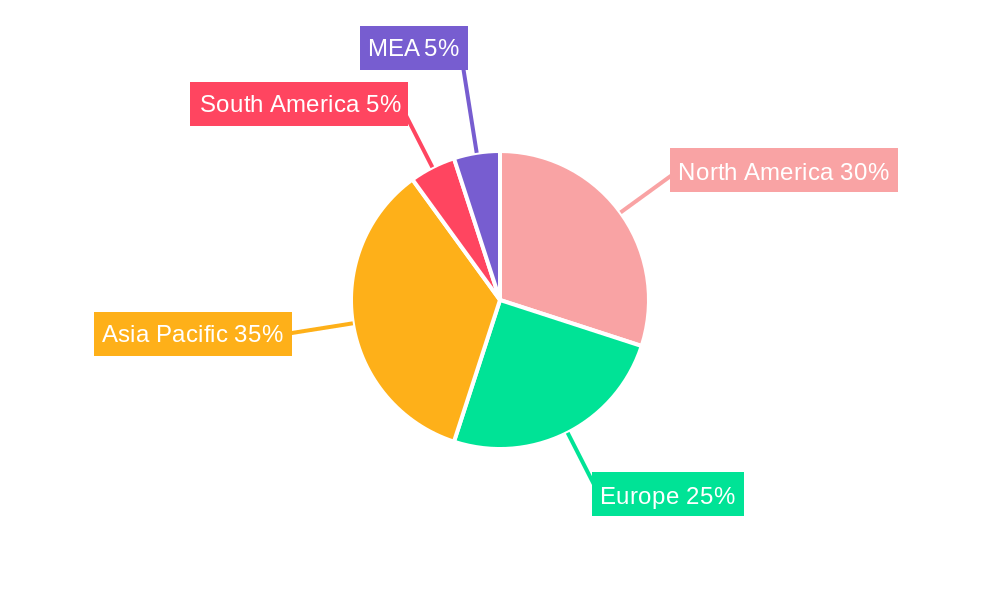
However, the market faces certain challenges. Fluctuations in global LNG prices and geopolitical instability can impact investment decisions and project timelines. Furthermore, the rising costs associated with terminal construction and maintenance, coupled with regulatory hurdles and environmental concerns, could impede growth. Nevertheless, the long-term outlook remains positive, given the sustained demand for LNG and ongoing efforts to mitigate the risks associated with the industry. Regional growth is particularly strong in Asia-Pacific, driven by rapid industrialization and increasing energy consumption in countries like China, Japan, and India. North America also holds a significant market share, fueled by its role as a major LNG exporter. Europe, while facing energy security challenges, is investing heavily in LNG import infrastructure to diversify its energy sources. This dynamic interplay between demand, supply, and geopolitical factors will significantly shape the future of the large-scale LNG terminals market in the coming decade.
Large Scale LNG Terminals Industry Market Report: 2019-2033
This comprehensive report provides an in-depth analysis of the large-scale LNG terminals industry, encompassing market dynamics, growth trends, regional dominance, product landscape, key players, and future outlook. The study period covers 2019-2033, with a base year of 2025 and a forecast period of 2025-2033. The report serves as an invaluable resource for industry professionals, investors, and strategic decision-makers seeking to understand and navigate this dynamic market. Parent markets include the global energy sector and the natural gas market, while child markets include liquefaction and regasification services.
Large Scale LNG Terminals Industry Market Dynamics & Structure
The large-scale LNG terminals market is characterized by moderate concentration, with key players like Shell PLC, Exxon Mobil Corporation, and Cheniere Energy Inc. holding significant market share (estimated at xx% combined in 2025). Technological innovation, driven by the need for enhanced efficiency and reduced emissions, is a key driver. Regulatory frameworks, varying across regions, influence project approvals and operational standards. The market also faces competition from alternative energy sources and pipeline gas, although LNG's versatility and growing demand continue to fuel growth. M&A activity has been relatively robust in recent years, with xx deals recorded between 2019 and 2024, valued at approximately $xx million.
- Market Concentration: Moderately concentrated, with top 5 players holding xx% market share in 2025.
- Technological Innovation: Focus on automation, efficiency improvements, and emission reduction technologies.
- Regulatory Frameworks: Vary significantly across regions, impacting project viability and timelines.
- Competitive Substitutes: Pipeline gas and renewable energy sources.
- M&A Activity: xx deals between 2019 and 2024, totaling approximately $xx million.
- Innovation Barriers: High capital expenditure requirements and complex permitting processes.
Large Scale LNG Terminals Industry Growth Trends & Insights
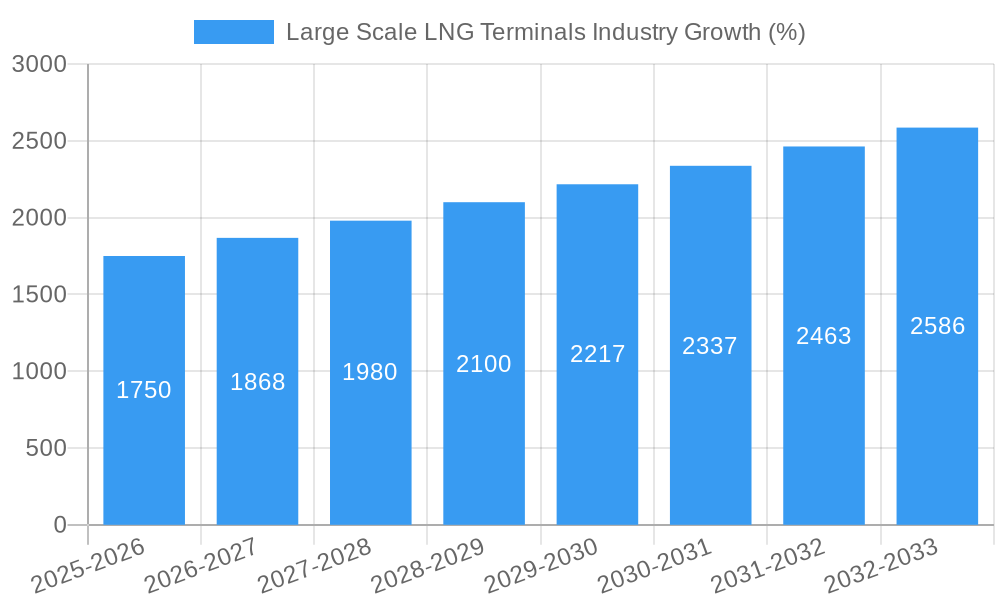
The global large-scale LNG terminals market experienced significant growth between 2019 and 2024, with a CAGR of xx%. This growth is primarily driven by increasing global demand for natural gas, particularly in Asia and Europe, coupled with the ongoing energy transition and diversification away from traditional sources like coal. The market is expected to continue its expansion during the forecast period (2025-2033), with a projected CAGR of xx%, fueled by new terminal constructions, capacity expansions, and technological advancements. Increased investment in LNG infrastructure, growing LNG trading volumes, and supportive government policies are also major contributors to the market's expansion. Market penetration in emerging economies is anticipated to increase significantly by 2033, driven by rising energy consumption and industrial development. Technological disruptions, such as the adoption of floating LNG (FLNG) terminals, are transforming the market landscape, improving efficiency, and reducing environmental impacts. Shifts in consumer behavior towards cleaner energy sources contribute indirectly to the growing demand for LNG as a transition fuel.
Dominant Regions, Countries, or Segments in Large Scale LNG Terminals Industry
Asia, particularly Northeast Asia, dominates the large-scale LNG terminals market, driven by high energy demand and limited domestic natural gas resources. Europe is experiencing rapid growth following geopolitical shifts and increased reliance on LNG imports. The Onshore segment currently holds the largest market share, but the Offshore segment, particularly FLNG, is expected to witness substantial growth due to its flexibility and suitability for deepwater locations. Liquefaction and regasification operations are both integral segments, with a balanced distribution of market share, though liquefaction may be slightly larger in value.
- Key Drivers in Asia: Rapid economic growth, rising energy demand, limited domestic gas resources.
- Key Drivers in Europe: Energy security concerns, transition away from Russian pipeline gas.
- Onshore Segment: Established infrastructure, lower initial investment costs.
- Offshore Segment (FLNG): Flexibility, suitability for deepwater locations, faster deployment times.
- Liquefaction: Necessary for LNG production and export.
- Regasification: Crucial for importing and utilizing LNG.
Large Scale LNG Terminals Industry Product Landscape
The product landscape includes various types of terminals, ranging from conventional onshore facilities to advanced floating LNG (FLNG) units. Technological advancements focus on improving efficiency, reducing emissions, and enhancing safety. Innovations encompass advanced automation systems, optimized cryogenic storage tanks, and innovative liquefaction technologies. The unique selling propositions of various terminals stem from their location, capacity, and technological features, each catering to different market needs and geographical contexts. Performance metrics include liquefaction/regasification capacity, storage capacity, and operational efficiency.
Key Drivers, Barriers & Challenges in Large Scale LNG Terminals Industry
Key Drivers:
- Increasing global demand for natural gas
- Energy security concerns and diversification of energy sources
- Government incentives and supportive policies
- Technological advancements, including FLNG
Challenges and Restraints:
- High capital expenditure requirements for terminal construction
- Complex regulatory approvals and permitting processes
- Geopolitical risks and potential disruptions to supply chains
- Competition from alternative energy sources and pipeline gas, potentially reducing projected growth by xx% by 2033.
Emerging Opportunities in Large Scale LNG Terminals Industry
- Expansion into untapped markets in Africa and South America.
- Development of smaller-scale modular LNG terminals to serve remote regions.
- Integration of renewable energy sources to reduce the carbon footprint of LNG operations.
- Development of innovative LNG bunkering solutions for maritime transportation.
Growth Accelerators in the Large Scale LNG Terminals Industry
Technological breakthroughs in liquefaction and regasification technologies, coupled with strategic partnerships between energy companies and infrastructure developers, are major catalysts for long-term growth. Expansion into new markets and the adoption of sustainable practices further bolster the industry’s future prospects. Government support through policy incentives and investments in LNG infrastructure are also critical factors.
Key Players Shaping the Large Scale LNG Terminals Industry Market
- Tokyo Gas Co Ltd
- Shell PLC
- Exxon Mobil Corporation
- British Petroleum (BP) PLC
- Tokyo Electric Power Company Holding Inc
- Cheniere Energy Inc
- China National Offshore Oil Corporation (CNOOC)
- Chevron Corporation
- Petronet LNG Ltd
- TotalEnergies SE
Notable Milestones in Large Scale LNG Terminals Industry Sector
- November 2022: Germany completed construction of its first floating LNG terminal at Wilhelmshaven, significantly bolstering its LNG import capacity.
- November 2022: China commenced expansion of its Yangshan LNG facility, adding substantial storage capacity and bolstering its domestic LNG handling capabilities.
In-Depth Large Scale LNG Terminals Industry Market Outlook
The large-scale LNG terminals market is poised for sustained growth, driven by persistent global demand for natural gas, technological advancements, and strategic investments. The increasing focus on energy security and the transition to cleaner energy sources will further fuel market expansion. Opportunities exist for companies to capitalize on emerging markets, adopt innovative technologies, and forge strategic partnerships to solidify their positions in this dynamic sector. The market's future potential is considerable, promising significant returns for investors and stakeholders who align with its growth trajectory.
Large Scale LNG Terminals Industry Segmentation
-
1. Location of Deployment
- 1.1. Onshore
- 1.2. Offshore
-
2. Operation
- 2.1. Liquefaction
- 2.2. Regasification
Large Scale LNG Terminals Industry Segmentation By Geography
- 1. North America
- 2. Asia Pacific
- 3. Europe
- 4. South America
- 5. Middle East
Large Scale LNG Terminals Industry REPORT HIGHLIGHTS
| Aspects | Details |
|---|---|
| Study Period | 2019-2033 |
| Base Year | 2024 |
| Estimated Year | 2025 |
| Forecast Period | 2025-2033 |
| Historical Period | 2019-2024 |
| Growth Rate | CAGR of > 5.00% from 2019-2033 |
| Segmentation |
|
Table of Contents
- 1. Introduction
- 1.1. Research Scope
- 1.2. Market Segmentation
- 1.3. Research Methodology
- 1.4. Definitions and Assumptions
- 2. Executive Summary
- 2.1. Introduction
- 3. Market Dynamics
- 3.1. Introduction
- 3.2. Market Drivers
- 3.2.1. 4.; Increasing Demand for Sales of Commercial Vehicles4.; Increasing Deployment of Retail Fuel Outlets Across Various Countries
- 3.3. Market Restrains
- 3.3.1. 4.; Growing Penetration and Demand for Electric Vehicles
- 3.4. Market Trends
- 3.4.1. Regasification LNG Terminals to Dominate the Market
- 4. Market Factor Analysis
- 4.1. Porters Five Forces
- 4.2. Supply/Value Chain
- 4.3. PESTEL analysis
- 4.4. Market Entropy
- 4.5. Patent/Trademark Analysis
- 5. Global Large Scale LNG Terminals Industry Analysis, Insights and Forecast, 2019-2031
- 5.1. Market Analysis, Insights and Forecast - by Location of Deployment
- 5.1.1. Onshore
- 5.1.2. Offshore
- 5.2. Market Analysis, Insights and Forecast - by Operation
- 5.2.1. Liquefaction
- 5.2.2. Regasification
- 5.3. Market Analysis, Insights and Forecast - by Region
- 5.3.1. North America
- 5.3.2. Asia Pacific
- 5.3.3. Europe
- 5.3.4. South America
- 5.3.5. Middle East
- 5.1. Market Analysis, Insights and Forecast - by Location of Deployment
- 6. North America Large Scale LNG Terminals Industry Analysis, Insights and Forecast, 2019-2031
- 6.1. Market Analysis, Insights and Forecast - by Location of Deployment
- 6.1.1. Onshore
- 6.1.2. Offshore
- 6.2. Market Analysis, Insights and Forecast - by Operation
- 6.2.1. Liquefaction
- 6.2.2. Regasification
- 6.1. Market Analysis, Insights and Forecast - by Location of Deployment
- 7. Asia Pacific Large Scale LNG Terminals Industry Analysis, Insights and Forecast, 2019-2031
- 7.1. Market Analysis, Insights and Forecast - by Location of Deployment
- 7.1.1. Onshore
- 7.1.2. Offshore
- 7.2. Market Analysis, Insights and Forecast - by Operation
- 7.2.1. Liquefaction
- 7.2.2. Regasification
- 7.1. Market Analysis, Insights and Forecast - by Location of Deployment
- 8. Europe Large Scale LNG Terminals Industry Analysis, Insights and Forecast, 2019-2031
- 8.1. Market Analysis, Insights and Forecast - by Location of Deployment
- 8.1.1. Onshore
- 8.1.2. Offshore
- 8.2. Market Analysis, Insights and Forecast - by Operation
- 8.2.1. Liquefaction
- 8.2.2. Regasification
- 8.1. Market Analysis, Insights and Forecast - by Location of Deployment
- 9. South America Large Scale LNG Terminals Industry Analysis, Insights and Forecast, 2019-2031
- 9.1. Market Analysis, Insights and Forecast - by Location of Deployment
- 9.1.1. Onshore
- 9.1.2. Offshore
- 9.2. Market Analysis, Insights and Forecast - by Operation
- 9.2.1. Liquefaction
- 9.2.2. Regasification
- 9.1. Market Analysis, Insights and Forecast - by Location of Deployment
- 10. Middle East Large Scale LNG Terminals Industry Analysis, Insights and Forecast, 2019-2031
- 10.1. Market Analysis, Insights and Forecast - by Location of Deployment
- 10.1.1. Onshore
- 10.1.2. Offshore
- 10.2. Market Analysis, Insights and Forecast - by Operation
- 10.2.1. Liquefaction
- 10.2.2. Regasification
- 10.1. Market Analysis, Insights and Forecast - by Location of Deployment
- 11. North America Large Scale LNG Terminals Industry Analysis, Insights and Forecast, 2019-2031
- 11.1. Market Analysis, Insights and Forecast - By Country/Sub-region
- 11.1.1 United States
- 11.1.2 Canada
- 11.1.3 Mexico
- 12. Europe Large Scale LNG Terminals Industry Analysis, Insights and Forecast, 2019-2031
- 12.1. Market Analysis, Insights and Forecast - By Country/Sub-region
- 12.1.1 Germany
- 12.1.2 United Kingdom
- 12.1.3 France
- 12.1.4 Spain
- 12.1.5 Italy
- 12.1.6 Spain
- 12.1.7 Belgium
- 12.1.8 Netherland
- 12.1.9 Nordics
- 12.1.10 Rest of Europe
- 13. Asia Pacific Large Scale LNG Terminals Industry Analysis, Insights and Forecast, 2019-2031
- 13.1. Market Analysis, Insights and Forecast - By Country/Sub-region
- 13.1.1 China
- 13.1.2 Japan
- 13.1.3 India
- 13.1.4 South Korea
- 13.1.5 Southeast Asia
- 13.1.6 Australia
- 13.1.7 Indonesia
- 13.1.8 Phillipes
- 13.1.9 Singapore
- 13.1.10 Thailandc
- 13.1.11 Rest of Asia Pacific
- 14. South America Large Scale LNG Terminals Industry Analysis, Insights and Forecast, 2019-2031
- 14.1. Market Analysis, Insights and Forecast - By Country/Sub-region
- 14.1.1 Brazil
- 14.1.2 Argentina
- 14.1.3 Peru
- 14.1.4 Chile
- 14.1.5 Colombia
- 14.1.6 Ecuador
- 14.1.7 Venezuela
- 14.1.8 Rest of South America
- 15. North America Large Scale LNG Terminals Industry Analysis, Insights and Forecast, 2019-2031
- 15.1. Market Analysis, Insights and Forecast - By Country/Sub-region
- 15.1.1 United States
- 15.1.2 Canada
- 15.1.3 Mexico
- 16. MEA Large Scale LNG Terminals Industry Analysis, Insights and Forecast, 2019-2031
- 16.1. Market Analysis, Insights and Forecast - By Country/Sub-region
- 16.1.1 United Arab Emirates
- 16.1.2 Saudi Arabia
- 16.1.3 South Africa
- 16.1.4 Rest of Middle East and Africa
- 17. Competitive Analysis
- 17.1. Global Market Share Analysis 2024
- 17.2. Company Profiles
- 17.2.1 Tokyo Gas Co Ltd
- 17.2.1.1. Overview
- 17.2.1.2. Products
- 17.2.1.3. SWOT Analysis
- 17.2.1.4. Recent Developments
- 17.2.1.5. Financials (Based on Availability)
- 17.2.2 Shell PLC
- 17.2.2.1. Overview
- 17.2.2.2. Products
- 17.2.2.3. SWOT Analysis
- 17.2.2.4. Recent Developments
- 17.2.2.5. Financials (Based on Availability)
- 17.2.3 Exxon Mobil Corporation
- 17.2.3.1. Overview
- 17.2.3.2. Products
- 17.2.3.3. SWOT Analysis
- 17.2.3.4. Recent Developments
- 17.2.3.5. Financials (Based on Availability)
- 17.2.4 British Petroleum (BP) PLC
- 17.2.4.1. Overview
- 17.2.4.2. Products
- 17.2.4.3. SWOT Analysis
- 17.2.4.4. Recent Developments
- 17.2.4.5. Financials (Based on Availability)
- 17.2.5 Tokyo Electric Power Company Holding Inc
- 17.2.5.1. Overview
- 17.2.5.2. Products
- 17.2.5.3. SWOT Analysis
- 17.2.5.4. Recent Developments
- 17.2.5.5. Financials (Based on Availability)
- 17.2.6 Cheniere Energy Inc
- 17.2.6.1. Overview
- 17.2.6.2. Products
- 17.2.6.3. SWOT Analysis
- 17.2.6.4. Recent Developments
- 17.2.6.5. Financials (Based on Availability)
- 17.2.7 China National Offshore Oil Corporation (CNOOC)
- 17.2.7.1. Overview
- 17.2.7.2. Products
- 17.2.7.3. SWOT Analysis
- 17.2.7.4. Recent Developments
- 17.2.7.5. Financials (Based on Availability)
- 17.2.8 Chevron Corporation
- 17.2.8.1. Overview
- 17.2.8.2. Products
- 17.2.8.3. SWOT Analysis
- 17.2.8.4. Recent Developments
- 17.2.8.5. Financials (Based on Availability)
- 17.2.9 Petronet LNG Ltd*List Not Exhaustive
- 17.2.9.1. Overview
- 17.2.9.2. Products
- 17.2.9.3. SWOT Analysis
- 17.2.9.4. Recent Developments
- 17.2.9.5. Financials (Based on Availability)
- 17.2.10 TotalEnergies SE
- 17.2.10.1. Overview
- 17.2.10.2. Products
- 17.2.10.3. SWOT Analysis
- 17.2.10.4. Recent Developments
- 17.2.10.5. Financials (Based on Availability)
- 17.2.1 Tokyo Gas Co Ltd
List of Figures
- Figure 1: Global Large Scale LNG Terminals Industry Revenue Breakdown (Million, %) by Region 2024 & 2032
- Figure 2: North America Large Scale LNG Terminals Industry Revenue (Million), by Country 2024 & 2032
- Figure 3: North America Large Scale LNG Terminals Industry Revenue Share (%), by Country 2024 & 2032
- Figure 4: Europe Large Scale LNG Terminals Industry Revenue (Million), by Country 2024 & 2032
- Figure 5: Europe Large Scale LNG Terminals Industry Revenue Share (%), by Country 2024 & 2032
- Figure 6: Asia Pacific Large Scale LNG Terminals Industry Revenue (Million), by Country 2024 & 2032
- Figure 7: Asia Pacific Large Scale LNG Terminals Industry Revenue Share (%), by Country 2024 & 2032
- Figure 8: South America Large Scale LNG Terminals Industry Revenue (Million), by Country 2024 & 2032
- Figure 9: South America Large Scale LNG Terminals Industry Revenue Share (%), by Country 2024 & 2032
- Figure 10: North America Large Scale LNG Terminals Industry Revenue (Million), by Country 2024 & 2032
- Figure 11: North America Large Scale LNG Terminals Industry Revenue Share (%), by Country 2024 & 2032
- Figure 12: MEA Large Scale LNG Terminals Industry Revenue (Million), by Country 2024 & 2032
- Figure 13: MEA Large Scale LNG Terminals Industry Revenue Share (%), by Country 2024 & 2032
- Figure 14: North America Large Scale LNG Terminals Industry Revenue (Million), by Location of Deployment 2024 & 2032
- Figure 15: North America Large Scale LNG Terminals Industry Revenue Share (%), by Location of Deployment 2024 & 2032
- Figure 16: North America Large Scale LNG Terminals Industry Revenue (Million), by Operation 2024 & 2032
- Figure 17: North America Large Scale LNG Terminals Industry Revenue Share (%), by Operation 2024 & 2032
- Figure 18: North America Large Scale LNG Terminals Industry Revenue (Million), by Country 2024 & 2032
- Figure 19: North America Large Scale LNG Terminals Industry Revenue Share (%), by Country 2024 & 2032
- Figure 20: Asia Pacific Large Scale LNG Terminals Industry Revenue (Million), by Location of Deployment 2024 & 2032
- Figure 21: Asia Pacific Large Scale LNG Terminals Industry Revenue Share (%), by Location of Deployment 2024 & 2032
- Figure 22: Asia Pacific Large Scale LNG Terminals Industry Revenue (Million), by Operation 2024 & 2032
- Figure 23: Asia Pacific Large Scale LNG Terminals Industry Revenue Share (%), by Operation 2024 & 2032
- Figure 24: Asia Pacific Large Scale LNG Terminals Industry Revenue (Million), by Country 2024 & 2032
- Figure 25: Asia Pacific Large Scale LNG Terminals Industry Revenue Share (%), by Country 2024 & 2032
- Figure 26: Europe Large Scale LNG Terminals Industry Revenue (Million), by Location of Deployment 2024 & 2032
- Figure 27: Europe Large Scale LNG Terminals Industry Revenue Share (%), by Location of Deployment 2024 & 2032
- Figure 28: Europe Large Scale LNG Terminals Industry Revenue (Million), by Operation 2024 & 2032
- Figure 29: Europe Large Scale LNG Terminals Industry Revenue Share (%), by Operation 2024 & 2032
- Figure 30: Europe Large Scale LNG Terminals Industry Revenue (Million), by Country 2024 & 2032
- Figure 31: Europe Large Scale LNG Terminals Industry Revenue Share (%), by Country 2024 & 2032
- Figure 32: South America Large Scale LNG Terminals Industry Revenue (Million), by Location of Deployment 2024 & 2032
- Figure 33: South America Large Scale LNG Terminals Industry Revenue Share (%), by Location of Deployment 2024 & 2032
- Figure 34: South America Large Scale LNG Terminals Industry Revenue (Million), by Operation 2024 & 2032
- Figure 35: South America Large Scale LNG Terminals Industry Revenue Share (%), by Operation 2024 & 2032
- Figure 36: South America Large Scale LNG Terminals Industry Revenue (Million), by Country 2024 & 2032
- Figure 37: South America Large Scale LNG Terminals Industry Revenue Share (%), by Country 2024 & 2032
- Figure 38: Middle East Large Scale LNG Terminals Industry Revenue (Million), by Location of Deployment 2024 & 2032
- Figure 39: Middle East Large Scale LNG Terminals Industry Revenue Share (%), by Location of Deployment 2024 & 2032
- Figure 40: Middle East Large Scale LNG Terminals Industry Revenue (Million), by Operation 2024 & 2032
- Figure 41: Middle East Large Scale LNG Terminals Industry Revenue Share (%), by Operation 2024 & 2032
- Figure 42: Middle East Large Scale LNG Terminals Industry Revenue (Million), by Country 2024 & 2032
- Figure 43: Middle East Large Scale LNG Terminals Industry Revenue Share (%), by Country 2024 & 2032
List of Tables
- Table 1: Global Large Scale LNG Terminals Industry Revenue Million Forecast, by Region 2019 & 2032
- Table 2: Global Large Scale LNG Terminals Industry Revenue Million Forecast, by Location of Deployment 2019 & 2032
- Table 3: Global Large Scale LNG Terminals Industry Revenue Million Forecast, by Operation 2019 & 2032
- Table 4: Global Large Scale LNG Terminals Industry Revenue Million Forecast, by Region 2019 & 2032
- Table 5: Global Large Scale LNG Terminals Industry Revenue Million Forecast, by Country 2019 & 2032
- Table 6: United States Large Scale LNG Terminals Industry Revenue (Million) Forecast, by Application 2019 & 2032
- Table 7: Canada Large Scale LNG Terminals Industry Revenue (Million) Forecast, by Application 2019 & 2032
- Table 8: Mexico Large Scale LNG Terminals Industry Revenue (Million) Forecast, by Application 2019 & 2032
- Table 9: Global Large Scale LNG Terminals Industry Revenue Million Forecast, by Country 2019 & 2032
- Table 10: Germany Large Scale LNG Terminals Industry Revenue (Million) Forecast, by Application 2019 & 2032
- Table 11: United Kingdom Large Scale LNG Terminals Industry Revenue (Million) Forecast, by Application 2019 & 2032
- Table 12: France Large Scale LNG Terminals Industry Revenue (Million) Forecast, by Application 2019 & 2032
- Table 13: Spain Large Scale LNG Terminals Industry Revenue (Million) Forecast, by Application 2019 & 2032
- Table 14: Italy Large Scale LNG Terminals Industry Revenue (Million) Forecast, by Application 2019 & 2032
- Table 15: Spain Large Scale LNG Terminals Industry Revenue (Million) Forecast, by Application 2019 & 2032
- Table 16: Belgium Large Scale LNG Terminals Industry Revenue (Million) Forecast, by Application 2019 & 2032
- Table 17: Netherland Large Scale LNG Terminals Industry Revenue (Million) Forecast, by Application 2019 & 2032
- Table 18: Nordics Large Scale LNG Terminals Industry Revenue (Million) Forecast, by Application 2019 & 2032
- Table 19: Rest of Europe Large Scale LNG Terminals Industry Revenue (Million) Forecast, by Application 2019 & 2032
- Table 20: Global Large Scale LNG Terminals Industry Revenue Million Forecast, by Country 2019 & 2032
- Table 21: China Large Scale LNG Terminals Industry Revenue (Million) Forecast, by Application 2019 & 2032
- Table 22: Japan Large Scale LNG Terminals Industry Revenue (Million) Forecast, by Application 2019 & 2032
- Table 23: India Large Scale LNG Terminals Industry Revenue (Million) Forecast, by Application 2019 & 2032
- Table 24: South Korea Large Scale LNG Terminals Industry Revenue (Million) Forecast, by Application 2019 & 2032
- Table 25: Southeast Asia Large Scale LNG Terminals Industry Revenue (Million) Forecast, by Application 2019 & 2032
- Table 26: Australia Large Scale LNG Terminals Industry Revenue (Million) Forecast, by Application 2019 & 2032
- Table 27: Indonesia Large Scale LNG Terminals Industry Revenue (Million) Forecast, by Application 2019 & 2032
- Table 28: Phillipes Large Scale LNG Terminals Industry Revenue (Million) Forecast, by Application 2019 & 2032
- Table 29: Singapore Large Scale LNG Terminals Industry Revenue (Million) Forecast, by Application 2019 & 2032
- Table 30: Thailandc Large Scale LNG Terminals Industry Revenue (Million) Forecast, by Application 2019 & 2032
- Table 31: Rest of Asia Pacific Large Scale LNG Terminals Industry Revenue (Million) Forecast, by Application 2019 & 2032
- Table 32: Global Large Scale LNG Terminals Industry Revenue Million Forecast, by Country 2019 & 2032
- Table 33: Brazil Large Scale LNG Terminals Industry Revenue (Million) Forecast, by Application 2019 & 2032
- Table 34: Argentina Large Scale LNG Terminals Industry Revenue (Million) Forecast, by Application 2019 & 2032
- Table 35: Peru Large Scale LNG Terminals Industry Revenue (Million) Forecast, by Application 2019 & 2032
- Table 36: Chile Large Scale LNG Terminals Industry Revenue (Million) Forecast, by Application 2019 & 2032
- Table 37: Colombia Large Scale LNG Terminals Industry Revenue (Million) Forecast, by Application 2019 & 2032
- Table 38: Ecuador Large Scale LNG Terminals Industry Revenue (Million) Forecast, by Application 2019 & 2032
- Table 39: Venezuela Large Scale LNG Terminals Industry Revenue (Million) Forecast, by Application 2019 & 2032
- Table 40: Rest of South America Large Scale LNG Terminals Industry Revenue (Million) Forecast, by Application 2019 & 2032
- Table 41: Global Large Scale LNG Terminals Industry Revenue Million Forecast, by Country 2019 & 2032
- Table 42: United States Large Scale LNG Terminals Industry Revenue (Million) Forecast, by Application 2019 & 2032
- Table 43: Canada Large Scale LNG Terminals Industry Revenue (Million) Forecast, by Application 2019 & 2032
- Table 44: Mexico Large Scale LNG Terminals Industry Revenue (Million) Forecast, by Application 2019 & 2032
- Table 45: Global Large Scale LNG Terminals Industry Revenue Million Forecast, by Country 2019 & 2032
- Table 46: United Arab Emirates Large Scale LNG Terminals Industry Revenue (Million) Forecast, by Application 2019 & 2032
- Table 47: Saudi Arabia Large Scale LNG Terminals Industry Revenue (Million) Forecast, by Application 2019 & 2032
- Table 48: South Africa Large Scale LNG Terminals Industry Revenue (Million) Forecast, by Application 2019 & 2032
- Table 49: Rest of Middle East and Africa Large Scale LNG Terminals Industry Revenue (Million) Forecast, by Application 2019 & 2032
- Table 50: Global Large Scale LNG Terminals Industry Revenue Million Forecast, by Location of Deployment 2019 & 2032
- Table 51: Global Large Scale LNG Terminals Industry Revenue Million Forecast, by Operation 2019 & 2032
- Table 52: Global Large Scale LNG Terminals Industry Revenue Million Forecast, by Country 2019 & 2032
- Table 53: Global Large Scale LNG Terminals Industry Revenue Million Forecast, by Location of Deployment 2019 & 2032
- Table 54: Global Large Scale LNG Terminals Industry Revenue Million Forecast, by Operation 2019 & 2032
- Table 55: Global Large Scale LNG Terminals Industry Revenue Million Forecast, by Country 2019 & 2032
- Table 56: Global Large Scale LNG Terminals Industry Revenue Million Forecast, by Location of Deployment 2019 & 2032
- Table 57: Global Large Scale LNG Terminals Industry Revenue Million Forecast, by Operation 2019 & 2032
- Table 58: Global Large Scale LNG Terminals Industry Revenue Million Forecast, by Country 2019 & 2032
- Table 59: Global Large Scale LNG Terminals Industry Revenue Million Forecast, by Location of Deployment 2019 & 2032
- Table 60: Global Large Scale LNG Terminals Industry Revenue Million Forecast, by Operation 2019 & 2032
- Table 61: Global Large Scale LNG Terminals Industry Revenue Million Forecast, by Country 2019 & 2032
- Table 62: Global Large Scale LNG Terminals Industry Revenue Million Forecast, by Location of Deployment 2019 & 2032
- Table 63: Global Large Scale LNG Terminals Industry Revenue Million Forecast, by Operation 2019 & 2032
- Table 64: Global Large Scale LNG Terminals Industry Revenue Million Forecast, by Country 2019 & 2032
Frequently Asked Questions
1. What is the projected Compound Annual Growth Rate (CAGR) of the Large Scale LNG Terminals Industry?
The projected CAGR is approximately > 5.00%.
2. Which companies are prominent players in the Large Scale LNG Terminals Industry?
Key companies in the market include Tokyo Gas Co Ltd, Shell PLC, Exxon Mobil Corporation, British Petroleum (BP) PLC, Tokyo Electric Power Company Holding Inc, Cheniere Energy Inc, China National Offshore Oil Corporation (CNOOC), Chevron Corporation, Petronet LNG Ltd*List Not Exhaustive, TotalEnergies SE.
3. What are the main segments of the Large Scale LNG Terminals Industry?
The market segments include Location of Deployment, Operation.
4. Can you provide details about the market size?
The market size is estimated to be USD XX Million as of 2022.
5. What are some drivers contributing to market growth?
4.; Increasing Demand for Sales of Commercial Vehicles4.; Increasing Deployment of Retail Fuel Outlets Across Various Countries.
6. What are the notable trends driving market growth?
Regasification LNG Terminals to Dominate the Market.
7. Are there any restraints impacting market growth?
4.; Growing Penetration and Demand for Electric Vehicles.
8. Can you provide examples of recent developments in the market?
November 2022: Germany finished the construction of its first floating LNG terminal at the North Sea port of Wilhelmshaven, as the country scrambles to obtain additional LNG and transition away from Russian pipeline gas.
9. What pricing options are available for accessing the report?
Pricing options include single-user, multi-user, and enterprise licenses priced at USD 4750, USD 5250, and USD 8750 respectively.
10. Is the market size provided in terms of value or volume?
The market size is provided in terms of value, measured in Million.
11. Are there any specific market keywords associated with the report?
Yes, the market keyword associated with the report is "Large Scale LNG Terminals Industry," which aids in identifying and referencing the specific market segment covered.
12. How do I determine which pricing option suits my needs best?
The pricing options vary based on user requirements and access needs. Individual users may opt for single-user licenses, while businesses requiring broader access may choose multi-user or enterprise licenses for cost-effective access to the report.
13. Are there any additional resources or data provided in the Large Scale LNG Terminals Industry report?
While the report offers comprehensive insights, it's advisable to review the specific contents or supplementary materials provided to ascertain if additional resources or data are available.
14. How can I stay updated on further developments or reports in the Large Scale LNG Terminals Industry?
To stay informed about further developments, trends, and reports in the Large Scale LNG Terminals Industry, consider subscribing to industry newsletters, following relevant companies and organizations, or regularly checking reputable industry news sources and publications.
Methodology
Step 1 - Identification of Relevant Samples Size from Population Database


Step 2 - Approaches for Defining Global Market Size (Value, Volume* & Price*)

Note*: In applicable scenarios
Step 3 - Data Sources
Primary Research
- Web Analytics
- Survey Reports
- Research Institute
- Latest Research Reports
- Opinion Leaders
Secondary Research
- Annual Reports
- White Paper
- Latest Press Release
- Industry Association
- Paid Database
- Investor Presentations

Step 4 - Data Triangulation
Involves using different sources of information in order to increase the validity of a study
These sources are likely to be stakeholders in a program - participants, other researchers, program staff, other community members, and so on.
Then we put all data in single framework & apply various statistical tools to find out the dynamic on the market.
During the analysis stage, feedback from the stakeholder groups would be compared to determine areas of agreement as well as areas of divergence
