

Key Insights
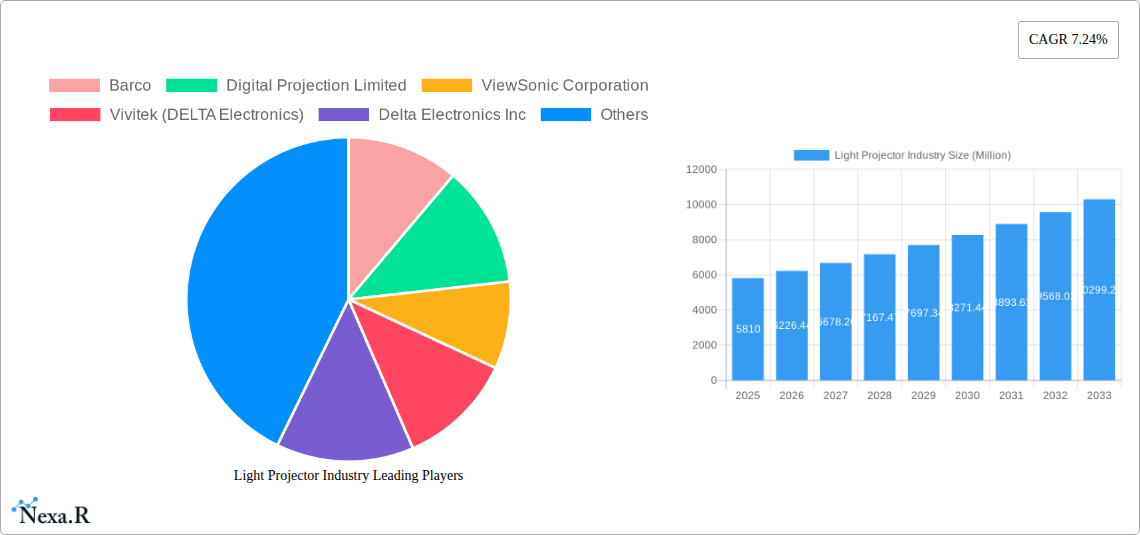
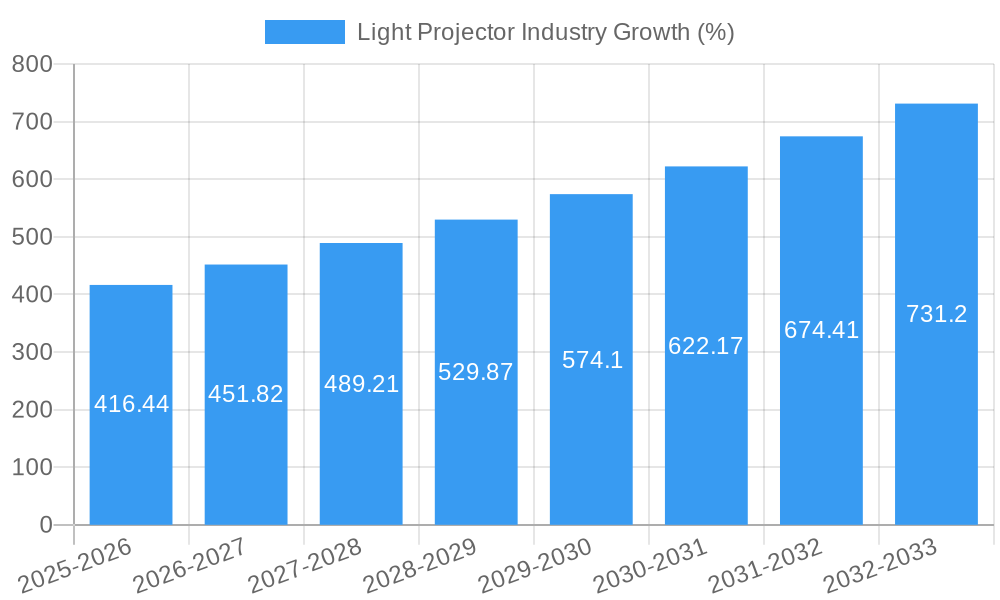
The light projector market, valued at $5.81 billion in 2025, is projected to experience robust growth, driven by a Compound Annual Growth Rate (CAGR) of 7.24% from 2025 to 2033. This expansion is fueled by several key factors. The increasing adoption of home entertainment systems, coupled with the rising demand for large-screen displays in both residential and commercial settings, significantly boosts projector sales. Technological advancements, such as improved LED and laser light sources offering brighter images, longer lifespans, and enhanced color accuracy, are further driving market growth. The shift towards portable and ultra-short-throw projectors caters to the needs of a mobile workforce and enhances user convenience. Furthermore, the growing integration of projectors in educational institutions and corporate settings for presentations and interactive learning experiences fuels market expansion. While pricing remains a barrier for certain segments, particularly in developing economies, the continuous improvement in price-to-performance ratios is steadily mitigating this restraint.
Market segmentation reveals a diverse landscape. LED projectors are gaining significant market share due to their energy efficiency and affordability, while laser projectors are attracting premium segments seeking exceptional brightness and color reproduction. The one-chip projector segment currently dominates due to its cost-effectiveness, but the three-chip segment is anticipated to experience growth driven by its superior image quality. Short-throw and ultra-short-throw projectors are gaining traction due to their space-saving design and ease of setup. The home entertainment and cinema segment accounts for a significant portion of the market, but strong growth is expected in business and educational sectors due to increased investment in interactive learning technologies and improved workplace presentation capabilities. Major players like Barco, Epson, BenQ, and Optoma are continuously innovating and expanding their product lines to capitalize on emerging market trends. Geographical analysis reveals that North America and Europe currently hold considerable market share, but the Asia-Pacific region is poised for significant growth given its expanding middle class and increasing disposable incomes.
Light Projector Industry Market Report: 2019-2033
This comprehensive report provides a detailed analysis of the global light projector market, encompassing historical data (2019-2024), current estimates (2025), and future projections (2025-2033). It delves into market dynamics, growth trends, regional dominance, product landscapes, key players, and emerging opportunities within the parent market of visual display technologies and its child market of professional and home projectors. The report is designed for industry professionals, investors, and strategic decision-makers seeking in-depth insights into this dynamic sector. The global light projector market is estimated to be valued at xx Million units in 2025.
Light Projector Industry Market Dynamics & Structure
The light projector market is characterized by a moderately concentrated landscape, with key players such as Barco, Digital Projection Limited, ViewSonic Corporation, and BenQ Corporation holding significant market share. However, the market also features several smaller, specialized players. Technological innovation, particularly in light source technology (LED, laser), chip models (one-chip, three-chip DLP), and throw distance capabilities (short-throw, ultra-short-throw), is a major driver of market growth. Regulatory frameworks concerning energy efficiency and safety standards also influence market dynamics. Competition from alternative display technologies, such as large-screen TVs and digital signage, presents a significant challenge. The market is segmented by light source, chip model, throw distance, and application. M&A activity has been moderate in recent years, with a focus on consolidation and expansion into new markets (xx M&A deals in the last 5 years, with an average deal size of xx Million units).
- Market Concentration: Moderately concentrated, with top players holding xx% of market share.
- Technological Innovation: Key drivers include advancements in laser and LED light sources, improved chip technology, and enhanced throw distance capabilities.
- Regulatory Frameworks: Energy efficiency standards and safety regulations impact product design and market access.
- Competitive Substitutes: Large-screen TVs, digital signage, and interactive whiteboards pose competition.
- End-User Demographics: Diverse, encompassing home entertainment, business, education, and large venues.
- M&A Trends: Moderate activity focused on consolidation and expansion into new segments and geographical regions.
Light Projector Industry Growth Trends & Insights
The global light projector market experienced a CAGR of xx% during the historical period (2019-2024). This growth is attributed to several factors, including increasing adoption rates in business and educational settings, rising disposable incomes in developing economies fueling home entertainment adoption, and technological advancements leading to improved image quality and functionality. However, the market also faced challenges from the pandemic in 2020-2021. The market is projected to continue growing at a CAGR of xx% during the forecast period (2025-2033), driven by increased demand for high-resolution displays, short-throw projectors, and interactive solutions. Consumer behavior shifts towards larger screen sizes and immersive viewing experiences further fuel market growth. Technological disruptions, such as the adoption of laser light sources and ultra-short-throw technologies, are reshaping the product landscape. Market penetration of laser projectors is expected to reach xx% by 2033.
Dominant Regions, Countries, or Segments in Light Projector Industry
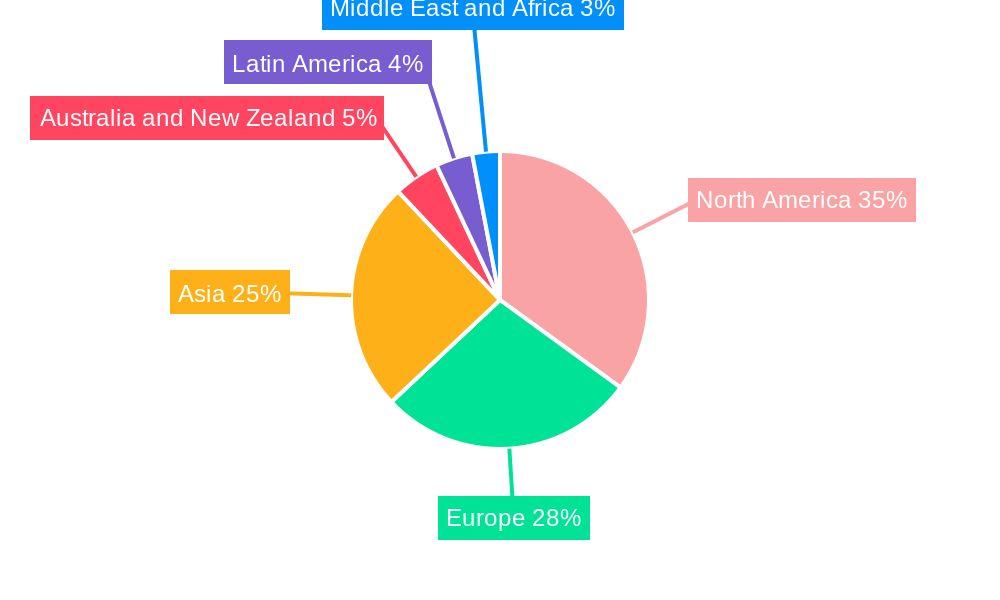
North America and Asia-Pacific are the leading regions in the light projector market, driven by robust demand from business, education, and home entertainment sectors. Within these regions, the United States, China, and Japan are key growth markets.
By Light Source: The LED segment holds the largest market share, due to its cost-effectiveness and energy efficiency. However, the laser segment is experiencing rapid growth due to its superior image quality and longer lifespan.
By Chip Model: The single-chip DLP segment dominates the market due to its lower cost, but the three-chip DLP segment is growing rapidly for higher-end applications requiring enhanced color accuracy.
By Throw Distance: The short-throw and ultra-short-throw segments are experiencing the fastest growth, driven by the increasing demand for space-saving solutions in smaller rooms and classrooms.
By Application: The business sector leads the market, followed by education and home entertainment. Government and large venues also represent significant market segments.
- Key Drivers (North America): Strong economic growth, advanced infrastructure, and high adoption rates in business and education.
- Key Drivers (Asia-Pacific): Rapid economic development, expanding middle class, and rising demand for home entertainment.
- Dominance Factors: High adoption rates, strong economic growth, favorable government policies, and technological advancements.
Light Projector Industry Product Landscape
The light projector market offers a wide range of products, varying in light source, resolution, brightness, features, and throw distance. Recent innovations include ultra-short-throw projectors that eliminate the need for significant projection distances, laser projectors offering superior image quality and longer lifespans, and interactive projectors enabling collaborative work environments. Key selling propositions include portability, high resolution, vibrant colors, and advanced features like wireless connectivity and smart capabilities.
Key Drivers, Barriers & Challenges in Light Projector Industry
Key Drivers:
- Increasing demand for high-resolution displays in businesses and educational institutions.
- Technological advancements in light sources and projection technologies.
- Growth of home entertainment and gaming markets.
- Favorable government policies promoting digital education and infrastructure development.
Key Challenges:
- Competition from alternative display technologies (xx% market share loss projected by 2033 due to competition).
- Price sensitivity in certain market segments.
- Supply chain disruptions impacting component availability and production costs (xx% increase in production costs due to supply chain issues in 2022).
Emerging Opportunities in Light Projector Industry
- Growing demand for interactive projectors in educational settings.
- Expansion into emerging markets with high growth potential.
- Development of specialized projectors for niche applications (e.g., medical imaging, architectural projection).
- Integration of smart features and connectivity options.
Growth Accelerators in the Light Projector Industry
Technological breakthroughs in laser and LED technologies, strategic partnerships between projector manufacturers and content providers, and market expansion into new geographical regions and applications will significantly accelerate long-term growth in the light projector market.
Key Players Shaping the Light Projector Industry Market
- Barco
- Digital Projection Limited
- ViewSonic Corporation
- Vivitek (DELTA Electronics)
- Delta Electronics Inc
- Acer Inc
- Texas Instruments Inc
- BenQ Corporation
- Panasonic Corporation
- Optoma Corporation (Coretronic Corp)
- NEC Corporation
- Sharp Corporation
Notable Milestones in Light Projector Industry Sector
- February 2023: Digital Projection International received the TNT (Top New Technologies) award for its HIGHlite 4K UHD Reference Satellite Modular Light Source (MLS) projection system.
- January 2023: Epson announced new projectors and visual solutions, showcasing short-throw and ultra-short-throw laser displays at ISE Barcelona.
In-Depth Light Projector Industry Market Outlook
The future of the light projector market is promising, driven by continued technological innovation, expanding applications, and rising demand in key regions. Strategic partnerships, focusing on software integration and content delivery, will further strengthen market growth. The increasing adoption of laser and LED technologies, coupled with the development of more compact and feature-rich products, will unlock new market opportunities and drive long-term growth potential.
Light Projector Industry Segmentation
-
1. Light Source
- 1.1. Lamp
- 1.2. LED
- 1.3. Laser
-
2. Chip Model
- 2.1. One Chip
- 2.2. Three Chip
-
3. Throw Distance
- 3.1. Normal Throw
- 3.2. Short Throw
- 3.3. Ultra-Short Throw
-
4. Application
- 4.1. Home Entertainment and Cinema
- 4.2. Business
- 4.3. Education and Government
- 4.4. Large Venues
- 4.5. Other Applications
Light Projector Industry Segmentation By Geography
- 1. North America
- 2. Europe
- 3. Asia
- 4. Australia and New Zealand
- 5. Latin America
- 6. Middle East and Africa
Light Projector Industry REPORT HIGHLIGHTS
| Aspects | Details |
|---|---|
| Study Period | 2019-2033 |
| Base Year | 2024 |
| Estimated Year | 2025 |
| Forecast Period | 2025-2033 |
| Historical Period | 2019-2024 |
| Growth Rate | CAGR of 7.24% from 2019-2033 |
| Segmentation |
|
Table of Contents
- 1. Introduction
- 1.1. Research Scope
- 1.2. Market Segmentation
- 1.3. Research Methodology
- 1.4. Definitions and Assumptions
- 2. Executive Summary
- 2.1. Introduction
- 3. Market Dynamics
- 3.1. Introduction
- 3.2. Market Drivers
- 3.2.1. Increment in the Demand of DLP Projector in the Entertainment Industry; Increasing Digitalization Process in the Education Sector
- 3.3. Market Restrains
- 3.3.1 High Cost and Lack of Knowledge; Stiff Competition from Other Projection Technologies such as LCD
- 3.3.2 LCOS
- 3.4. Market Trends
- 3.4.1. Increasing Demand of DLP Projector in the Home Entertainment and Cinema Industry to Drive the Market
- 4. Market Factor Analysis
- 4.1. Porters Five Forces
- 4.2. Supply/Value Chain
- 4.3. PESTEL analysis
- 4.4. Market Entropy
- 4.5. Patent/Trademark Analysis
- 5. Global Light Projector Industry Analysis, Insights and Forecast, 2019-2031
- 5.1. Market Analysis, Insights and Forecast - by Light Source
- 5.1.1. Lamp
- 5.1.2. LED
- 5.1.3. Laser
- 5.2. Market Analysis, Insights and Forecast - by Chip Model
- 5.2.1. One Chip
- 5.2.2. Three Chip
- 5.3. Market Analysis, Insights and Forecast - by Throw Distance
- 5.3.1. Normal Throw
- 5.3.2. Short Throw
- 5.3.3. Ultra-Short Throw
- 5.4. Market Analysis, Insights and Forecast - by Application
- 5.4.1. Home Entertainment and Cinema
- 5.4.2. Business
- 5.4.3. Education and Government
- 5.4.4. Large Venues
- 5.4.5. Other Applications
- 5.5. Market Analysis, Insights and Forecast - by Region
- 5.5.1. North America
- 5.5.2. Europe
- 5.5.3. Asia
- 5.5.4. Australia and New Zealand
- 5.5.5. Latin America
- 5.5.6. Middle East and Africa
- 5.1. Market Analysis, Insights and Forecast - by Light Source
- 6. North America Light Projector Industry Analysis, Insights and Forecast, 2019-2031
- 6.1. Market Analysis, Insights and Forecast - by Light Source
- 6.1.1. Lamp
- 6.1.2. LED
- 6.1.3. Laser
- 6.2. Market Analysis, Insights and Forecast - by Chip Model
- 6.2.1. One Chip
- 6.2.2. Three Chip
- 6.3. Market Analysis, Insights and Forecast - by Throw Distance
- 6.3.1. Normal Throw
- 6.3.2. Short Throw
- 6.3.3. Ultra-Short Throw
- 6.4. Market Analysis, Insights and Forecast - by Application
- 6.4.1. Home Entertainment and Cinema
- 6.4.2. Business
- 6.4.3. Education and Government
- 6.4.4. Large Venues
- 6.4.5. Other Applications
- 6.1. Market Analysis, Insights and Forecast - by Light Source
- 7. Europe Light Projector Industry Analysis, Insights and Forecast, 2019-2031
- 7.1. Market Analysis, Insights and Forecast - by Light Source
- 7.1.1. Lamp
- 7.1.2. LED
- 7.1.3. Laser
- 7.2. Market Analysis, Insights and Forecast - by Chip Model
- 7.2.1. One Chip
- 7.2.2. Three Chip
- 7.3. Market Analysis, Insights and Forecast - by Throw Distance
- 7.3.1. Normal Throw
- 7.3.2. Short Throw
- 7.3.3. Ultra-Short Throw
- 7.4. Market Analysis, Insights and Forecast - by Application
- 7.4.1. Home Entertainment and Cinema
- 7.4.2. Business
- 7.4.3. Education and Government
- 7.4.4. Large Venues
- 7.4.5. Other Applications
- 7.1. Market Analysis, Insights and Forecast - by Light Source
- 8. Asia Light Projector Industry Analysis, Insights and Forecast, 2019-2031
- 8.1. Market Analysis, Insights and Forecast - by Light Source
- 8.1.1. Lamp
- 8.1.2. LED
- 8.1.3. Laser
- 8.2. Market Analysis, Insights and Forecast - by Chip Model
- 8.2.1. One Chip
- 8.2.2. Three Chip
- 8.3. Market Analysis, Insights and Forecast - by Throw Distance
- 8.3.1. Normal Throw
- 8.3.2. Short Throw
- 8.3.3. Ultra-Short Throw
- 8.4. Market Analysis, Insights and Forecast - by Application
- 8.4.1. Home Entertainment and Cinema
- 8.4.2. Business
- 8.4.3. Education and Government
- 8.4.4. Large Venues
- 8.4.5. Other Applications
- 8.1. Market Analysis, Insights and Forecast - by Light Source
- 9. Australia and New Zealand Light Projector Industry Analysis, Insights and Forecast, 2019-2031
- 9.1. Market Analysis, Insights and Forecast - by Light Source
- 9.1.1. Lamp
- 9.1.2. LED
- 9.1.3. Laser
- 9.2. Market Analysis, Insights and Forecast - by Chip Model
- 9.2.1. One Chip
- 9.2.2. Three Chip
- 9.3. Market Analysis, Insights and Forecast - by Throw Distance
- 9.3.1. Normal Throw
- 9.3.2. Short Throw
- 9.3.3. Ultra-Short Throw
- 9.4. Market Analysis, Insights and Forecast - by Application
- 9.4.1. Home Entertainment and Cinema
- 9.4.2. Business
- 9.4.3. Education and Government
- 9.4.4. Large Venues
- 9.4.5. Other Applications
- 9.1. Market Analysis, Insights and Forecast - by Light Source
- 10. Latin America Light Projector Industry Analysis, Insights and Forecast, 2019-2031
- 10.1. Market Analysis, Insights and Forecast - by Light Source
- 10.1.1. Lamp
- 10.1.2. LED
- 10.1.3. Laser
- 10.2. Market Analysis, Insights and Forecast - by Chip Model
- 10.2.1. One Chip
- 10.2.2. Three Chip
- 10.3. Market Analysis, Insights and Forecast - by Throw Distance
- 10.3.1. Normal Throw
- 10.3.2. Short Throw
- 10.3.3. Ultra-Short Throw
- 10.4. Market Analysis, Insights and Forecast - by Application
- 10.4.1. Home Entertainment and Cinema
- 10.4.2. Business
- 10.4.3. Education and Government
- 10.4.4. Large Venues
- 10.4.5. Other Applications
- 10.1. Market Analysis, Insights and Forecast - by Light Source
- 11. Middle East and Africa Light Projector Industry Analysis, Insights and Forecast, 2019-2031
- 11.1. Market Analysis, Insights and Forecast - by Light Source
- 11.1.1. Lamp
- 11.1.2. LED
- 11.1.3. Laser
- 11.2. Market Analysis, Insights and Forecast - by Chip Model
- 11.2.1. One Chip
- 11.2.2. Three Chip
- 11.3. Market Analysis, Insights and Forecast - by Throw Distance
- 11.3.1. Normal Throw
- 11.3.2. Short Throw
- 11.3.3. Ultra-Short Throw
- 11.4. Market Analysis, Insights and Forecast - by Application
- 11.4.1. Home Entertainment and Cinema
- 11.4.2. Business
- 11.4.3. Education and Government
- 11.4.4. Large Venues
- 11.4.5. Other Applications
- 11.1. Market Analysis, Insights and Forecast - by Light Source
- 12. North America Light Projector Industry Analysis, Insights and Forecast, 2019-2031
- 12.1. Market Analysis, Insights and Forecast - By Country/Sub-region
- 12.1.1.
- 13. Europe Light Projector Industry Analysis, Insights and Forecast, 2019-2031
- 13.1. Market Analysis, Insights and Forecast - By Country/Sub-region
- 13.1.1.
- 14. Asia Light Projector Industry Analysis, Insights and Forecast, 2019-2031
- 14.1. Market Analysis, Insights and Forecast - By Country/Sub-region
- 14.1.1.
- 15. Australia and New Zealand Light Projector Industry Analysis, Insights and Forecast, 2019-2031
- 15.1. Market Analysis, Insights and Forecast - By Country/Sub-region
- 15.1.1.
- 16. Latin America Light Projector Industry Analysis, Insights and Forecast, 2019-2031
- 16.1. Market Analysis, Insights and Forecast - By Country/Sub-region
- 16.1.1.
- 17. Middle East and Africa Light Projector Industry Analysis, Insights and Forecast, 2019-2031
- 17.1. Market Analysis, Insights and Forecast - By Country/Sub-region
- 17.1.1.
- 18. Competitive Analysis
- 18.1. Global Market Share Analysis 2024
- 18.2. Company Profiles
- 18.2.1 Barco
- 18.2.1.1. Overview
- 18.2.1.2. Products
- 18.2.1.3. SWOT Analysis
- 18.2.1.4. Recent Developments
- 18.2.1.5. Financials (Based on Availability)
- 18.2.2 Digital Projection Limited
- 18.2.2.1. Overview
- 18.2.2.2. Products
- 18.2.2.3. SWOT Analysis
- 18.2.2.4. Recent Developments
- 18.2.2.5. Financials (Based on Availability)
- 18.2.3 ViewSonic Corporation
- 18.2.3.1. Overview
- 18.2.3.2. Products
- 18.2.3.3. SWOT Analysis
- 18.2.3.4. Recent Developments
- 18.2.3.5. Financials (Based on Availability)
- 18.2.4 Vivitek (DELTA Electronics)
- 18.2.4.1. Overview
- 18.2.4.2. Products
- 18.2.4.3. SWOT Analysis
- 18.2.4.4. Recent Developments
- 18.2.4.5. Financials (Based on Availability)
- 18.2.5 Delta Electronics Inc
- 18.2.5.1. Overview
- 18.2.5.2. Products
- 18.2.5.3. SWOT Analysis
- 18.2.5.4. Recent Developments
- 18.2.5.5. Financials (Based on Availability)
- 18.2.6 Acer Inc
- 18.2.6.1. Overview
- 18.2.6.2. Products
- 18.2.6.3. SWOT Analysis
- 18.2.6.4. Recent Developments
- 18.2.6.5. Financials (Based on Availability)
- 18.2.7 Texas Instruments Inc
- 18.2.7.1. Overview
- 18.2.7.2. Products
- 18.2.7.3. SWOT Analysis
- 18.2.7.4. Recent Developments
- 18.2.7.5. Financials (Based on Availability)
- 18.2.8 BenQ Corporation
- 18.2.8.1. Overview
- 18.2.8.2. Products
- 18.2.8.3. SWOT Analysis
- 18.2.8.4. Recent Developments
- 18.2.8.5. Financials (Based on Availability)
- 18.2.9 Panasonic Corporation*List Not Exhaustive
- 18.2.9.1. Overview
- 18.2.9.2. Products
- 18.2.9.3. SWOT Analysis
- 18.2.9.4. Recent Developments
- 18.2.9.5. Financials (Based on Availability)
- 18.2.10 Optoma Corporation (Coretronic Corp )
- 18.2.10.1. Overview
- 18.2.10.2. Products
- 18.2.10.3. SWOT Analysis
- 18.2.10.4. Recent Developments
- 18.2.10.5. Financials (Based on Availability)
- 18.2.11 NEC Corporation
- 18.2.11.1. Overview
- 18.2.11.2. Products
- 18.2.11.3. SWOT Analysis
- 18.2.11.4. Recent Developments
- 18.2.11.5. Financials (Based on Availability)
- 18.2.12 Sharp Corporation
- 18.2.12.1. Overview
- 18.2.12.2. Products
- 18.2.12.3. SWOT Analysis
- 18.2.12.4. Recent Developments
- 18.2.12.5. Financials (Based on Availability)
- 18.2.1 Barco
List of Figures
- Figure 1: Global Light Projector Industry Revenue Breakdown (Million, %) by Region 2024 & 2032
- Figure 2: North America Light Projector Industry Revenue (Million), by Country 2024 & 2032
- Figure 3: North America Light Projector Industry Revenue Share (%), by Country 2024 & 2032
- Figure 4: Europe Light Projector Industry Revenue (Million), by Country 2024 & 2032
- Figure 5: Europe Light Projector Industry Revenue Share (%), by Country 2024 & 2032
- Figure 6: Asia Light Projector Industry Revenue (Million), by Country 2024 & 2032
- Figure 7: Asia Light Projector Industry Revenue Share (%), by Country 2024 & 2032
- Figure 8: Australia and New Zealand Light Projector Industry Revenue (Million), by Country 2024 & 2032
- Figure 9: Australia and New Zealand Light Projector Industry Revenue Share (%), by Country 2024 & 2032
- Figure 10: Latin America Light Projector Industry Revenue (Million), by Country 2024 & 2032
- Figure 11: Latin America Light Projector Industry Revenue Share (%), by Country 2024 & 2032
- Figure 12: Middle East and Africa Light Projector Industry Revenue (Million), by Country 2024 & 2032
- Figure 13: Middle East and Africa Light Projector Industry Revenue Share (%), by Country 2024 & 2032
- Figure 14: North America Light Projector Industry Revenue (Million), by Light Source 2024 & 2032
- Figure 15: North America Light Projector Industry Revenue Share (%), by Light Source 2024 & 2032
- Figure 16: North America Light Projector Industry Revenue (Million), by Chip Model 2024 & 2032
- Figure 17: North America Light Projector Industry Revenue Share (%), by Chip Model 2024 & 2032
- Figure 18: North America Light Projector Industry Revenue (Million), by Throw Distance 2024 & 2032
- Figure 19: North America Light Projector Industry Revenue Share (%), by Throw Distance 2024 & 2032
- Figure 20: North America Light Projector Industry Revenue (Million), by Application 2024 & 2032
- Figure 21: North America Light Projector Industry Revenue Share (%), by Application 2024 & 2032
- Figure 22: North America Light Projector Industry Revenue (Million), by Country 2024 & 2032
- Figure 23: North America Light Projector Industry Revenue Share (%), by Country 2024 & 2032
- Figure 24: Europe Light Projector Industry Revenue (Million), by Light Source 2024 & 2032
- Figure 25: Europe Light Projector Industry Revenue Share (%), by Light Source 2024 & 2032
- Figure 26: Europe Light Projector Industry Revenue (Million), by Chip Model 2024 & 2032
- Figure 27: Europe Light Projector Industry Revenue Share (%), by Chip Model 2024 & 2032
- Figure 28: Europe Light Projector Industry Revenue (Million), by Throw Distance 2024 & 2032
- Figure 29: Europe Light Projector Industry Revenue Share (%), by Throw Distance 2024 & 2032
- Figure 30: Europe Light Projector Industry Revenue (Million), by Application 2024 & 2032
- Figure 31: Europe Light Projector Industry Revenue Share (%), by Application 2024 & 2032
- Figure 32: Europe Light Projector Industry Revenue (Million), by Country 2024 & 2032
- Figure 33: Europe Light Projector Industry Revenue Share (%), by Country 2024 & 2032
- Figure 34: Asia Light Projector Industry Revenue (Million), by Light Source 2024 & 2032
- Figure 35: Asia Light Projector Industry Revenue Share (%), by Light Source 2024 & 2032
- Figure 36: Asia Light Projector Industry Revenue (Million), by Chip Model 2024 & 2032
- Figure 37: Asia Light Projector Industry Revenue Share (%), by Chip Model 2024 & 2032
- Figure 38: Asia Light Projector Industry Revenue (Million), by Throw Distance 2024 & 2032
- Figure 39: Asia Light Projector Industry Revenue Share (%), by Throw Distance 2024 & 2032
- Figure 40: Asia Light Projector Industry Revenue (Million), by Application 2024 & 2032
- Figure 41: Asia Light Projector Industry Revenue Share (%), by Application 2024 & 2032
- Figure 42: Asia Light Projector Industry Revenue (Million), by Country 2024 & 2032
- Figure 43: Asia Light Projector Industry Revenue Share (%), by Country 2024 & 2032
- Figure 44: Australia and New Zealand Light Projector Industry Revenue (Million), by Light Source 2024 & 2032
- Figure 45: Australia and New Zealand Light Projector Industry Revenue Share (%), by Light Source 2024 & 2032
- Figure 46: Australia and New Zealand Light Projector Industry Revenue (Million), by Chip Model 2024 & 2032
- Figure 47: Australia and New Zealand Light Projector Industry Revenue Share (%), by Chip Model 2024 & 2032
- Figure 48: Australia and New Zealand Light Projector Industry Revenue (Million), by Throw Distance 2024 & 2032
- Figure 49: Australia and New Zealand Light Projector Industry Revenue Share (%), by Throw Distance 2024 & 2032
- Figure 50: Australia and New Zealand Light Projector Industry Revenue (Million), by Application 2024 & 2032
- Figure 51: Australia and New Zealand Light Projector Industry Revenue Share (%), by Application 2024 & 2032
- Figure 52: Australia and New Zealand Light Projector Industry Revenue (Million), by Country 2024 & 2032
- Figure 53: Australia and New Zealand Light Projector Industry Revenue Share (%), by Country 2024 & 2032
- Figure 54: Latin America Light Projector Industry Revenue (Million), by Light Source 2024 & 2032
- Figure 55: Latin America Light Projector Industry Revenue Share (%), by Light Source 2024 & 2032
- Figure 56: Latin America Light Projector Industry Revenue (Million), by Chip Model 2024 & 2032
- Figure 57: Latin America Light Projector Industry Revenue Share (%), by Chip Model 2024 & 2032
- Figure 58: Latin America Light Projector Industry Revenue (Million), by Throw Distance 2024 & 2032
- Figure 59: Latin America Light Projector Industry Revenue Share (%), by Throw Distance 2024 & 2032
- Figure 60: Latin America Light Projector Industry Revenue (Million), by Application 2024 & 2032
- Figure 61: Latin America Light Projector Industry Revenue Share (%), by Application 2024 & 2032
- Figure 62: Latin America Light Projector Industry Revenue (Million), by Country 2024 & 2032
- Figure 63: Latin America Light Projector Industry Revenue Share (%), by Country 2024 & 2032
- Figure 64: Middle East and Africa Light Projector Industry Revenue (Million), by Light Source 2024 & 2032
- Figure 65: Middle East and Africa Light Projector Industry Revenue Share (%), by Light Source 2024 & 2032
- Figure 66: Middle East and Africa Light Projector Industry Revenue (Million), by Chip Model 2024 & 2032
- Figure 67: Middle East and Africa Light Projector Industry Revenue Share (%), by Chip Model 2024 & 2032
- Figure 68: Middle East and Africa Light Projector Industry Revenue (Million), by Throw Distance 2024 & 2032
- Figure 69: Middle East and Africa Light Projector Industry Revenue Share (%), by Throw Distance 2024 & 2032
- Figure 70: Middle East and Africa Light Projector Industry Revenue (Million), by Application 2024 & 2032
- Figure 71: Middle East and Africa Light Projector Industry Revenue Share (%), by Application 2024 & 2032
- Figure 72: Middle East and Africa Light Projector Industry Revenue (Million), by Country 2024 & 2032
- Figure 73: Middle East and Africa Light Projector Industry Revenue Share (%), by Country 2024 & 2032
List of Tables
- Table 1: Global Light Projector Industry Revenue Million Forecast, by Region 2019 & 2032
- Table 2: Global Light Projector Industry Revenue Million Forecast, by Light Source 2019 & 2032
- Table 3: Global Light Projector Industry Revenue Million Forecast, by Chip Model 2019 & 2032
- Table 4: Global Light Projector Industry Revenue Million Forecast, by Throw Distance 2019 & 2032
- Table 5: Global Light Projector Industry Revenue Million Forecast, by Application 2019 & 2032
- Table 6: Global Light Projector Industry Revenue Million Forecast, by Region 2019 & 2032
- Table 7: Global Light Projector Industry Revenue Million Forecast, by Country 2019 & 2032
- Table 8: Light Projector Industry Revenue (Million) Forecast, by Application 2019 & 2032
- Table 9: Global Light Projector Industry Revenue Million Forecast, by Country 2019 & 2032
- Table 10: Light Projector Industry Revenue (Million) Forecast, by Application 2019 & 2032
- Table 11: Global Light Projector Industry Revenue Million Forecast, by Country 2019 & 2032
- Table 12: Light Projector Industry Revenue (Million) Forecast, by Application 2019 & 2032
- Table 13: Global Light Projector Industry Revenue Million Forecast, by Country 2019 & 2032
- Table 14: Light Projector Industry Revenue (Million) Forecast, by Application 2019 & 2032
- Table 15: Global Light Projector Industry Revenue Million Forecast, by Country 2019 & 2032
- Table 16: Light Projector Industry Revenue (Million) Forecast, by Application 2019 & 2032
- Table 17: Global Light Projector Industry Revenue Million Forecast, by Country 2019 & 2032
- Table 18: Light Projector Industry Revenue (Million) Forecast, by Application 2019 & 2032
- Table 19: Global Light Projector Industry Revenue Million Forecast, by Light Source 2019 & 2032
- Table 20: Global Light Projector Industry Revenue Million Forecast, by Chip Model 2019 & 2032
- Table 21: Global Light Projector Industry Revenue Million Forecast, by Throw Distance 2019 & 2032
- Table 22: Global Light Projector Industry Revenue Million Forecast, by Application 2019 & 2032
- Table 23: Global Light Projector Industry Revenue Million Forecast, by Country 2019 & 2032
- Table 24: Global Light Projector Industry Revenue Million Forecast, by Light Source 2019 & 2032
- Table 25: Global Light Projector Industry Revenue Million Forecast, by Chip Model 2019 & 2032
- Table 26: Global Light Projector Industry Revenue Million Forecast, by Throw Distance 2019 & 2032
- Table 27: Global Light Projector Industry Revenue Million Forecast, by Application 2019 & 2032
- Table 28: Global Light Projector Industry Revenue Million Forecast, by Country 2019 & 2032
- Table 29: Global Light Projector Industry Revenue Million Forecast, by Light Source 2019 & 2032
- Table 30: Global Light Projector Industry Revenue Million Forecast, by Chip Model 2019 & 2032
- Table 31: Global Light Projector Industry Revenue Million Forecast, by Throw Distance 2019 & 2032
- Table 32: Global Light Projector Industry Revenue Million Forecast, by Application 2019 & 2032
- Table 33: Global Light Projector Industry Revenue Million Forecast, by Country 2019 & 2032
- Table 34: Global Light Projector Industry Revenue Million Forecast, by Light Source 2019 & 2032
- Table 35: Global Light Projector Industry Revenue Million Forecast, by Chip Model 2019 & 2032
- Table 36: Global Light Projector Industry Revenue Million Forecast, by Throw Distance 2019 & 2032
- Table 37: Global Light Projector Industry Revenue Million Forecast, by Application 2019 & 2032
- Table 38: Global Light Projector Industry Revenue Million Forecast, by Country 2019 & 2032
- Table 39: Global Light Projector Industry Revenue Million Forecast, by Light Source 2019 & 2032
- Table 40: Global Light Projector Industry Revenue Million Forecast, by Chip Model 2019 & 2032
- Table 41: Global Light Projector Industry Revenue Million Forecast, by Throw Distance 2019 & 2032
- Table 42: Global Light Projector Industry Revenue Million Forecast, by Application 2019 & 2032
- Table 43: Global Light Projector Industry Revenue Million Forecast, by Country 2019 & 2032
- Table 44: Global Light Projector Industry Revenue Million Forecast, by Light Source 2019 & 2032
- Table 45: Global Light Projector Industry Revenue Million Forecast, by Chip Model 2019 & 2032
- Table 46: Global Light Projector Industry Revenue Million Forecast, by Throw Distance 2019 & 2032
- Table 47: Global Light Projector Industry Revenue Million Forecast, by Application 2019 & 2032
- Table 48: Global Light Projector Industry Revenue Million Forecast, by Country 2019 & 2032
Frequently Asked Questions
1. What is the projected Compound Annual Growth Rate (CAGR) of the Light Projector Industry?
The projected CAGR is approximately 7.24%.
2. Which companies are prominent players in the Light Projector Industry?
Key companies in the market include Barco, Digital Projection Limited, ViewSonic Corporation, Vivitek (DELTA Electronics), Delta Electronics Inc, Acer Inc, Texas Instruments Inc, BenQ Corporation, Panasonic Corporation*List Not Exhaustive, Optoma Corporation (Coretronic Corp ), NEC Corporation, Sharp Corporation.
3. What are the main segments of the Light Projector Industry?
The market segments include Light Source, Chip Model, Throw Distance, Application.
4. Can you provide details about the market size?
The market size is estimated to be USD 5.81 Million as of 2022.
5. What are some drivers contributing to market growth?
Increment in the Demand of DLP Projector in the Entertainment Industry; Increasing Digitalization Process in the Education Sector.
6. What are the notable trends driving market growth?
Increasing Demand of DLP Projector in the Home Entertainment and Cinema Industry to Drive the Market.
7. Are there any restraints impacting market growth?
High Cost and Lack of Knowledge; Stiff Competition from Other Projection Technologies such as LCD. LCOS.
8. Can you provide examples of recent developments in the market?
February 2023 - Digital Projection International received the coveted TNT (Top New Technologies) award from CE Pro magazine for its HIGHlite 4K UHD Reference Satellite Modular Light Source (MLS) projection system.
9. What pricing options are available for accessing the report?
Pricing options include single-user, multi-user, and enterprise licenses priced at USD 4750, USD 5250, and USD 8750 respectively.
10. Is the market size provided in terms of value or volume?
The market size is provided in terms of value, measured in Million.
11. Are there any specific market keywords associated with the report?
Yes, the market keyword associated with the report is "Light Projector Industry," which aids in identifying and referencing the specific market segment covered.
12. How do I determine which pricing option suits my needs best?
The pricing options vary based on user requirements and access needs. Individual users may opt for single-user licenses, while businesses requiring broader access may choose multi-user or enterprise licenses for cost-effective access to the report.
13. Are there any additional resources or data provided in the Light Projector Industry report?
While the report offers comprehensive insights, it's advisable to review the specific contents or supplementary materials provided to ascertain if additional resources or data are available.
14. How can I stay updated on further developments or reports in the Light Projector Industry?
To stay informed about further developments, trends, and reports in the Light Projector Industry, consider subscribing to industry newsletters, following relevant companies and organizations, or regularly checking reputable industry news sources and publications.
Methodology
Step 1 - Identification of Relevant Samples Size from Population Database


Step 2 - Approaches for Defining Global Market Size (Value, Volume* & Price*)

Note*: In applicable scenarios
Step 3 - Data Sources
Primary Research
- Web Analytics
- Survey Reports
- Research Institute
- Latest Research Reports
- Opinion Leaders
Secondary Research
- Annual Reports
- White Paper
- Latest Press Release
- Industry Association
- Paid Database
- Investor Presentations

Step 4 - Data Triangulation
Involves using different sources of information in order to increase the validity of a study
These sources are likely to be stakeholders in a program - participants, other researchers, program staff, other community members, and so on.
Then we put all data in single framework & apply various statistical tools to find out the dynamic on the market.
During the analysis stage, feedback from the stakeholder groups would be compared to determine areas of agreement as well as areas of divergence
