

Key Insights
The global live attenuated vaccines market, a key segment within the broader animal vaccine industry, is experiencing robust growth, projected to reach a substantial size in the coming years. Driven by increasing livestock populations, rising awareness of animal health, and the growing adoption of preventative healthcare measures by farmers and veterinary professionals, the market is poised for significant expansion. The preference for live attenuated vaccines, owing to their strong immunogenicity and cost-effectiveness compared to other vaccine types, further fuels this market growth. Technological advancements, such as the development of more stable and effective formulations, are also contributing factors. While challenges exist, including the potential for reversion to virulence and the need for stringent cold-chain management, the overall market outlook remains positive. The increasing prevalence of livestock diseases and the associated economic losses are driving demand for effective and affordable vaccination solutions.
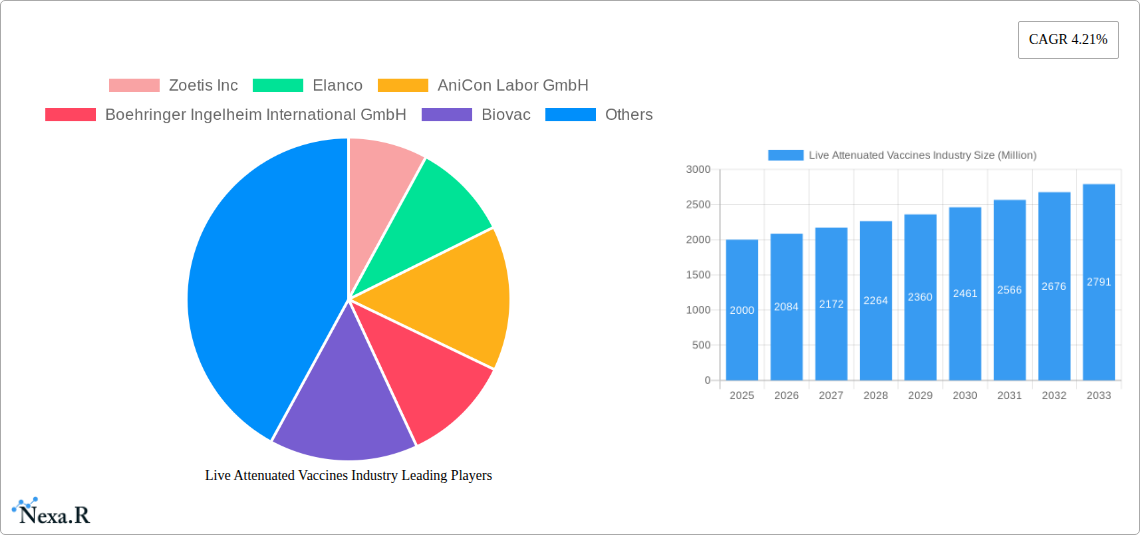
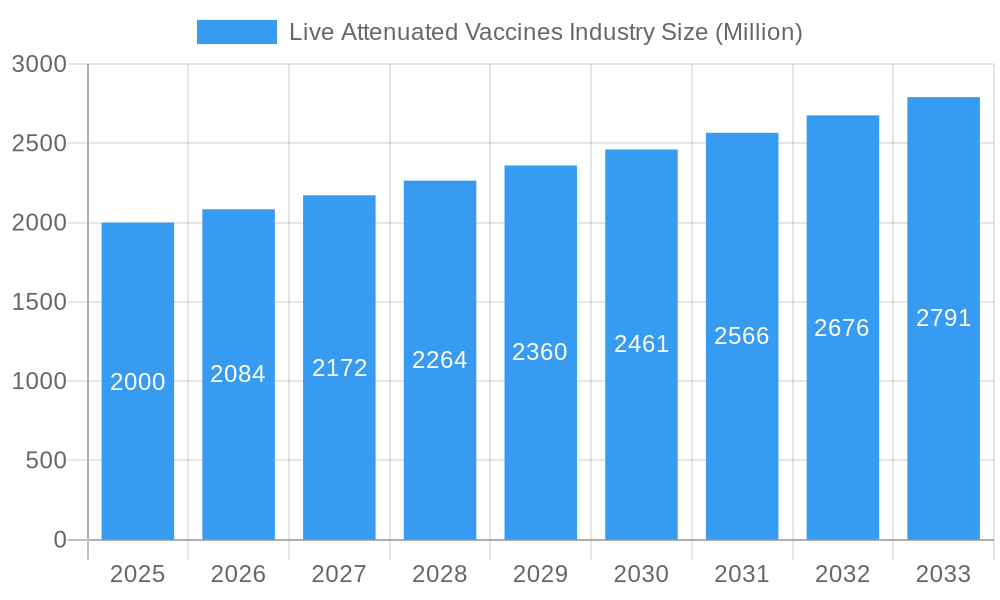
Live Attenuated Vaccines Industry Market Size (In Billion)
Within the live attenuated vaccine segment, bovine vaccines currently hold a significant market share, followed by poultry and porcine vaccines. However, the demand for other livestock vaccines is also expected to grow considerably as vaccination strategies expand across a wider range of animal species. Regionally, North America and Europe currently dominate the market due to established veterinary infrastructure and high animal healthcare spending. However, Asia-Pacific is experiencing the fastest growth rate, propelled by rapid economic development, increasing livestock production, and rising government initiatives to improve animal health. Companies like Zoetis, Elanco, and Boehringer Ingelheim are major players, constantly investing in research and development to introduce innovative and improved live attenuated vaccines. The competitive landscape is dynamic, with both large multinational corporations and smaller specialized companies vying for market share, fostering innovation and driving price competitiveness.
Live Attenuated Vaccines Industry Company Market Share
Live Attenuated Vaccines Industry Report: 2019-2033
This comprehensive report provides a detailed analysis of the Live Attenuated Vaccines market, encompassing market dynamics, growth trends, regional insights, product landscape, and key players. The study period spans from 2019 to 2033, with 2025 serving as the base and estimated year. This report is crucial for industry professionals, investors, and stakeholders seeking to understand and capitalize on opportunities within the bovine vaccine, poultry vaccine, porcine vaccine, and other livestock vaccine markets. The report segments the market by product type and technology, offering a granular view of market trends and growth drivers. The market is valued in million units.
Live Attenuated Vaccines Industry Market Dynamics & Structure
This section analyzes the competitive landscape of the Live Attenuated Vaccines market, encompassing market concentration, technological innovation, regulatory frameworks, and market dynamics. The market exhibits a moderately consolidated structure with key players like Zoetis Inc, Elanco, Boehringer Ingelheim International GmbH, and Merck & Co holding significant market share. Technological innovation, particularly in the development of more effective and safer live attenuated vaccines, is a primary driver of market growth. Stringent regulatory frameworks influence product approvals and market access. Competitive product substitutes, such as inactivated vaccines and recombinant vaccines, pose challenges. The parent market of animal health products and the child markets of specific livestock vaccines drive the overall market value.
- Market Concentration: Moderately consolidated, with top 5 players holding xx% market share in 2025 (estimated).
- Technological Innovation: Focus on improved efficacy, safety, and thermostability of live attenuated vaccines.
- Regulatory Landscape: Stringent regulations governing vaccine development, testing, and approval.
- Competitive Substitutes: Inactivated vaccines, toxoid vaccines, and recombinant vaccines present competition.
- M&A Activity: xx M&A deals recorded in the historical period (2019-2024), with a projected xx deals during the forecast period (2025-2033).
- End-User Demographics: Predominantly focused on livestock farmers and veterinary clinics, with varying demands based on livestock type and geographic location.
Live Attenuated Vaccines Industry Growth Trends & Insights
The Live Attenuated Vaccines market experienced significant growth during the historical period (2019-2024), driven by factors such as increasing livestock populations, rising awareness of animal health, and government initiatives promoting vaccination programs. The market is projected to maintain a strong growth trajectory during the forecast period (2025-2033), with a CAGR of xx%. Adoption rates are increasing, particularly in developing economies, with technology advancements leading to improved vaccine efficacy and ease of administration. Consumer behavior is shifting towards a preference for safe and effective vaccines, further propelling market growth. Market penetration is expected to reach xx% by 2033. Technological disruptions, such as the development of novel vaccine platforms and advanced delivery systems, are anticipated to accelerate market growth further. This analysis leverages data from market research firms, industry publications, and government reports to provide a comprehensive view of market size evolution and growth dynamics.
Dominant Regions, Countries, or Segments in Live Attenuated Vaccines Industry
The Live Attenuated Vaccines market is geographically diverse, with significant growth observed in both developed and developing regions. However, the North American and European markets currently lead in terms of market share, driven by high livestock populations, advanced veterinary infrastructure, and robust regulatory frameworks. Within product types, the Bovine Vaccine segment commands the largest share due to the significant economic value of cattle and the prevalence of bovine diseases. The Live Attenuated Vaccine technology segment also holds the largest market share, owing to its established efficacy and cost-effectiveness.
- Leading Region: North America (estimated xx% market share in 2025)
- Leading Country: United States (estimated xx% market share in 2025 within North America)
- Leading Product Type: Bovine Vaccines (estimated xx% market share in 2025)
- Leading Technology: Live Attenuated Vaccines (estimated xx% market share in 2025)
- Key Drivers: High livestock populations, rising awareness of animal health, government support for vaccination programs, and advancements in vaccine technology.
Live Attenuated Vaccines Industry Product Landscape
The Live Attenuated Vaccines market offers a diverse range of products, tailored to specific livestock species and diseases. Product innovations focus on enhancing vaccine efficacy, improving thermostability for use in challenging climates, and developing combination vaccines for multiple disease protection. Advanced delivery systems, such as intranasal or subcutaneous administration, are gaining popularity for ease of use and improved compliance. Unique selling propositions include improved efficacy, enhanced safety profiles, and extended shelf life. Technological advancements, such as the use of novel adjuvants and genetically modified viral vectors, are constantly shaping the product landscape.
Key Drivers, Barriers & Challenges in Live Attenuated Vaccines Industry
Key Drivers:
- Increasing livestock populations globally.
- Growing awareness of animal health and disease prevention.
- Government regulations and initiatives promoting animal vaccination.
- Technological advancements in vaccine development and delivery.
Key Challenges and Restraints:
- Stringent regulatory approvals and lengthy development processes.
- Concerns regarding vaccine safety and efficacy.
- Competition from alternative vaccine technologies.
- Supply chain disruptions and logistical challenges in vaccine distribution. These challenges have caused estimated xx% reduction in vaccine availability in specific regions during the past year.
Emerging Opportunities in Live Attenuated Vaccines Industry
- Development of next-generation vaccines with improved efficacy and safety profiles.
- Expansion into untapped markets in developing economies.
- Development of multivalent vaccines offering broad-spectrum protection.
- Increasing demand for customized vaccines targeting specific disease strains.
Growth Accelerators in the Live Attenuated Vaccines Industry
Long-term growth in the Live Attenuated Vaccines market will be fueled by continuous technological advancements leading to safer, more effective, and cost-efficient vaccines. Strategic partnerships between vaccine manufacturers and livestock producers will optimize vaccine deployment and accessibility. Furthermore, expanding into new geographical markets and developing innovative vaccine delivery systems will contribute to sustainable market growth.
Key Players Shaping the Live Attenuated Vaccines Industry Market
- Zoetis Inc
- Elanco
- AniCon Labor GmbH
- Boehringer Ingelheim International GmbH
- Biovac
- Animal Science Products Inc
- ADL BIONATUR SOLUTIONS S A
- Phibro Animal Health Corporation
- Ceva Sante Animale
- Merck & Co
Notable Milestones in Live Attenuated Vaccines Industry Sector
- August 2022: The SRTF's agriculture project 'Support for the Recovery of Livestock Production Within Northern Aleppo- Phase II' received a third batch of livestock vaccines, benefiting an estimated 57,500 families.
- August 2022: Haryana, India, conducted a mass vaccination campaign for cattle to combat lumpy skin disease, highlighting the importance of proactive vaccination strategies.
In-Depth Live Attenuated Vaccines Industry Market Outlook
The Live Attenuated Vaccines market is poised for substantial growth in the coming years. Continued investment in R&D, strategic partnerships, and expansion into emerging markets will shape the future landscape. Opportunities lie in developing innovative vaccines addressing emerging diseases and improving vaccine delivery systems. The market's future potential hinges on addressing challenges related to regulatory approvals, affordability, and equitable vaccine distribution, ensuring sustainable growth and improved animal health outcomes globally.
Live Attenuated Vaccines Industry Segmentation
-
1. Product Type
- 1.1. Bovine Vaccine
- 1.2. Poultry Vaccine
- 1.3. Porcine Vaccine
- 1.4. Other Livestock Vaccines
-
2. Technology
- 2.1. Live Attenuated Vaccine
- 2.2. Inactivated Vaccine
- 2.3. Toxoid Vaccine
- 2.4. Recombinant Vaccine
- 2.5. Other Technologies
Live Attenuated Vaccines Industry Segmentation By Geography
-
1. North America
- 1.1. United States
- 1.2. Canada
- 1.3. Mexico
-
2. Europe
- 2.1. Germany
- 2.2. United Kingdom
- 2.3. France
- 2.4. Italy
- 2.5. Spain
- 2.6. Rest of Europe
-
3. Asia Pacific
- 3.1. China
- 3.2. Japan
- 3.3. India
- 3.4. Australia
- 3.5. South Korea
- 3.6. Rest of Asia Pacific
-
4. Middle East and Africa
- 4.1. GCC
- 4.2. South Africa
- 4.3. Rest of Middle East and Africa
-
5. South America
- 5.1. Brazil
- 5.2. Argentina
- 5.3. Rest of South America
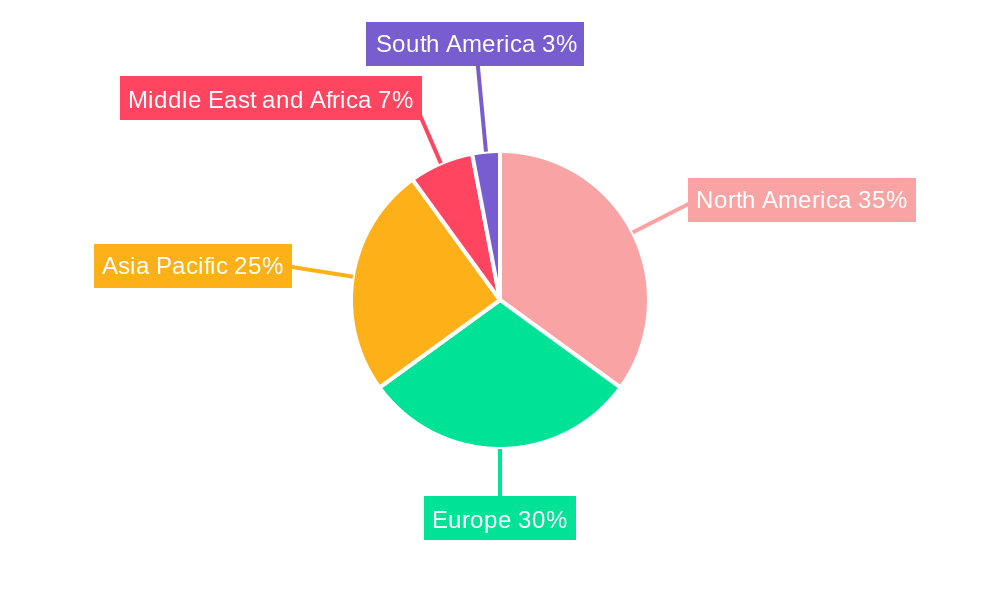
Live Attenuated Vaccines Industry Regional Market Share
Geographic Coverage of Live Attenuated Vaccines Industry
Live Attenuated Vaccines Industry REPORT HIGHLIGHTS
| Aspects | Details |
|---|---|
| Study Period | 2020-2034 |
| Base Year | 2025 |
| Estimated Year | 2026 |
| Forecast Period | 2026-2034 |
| Historical Period | 2020-2025 |
| Growth Rate | CAGR of 4.21% from 2020-2034 |
| Segmentation |
|
Table of Contents
- 1. Introduction
- 1.1. Research Scope
- 1.2. Market Segmentation
- 1.3. Research Objective
- 1.4. Definitions and Assumptions
- 2. Executive Summary
- 2.1. Market Snapshot
- 3. Market Dynamics
- 3.1. Market Drivers
- 3.2. Market Restrains
- 3.3. Market Trends
- 3.4. Market Opportunities
- 4. Market Factor Analysis
- 4.1. Porters Five Forces
- 4.1.1. Bargaining Power of Suppliers
- 4.1.2. Bargaining Power of Buyers
- 4.1.3. Threat of New Entrants
- 4.1.4. Threat of Substitutes
- 4.1.5. Competitive Rivalry
- 4.2. PESTEL analysis
- 4.3. BCG Analysis
- 4.3.1. Stars (High Growth, High Market Share)
- 4.3.2. Cash Cows (Low Growth, High Market Share)
- 4.3.3. Question Mark (High Growth, Low Market Share)
- 4.3.4. Dogs (Low Growth, Low Market Share)
- 4.4. Ansoff Matrix Analysis
- 4.5. Supply Chain Analysis
- 4.6. Regulatory Landscape
- 4.7. Current Market Potential and Opportunity Assessment (TAM–SAM–SOM Framework)
- 4.8. NRP Analyst Note
- 4.1. Porters Five Forces
- 5. Market Analysis, Insights and Forecast 2021-2033
- 5.1. Market Analysis, Insights and Forecast - by Product Type
- 5.1.1. Bovine Vaccine
- 5.1.2. Poultry Vaccine
- 5.1.3. Porcine Vaccine
- 5.1.4. Other Livestock Vaccines
- 5.2. Market Analysis, Insights and Forecast - by Technology
- 5.2.1. Live Attenuated Vaccine
- 5.2.2. Inactivated Vaccine
- 5.2.3. Toxoid Vaccine
- 5.2.4. Recombinant Vaccine
- 5.2.5. Other Technologies
- 5.3. Market Analysis, Insights and Forecast - by Region
- 5.3.1. North America
- 5.3.2. Europe
- 5.3.3. Asia Pacific
- 5.3.4. Middle East and Africa
- 5.3.5. South America
- 5.1. Market Analysis, Insights and Forecast - by Product Type
- 6. Global Live Attenuated Vaccines Industry Analysis, Insights and Forecast, 2021-2033
- 6.1. Market Analysis, Insights and Forecast - by Product Type
- 6.1.1. Bovine Vaccine
- 6.1.2. Poultry Vaccine
- 6.1.3. Porcine Vaccine
- 6.1.4. Other Livestock Vaccines
- 6.2. Market Analysis, Insights and Forecast - by Technology
- 6.2.1. Live Attenuated Vaccine
- 6.2.2. Inactivated Vaccine
- 6.2.3. Toxoid Vaccine
- 6.2.4. Recombinant Vaccine
- 6.2.5. Other Technologies
- 6.1. Market Analysis, Insights and Forecast - by Product Type
- 7. North America Live Attenuated Vaccines Industry Analysis, Insights and Forecast, 2020-2032
- 7.1. Market Analysis, Insights and Forecast - by Product Type
- 7.1.1. Bovine Vaccine
- 7.1.2. Poultry Vaccine
- 7.1.3. Porcine Vaccine
- 7.1.4. Other Livestock Vaccines
- 7.2. Market Analysis, Insights and Forecast - by Technology
- 7.2.1. Live Attenuated Vaccine
- 7.2.2. Inactivated Vaccine
- 7.2.3. Toxoid Vaccine
- 7.2.4. Recombinant Vaccine
- 7.2.5. Other Technologies
- 7.1. Market Analysis, Insights and Forecast - by Product Type
- 8. Europe Live Attenuated Vaccines Industry Analysis, Insights and Forecast, 2020-2032
- 8.1. Market Analysis, Insights and Forecast - by Product Type
- 8.1.1. Bovine Vaccine
- 8.1.2. Poultry Vaccine
- 8.1.3. Porcine Vaccine
- 8.1.4. Other Livestock Vaccines
- 8.2. Market Analysis, Insights and Forecast - by Technology
- 8.2.1. Live Attenuated Vaccine
- 8.2.2. Inactivated Vaccine
- 8.2.3. Toxoid Vaccine
- 8.2.4. Recombinant Vaccine
- 8.2.5. Other Technologies
- 8.1. Market Analysis, Insights and Forecast - by Product Type
- 9. Asia Pacific Live Attenuated Vaccines Industry Analysis, Insights and Forecast, 2020-2032
- 9.1. Market Analysis, Insights and Forecast - by Product Type
- 9.1.1. Bovine Vaccine
- 9.1.2. Poultry Vaccine
- 9.1.3. Porcine Vaccine
- 9.1.4. Other Livestock Vaccines
- 9.2. Market Analysis, Insights and Forecast - by Technology
- 9.2.1. Live Attenuated Vaccine
- 9.2.2. Inactivated Vaccine
- 9.2.3. Toxoid Vaccine
- 9.2.4. Recombinant Vaccine
- 9.2.5. Other Technologies
- 9.1. Market Analysis, Insights and Forecast - by Product Type
- 10. Middle East and Africa Live Attenuated Vaccines Industry Analysis, Insights and Forecast, 2020-2032
- 10.1. Market Analysis, Insights and Forecast - by Product Type
- 10.1.1. Bovine Vaccine
- 10.1.2. Poultry Vaccine
- 10.1.3. Porcine Vaccine
- 10.1.4. Other Livestock Vaccines
- 10.2. Market Analysis, Insights and Forecast - by Technology
- 10.2.1. Live Attenuated Vaccine
- 10.2.2. Inactivated Vaccine
- 10.2.3. Toxoid Vaccine
- 10.2.4. Recombinant Vaccine
- 10.2.5. Other Technologies
- 10.1. Market Analysis, Insights and Forecast - by Product Type
- 11. South America Live Attenuated Vaccines Industry Analysis, Insights and Forecast, 2020-2032
- 11.1. Market Analysis, Insights and Forecast - by Product Type
- 11.1.1. Bovine Vaccine
- 11.1.2. Poultry Vaccine
- 11.1.3. Porcine Vaccine
- 11.1.4. Other Livestock Vaccines
- 11.2. Market Analysis, Insights and Forecast - by Technology
- 11.2.1. Live Attenuated Vaccine
- 11.2.2. Inactivated Vaccine
- 11.2.3. Toxoid Vaccine
- 11.2.4. Recombinant Vaccine
- 11.2.5. Other Technologies
- 11.1. Market Analysis, Insights and Forecast - by Product Type
- 12. Competitive Analysis
- 12.1. Company Profiles
- 12.1.1 Zoetis Inc
- 12.1.1.1. Company Overview
- 12.1.1.2. Products
- 12.1.1.3. Company Financials
- 12.1.1.4. SWOT Analysis
- 12.1.2 Elanco
- 12.1.2.1. Company Overview
- 12.1.2.2. Products
- 12.1.2.3. Company Financials
- 12.1.2.4. SWOT Analysis
- 12.1.3 AniCon Labor GmbH
- 12.1.3.1. Company Overview
- 12.1.3.2. Products
- 12.1.3.3. Company Financials
- 12.1.3.4. SWOT Analysis
- 12.1.4 Boehringer Ingelheim International GmbH
- 12.1.4.1. Company Overview
- 12.1.4.2. Products
- 12.1.4.3. Company Financials
- 12.1.4.4. SWOT Analysis
- 12.1.5 Biovac
- 12.1.5.1. Company Overview
- 12.1.5.2. Products
- 12.1.5.3. Company Financials
- 12.1.5.4. SWOT Analysis
- 12.1.6 Animal Science Products Inc
- 12.1.6.1. Company Overview
- 12.1.6.2. Products
- 12.1.6.3. Company Financials
- 12.1.6.4. SWOT Analysis
- 12.1.7 ADL BIONATUR SOLUTIONS S A
- 12.1.7.1. Company Overview
- 12.1.7.2. Products
- 12.1.7.3. Company Financials
- 12.1.7.4. SWOT Analysis
- 12.1.8 Phibro Animal Health Corporation
- 12.1.8.1. Company Overview
- 12.1.8.2. Products
- 12.1.8.3. Company Financials
- 12.1.8.4. SWOT Analysis
- 12.1.9 Ceva Sante Animale
- 12.1.9.1. Company Overview
- 12.1.9.2. Products
- 12.1.9.3. Company Financials
- 12.1.9.4. SWOT Analysis
- 12.1.10 Merck & Co
- 12.1.10.1. Company Overview
- 12.1.10.2. Products
- 12.1.10.3. Company Financials
- 12.1.10.4. SWOT Analysis
- 12.1.1 Zoetis Inc
- 12.2. Market Entropy
- 12.2.1 Company's Key Areas Served
- 12.2.2 Recent Developments
- 12.3. Company Market Share Analysis 2025
- 12.3.1 Top 5 Companies Market Share Analysis
- 12.3.2 Top 3 Companies Market Share Analysis
- 12.4. List of Potential Customers
- 13. Research Methodology
List of Figures
- Figure 1: Global Live Attenuated Vaccines Industry Revenue Breakdown (Million, %) by Region 2025 & 2033
- Figure 2: Global Live Attenuated Vaccines Industry Volume Breakdown (K Unit, %) by Region 2025 & 2033
- Figure 3: North America Live Attenuated Vaccines Industry Revenue (Million), by Product Type 2025 & 2033
- Figure 4: North America Live Attenuated Vaccines Industry Volume (K Unit), by Product Type 2025 & 2033
- Figure 5: North America Live Attenuated Vaccines Industry Revenue Share (%), by Product Type 2025 & 2033
- Figure 6: North America Live Attenuated Vaccines Industry Volume Share (%), by Product Type 2025 & 2033
- Figure 7: North America Live Attenuated Vaccines Industry Revenue (Million), by Technology 2025 & 2033
- Figure 8: North America Live Attenuated Vaccines Industry Volume (K Unit), by Technology 2025 & 2033
- Figure 9: North America Live Attenuated Vaccines Industry Revenue Share (%), by Technology 2025 & 2033
- Figure 10: North America Live Attenuated Vaccines Industry Volume Share (%), by Technology 2025 & 2033
- Figure 11: North America Live Attenuated Vaccines Industry Revenue (Million), by Country 2025 & 2033
- Figure 12: North America Live Attenuated Vaccines Industry Volume (K Unit), by Country 2025 & 2033
- Figure 13: North America Live Attenuated Vaccines Industry Revenue Share (%), by Country 2025 & 2033
- Figure 14: North America Live Attenuated Vaccines Industry Volume Share (%), by Country 2025 & 2033
- Figure 15: Europe Live Attenuated Vaccines Industry Revenue (Million), by Product Type 2025 & 2033
- Figure 16: Europe Live Attenuated Vaccines Industry Volume (K Unit), by Product Type 2025 & 2033
- Figure 17: Europe Live Attenuated Vaccines Industry Revenue Share (%), by Product Type 2025 & 2033
- Figure 18: Europe Live Attenuated Vaccines Industry Volume Share (%), by Product Type 2025 & 2033
- Figure 19: Europe Live Attenuated Vaccines Industry Revenue (Million), by Technology 2025 & 2033
- Figure 20: Europe Live Attenuated Vaccines Industry Volume (K Unit), by Technology 2025 & 2033
- Figure 21: Europe Live Attenuated Vaccines Industry Revenue Share (%), by Technology 2025 & 2033
- Figure 22: Europe Live Attenuated Vaccines Industry Volume Share (%), by Technology 2025 & 2033
- Figure 23: Europe Live Attenuated Vaccines Industry Revenue (Million), by Country 2025 & 2033
- Figure 24: Europe Live Attenuated Vaccines Industry Volume (K Unit), by Country 2025 & 2033
- Figure 25: Europe Live Attenuated Vaccines Industry Revenue Share (%), by Country 2025 & 2033
- Figure 26: Europe Live Attenuated Vaccines Industry Volume Share (%), by Country 2025 & 2033
- Figure 27: Asia Pacific Live Attenuated Vaccines Industry Revenue (Million), by Product Type 2025 & 2033
- Figure 28: Asia Pacific Live Attenuated Vaccines Industry Volume (K Unit), by Product Type 2025 & 2033
- Figure 29: Asia Pacific Live Attenuated Vaccines Industry Revenue Share (%), by Product Type 2025 & 2033
- Figure 30: Asia Pacific Live Attenuated Vaccines Industry Volume Share (%), by Product Type 2025 & 2033
- Figure 31: Asia Pacific Live Attenuated Vaccines Industry Revenue (Million), by Technology 2025 & 2033
- Figure 32: Asia Pacific Live Attenuated Vaccines Industry Volume (K Unit), by Technology 2025 & 2033
- Figure 33: Asia Pacific Live Attenuated Vaccines Industry Revenue Share (%), by Technology 2025 & 2033
- Figure 34: Asia Pacific Live Attenuated Vaccines Industry Volume Share (%), by Technology 2025 & 2033
- Figure 35: Asia Pacific Live Attenuated Vaccines Industry Revenue (Million), by Country 2025 & 2033
- Figure 36: Asia Pacific Live Attenuated Vaccines Industry Volume (K Unit), by Country 2025 & 2033
- Figure 37: Asia Pacific Live Attenuated Vaccines Industry Revenue Share (%), by Country 2025 & 2033
- Figure 38: Asia Pacific Live Attenuated Vaccines Industry Volume Share (%), by Country 2025 & 2033
- Figure 39: Middle East and Africa Live Attenuated Vaccines Industry Revenue (Million), by Product Type 2025 & 2033
- Figure 40: Middle East and Africa Live Attenuated Vaccines Industry Volume (K Unit), by Product Type 2025 & 2033
- Figure 41: Middle East and Africa Live Attenuated Vaccines Industry Revenue Share (%), by Product Type 2025 & 2033
- Figure 42: Middle East and Africa Live Attenuated Vaccines Industry Volume Share (%), by Product Type 2025 & 2033
- Figure 43: Middle East and Africa Live Attenuated Vaccines Industry Revenue (Million), by Technology 2025 & 2033
- Figure 44: Middle East and Africa Live Attenuated Vaccines Industry Volume (K Unit), by Technology 2025 & 2033
- Figure 45: Middle East and Africa Live Attenuated Vaccines Industry Revenue Share (%), by Technology 2025 & 2033
- Figure 46: Middle East and Africa Live Attenuated Vaccines Industry Volume Share (%), by Technology 2025 & 2033
- Figure 47: Middle East and Africa Live Attenuated Vaccines Industry Revenue (Million), by Country 2025 & 2033
- Figure 48: Middle East and Africa Live Attenuated Vaccines Industry Volume (K Unit), by Country 2025 & 2033
- Figure 49: Middle East and Africa Live Attenuated Vaccines Industry Revenue Share (%), by Country 2025 & 2033
- Figure 50: Middle East and Africa Live Attenuated Vaccines Industry Volume Share (%), by Country 2025 & 2033
- Figure 51: South America Live Attenuated Vaccines Industry Revenue (Million), by Product Type 2025 & 2033
- Figure 52: South America Live Attenuated Vaccines Industry Volume (K Unit), by Product Type 2025 & 2033
- Figure 53: South America Live Attenuated Vaccines Industry Revenue Share (%), by Product Type 2025 & 2033
- Figure 54: South America Live Attenuated Vaccines Industry Volume Share (%), by Product Type 2025 & 2033
- Figure 55: South America Live Attenuated Vaccines Industry Revenue (Million), by Technology 2025 & 2033
- Figure 56: South America Live Attenuated Vaccines Industry Volume (K Unit), by Technology 2025 & 2033
- Figure 57: South America Live Attenuated Vaccines Industry Revenue Share (%), by Technology 2025 & 2033
- Figure 58: South America Live Attenuated Vaccines Industry Volume Share (%), by Technology 2025 & 2033
- Figure 59: South America Live Attenuated Vaccines Industry Revenue (Million), by Country 2025 & 2033
- Figure 60: South America Live Attenuated Vaccines Industry Volume (K Unit), by Country 2025 & 2033
- Figure 61: South America Live Attenuated Vaccines Industry Revenue Share (%), by Country 2025 & 2033
- Figure 62: South America Live Attenuated Vaccines Industry Volume Share (%), by Country 2025 & 2033
List of Tables
- Table 1: Global Live Attenuated Vaccines Industry Revenue Million Forecast, by Product Type 2020 & 2033
- Table 2: Global Live Attenuated Vaccines Industry Volume K Unit Forecast, by Product Type 2020 & 2033
- Table 3: Global Live Attenuated Vaccines Industry Revenue Million Forecast, by Technology 2020 & 2033
- Table 4: Global Live Attenuated Vaccines Industry Volume K Unit Forecast, by Technology 2020 & 2033
- Table 5: Global Live Attenuated Vaccines Industry Revenue Million Forecast, by Region 2020 & 2033
- Table 6: Global Live Attenuated Vaccines Industry Volume K Unit Forecast, by Region 2020 & 2033
- Table 7: Global Live Attenuated Vaccines Industry Revenue Million Forecast, by Product Type 2020 & 2033
- Table 8: Global Live Attenuated Vaccines Industry Volume K Unit Forecast, by Product Type 2020 & 2033
- Table 9: Global Live Attenuated Vaccines Industry Revenue Million Forecast, by Technology 2020 & 2033
- Table 10: Global Live Attenuated Vaccines Industry Volume K Unit Forecast, by Technology 2020 & 2033
- Table 11: Global Live Attenuated Vaccines Industry Revenue Million Forecast, by Country 2020 & 2033
- Table 12: Global Live Attenuated Vaccines Industry Volume K Unit Forecast, by Country 2020 & 2033
- Table 13: United States Live Attenuated Vaccines Industry Revenue (Million) Forecast, by Application 2020 & 2033
- Table 14: United States Live Attenuated Vaccines Industry Volume (K Unit) Forecast, by Application 2020 & 2033
- Table 15: Canada Live Attenuated Vaccines Industry Revenue (Million) Forecast, by Application 2020 & 2033
- Table 16: Canada Live Attenuated Vaccines Industry Volume (K Unit) Forecast, by Application 2020 & 2033
- Table 17: Mexico Live Attenuated Vaccines Industry Revenue (Million) Forecast, by Application 2020 & 2033
- Table 18: Mexico Live Attenuated Vaccines Industry Volume (K Unit) Forecast, by Application 2020 & 2033
- Table 19: Global Live Attenuated Vaccines Industry Revenue Million Forecast, by Product Type 2020 & 2033
- Table 20: Global Live Attenuated Vaccines Industry Volume K Unit Forecast, by Product Type 2020 & 2033
- Table 21: Global Live Attenuated Vaccines Industry Revenue Million Forecast, by Technology 2020 & 2033
- Table 22: Global Live Attenuated Vaccines Industry Volume K Unit Forecast, by Technology 2020 & 2033
- Table 23: Global Live Attenuated Vaccines Industry Revenue Million Forecast, by Country 2020 & 2033
- Table 24: Global Live Attenuated Vaccines Industry Volume K Unit Forecast, by Country 2020 & 2033
- Table 25: Germany Live Attenuated Vaccines Industry Revenue (Million) Forecast, by Application 2020 & 2033
- Table 26: Germany Live Attenuated Vaccines Industry Volume (K Unit) Forecast, by Application 2020 & 2033
- Table 27: United Kingdom Live Attenuated Vaccines Industry Revenue (Million) Forecast, by Application 2020 & 2033
- Table 28: United Kingdom Live Attenuated Vaccines Industry Volume (K Unit) Forecast, by Application 2020 & 2033
- Table 29: France Live Attenuated Vaccines Industry Revenue (Million) Forecast, by Application 2020 & 2033
- Table 30: France Live Attenuated Vaccines Industry Volume (K Unit) Forecast, by Application 2020 & 2033
- Table 31: Italy Live Attenuated Vaccines Industry Revenue (Million) Forecast, by Application 2020 & 2033
- Table 32: Italy Live Attenuated Vaccines Industry Volume (K Unit) Forecast, by Application 2020 & 2033
- Table 33: Spain Live Attenuated Vaccines Industry Revenue (Million) Forecast, by Application 2020 & 2033
- Table 34: Spain Live Attenuated Vaccines Industry Volume (K Unit) Forecast, by Application 2020 & 2033
- Table 35: Rest of Europe Live Attenuated Vaccines Industry Revenue (Million) Forecast, by Application 2020 & 2033
- Table 36: Rest of Europe Live Attenuated Vaccines Industry Volume (K Unit) Forecast, by Application 2020 & 2033
- Table 37: Global Live Attenuated Vaccines Industry Revenue Million Forecast, by Product Type 2020 & 2033
- Table 38: Global Live Attenuated Vaccines Industry Volume K Unit Forecast, by Product Type 2020 & 2033
- Table 39: Global Live Attenuated Vaccines Industry Revenue Million Forecast, by Technology 2020 & 2033
- Table 40: Global Live Attenuated Vaccines Industry Volume K Unit Forecast, by Technology 2020 & 2033
- Table 41: Global Live Attenuated Vaccines Industry Revenue Million Forecast, by Country 2020 & 2033
- Table 42: Global Live Attenuated Vaccines Industry Volume K Unit Forecast, by Country 2020 & 2033
- Table 43: China Live Attenuated Vaccines Industry Revenue (Million) Forecast, by Application 2020 & 2033
- Table 44: China Live Attenuated Vaccines Industry Volume (K Unit) Forecast, by Application 2020 & 2033
- Table 45: Japan Live Attenuated Vaccines Industry Revenue (Million) Forecast, by Application 2020 & 2033
- Table 46: Japan Live Attenuated Vaccines Industry Volume (K Unit) Forecast, by Application 2020 & 2033
- Table 47: India Live Attenuated Vaccines Industry Revenue (Million) Forecast, by Application 2020 & 2033
- Table 48: India Live Attenuated Vaccines Industry Volume (K Unit) Forecast, by Application 2020 & 2033
- Table 49: Australia Live Attenuated Vaccines Industry Revenue (Million) Forecast, by Application 2020 & 2033
- Table 50: Australia Live Attenuated Vaccines Industry Volume (K Unit) Forecast, by Application 2020 & 2033
- Table 51: South Korea Live Attenuated Vaccines Industry Revenue (Million) Forecast, by Application 2020 & 2033
- Table 52: South Korea Live Attenuated Vaccines Industry Volume (K Unit) Forecast, by Application 2020 & 2033
- Table 53: Rest of Asia Pacific Live Attenuated Vaccines Industry Revenue (Million) Forecast, by Application 2020 & 2033
- Table 54: Rest of Asia Pacific Live Attenuated Vaccines Industry Volume (K Unit) Forecast, by Application 2020 & 2033
- Table 55: Global Live Attenuated Vaccines Industry Revenue Million Forecast, by Product Type 2020 & 2033
- Table 56: Global Live Attenuated Vaccines Industry Volume K Unit Forecast, by Product Type 2020 & 2033
- Table 57: Global Live Attenuated Vaccines Industry Revenue Million Forecast, by Technology 2020 & 2033
- Table 58: Global Live Attenuated Vaccines Industry Volume K Unit Forecast, by Technology 2020 & 2033
- Table 59: Global Live Attenuated Vaccines Industry Revenue Million Forecast, by Country 2020 & 2033
- Table 60: Global Live Attenuated Vaccines Industry Volume K Unit Forecast, by Country 2020 & 2033
- Table 61: GCC Live Attenuated Vaccines Industry Revenue (Million) Forecast, by Application 2020 & 2033
- Table 62: GCC Live Attenuated Vaccines Industry Volume (K Unit) Forecast, by Application 2020 & 2033
- Table 63: South Africa Live Attenuated Vaccines Industry Revenue (Million) Forecast, by Application 2020 & 2033
- Table 64: South Africa Live Attenuated Vaccines Industry Volume (K Unit) Forecast, by Application 2020 & 2033
- Table 65: Rest of Middle East and Africa Live Attenuated Vaccines Industry Revenue (Million) Forecast, by Application 2020 & 2033
- Table 66: Rest of Middle East and Africa Live Attenuated Vaccines Industry Volume (K Unit) Forecast, by Application 2020 & 2033
- Table 67: Global Live Attenuated Vaccines Industry Revenue Million Forecast, by Product Type 2020 & 2033
- Table 68: Global Live Attenuated Vaccines Industry Volume K Unit Forecast, by Product Type 2020 & 2033
- Table 69: Global Live Attenuated Vaccines Industry Revenue Million Forecast, by Technology 2020 & 2033
- Table 70: Global Live Attenuated Vaccines Industry Volume K Unit Forecast, by Technology 2020 & 2033
- Table 71: Global Live Attenuated Vaccines Industry Revenue Million Forecast, by Country 2020 & 2033
- Table 72: Global Live Attenuated Vaccines Industry Volume K Unit Forecast, by Country 2020 & 2033
- Table 73: Brazil Live Attenuated Vaccines Industry Revenue (Million) Forecast, by Application 2020 & 2033
- Table 74: Brazil Live Attenuated Vaccines Industry Volume (K Unit) Forecast, by Application 2020 & 2033
- Table 75: Argentina Live Attenuated Vaccines Industry Revenue (Million) Forecast, by Application 2020 & 2033
- Table 76: Argentina Live Attenuated Vaccines Industry Volume (K Unit) Forecast, by Application 2020 & 2033
- Table 77: Rest of South America Live Attenuated Vaccines Industry Revenue (Million) Forecast, by Application 2020 & 2033
- Table 78: Rest of South America Live Attenuated Vaccines Industry Volume (K Unit) Forecast, by Application 2020 & 2033
Frequently Asked Questions
1. What is the projected Compound Annual Growth Rate (CAGR) of the Live Attenuated Vaccines Industry?
The projected CAGR is approximately 4.21%.
2. Which companies are prominent players in the Live Attenuated Vaccines Industry?
Key companies in the market include Zoetis Inc, Elanco, AniCon Labor GmbH, Boehringer Ingelheim International GmbH, Biovac, Animal Science Products Inc, ADL BIONATUR SOLUTIONS S A, Phibro Animal Health Corporation, Ceva Sante Animale, Merck & Co.
3. What are the main segments of the Live Attenuated Vaccines Industry?
The market segments include Product Type, Technology.
4. Can you provide details about the market size?
The market size is estimated to be USD 5.88 Million as of 2022.
5. What are some drivers contributing to market growth?
Increasing Incidences of Zoonotic Diseases; Initiatives Taken by Various Government Agencies. Animal Associations. and Leading Players; Widened Focus on Food Safety.
6. What are the notable trends driving market growth?
Poultry Vaccine is Expected to Cover a Large Share of the Livestock Vaccines Market.
7. Are there any restraints impacting market growth?
Lack of Veterinarians and Shortage of Skilled Farm Workers; High Storage Costs for Vaccines.
8. Can you provide examples of recent developments in the market?
In August 2022, The SRTF's agriculture project 'Support for the Recovery of Livestock Production Within Northern Aleppo- Phase II' announced receiving the third batch of livestock vaccines. Indirectly, the project will benefit 57,500 estimated family members of livestock breeders in the project area populated by an estimated 250,000 people.
9. What pricing options are available for accessing the report?
Pricing options include single-user, multi-user, and enterprise licenses priced at USD 4750, USD 5250, and USD 8750 respectively.
10. Is the market size provided in terms of value or volume?
The market size is provided in terms of value, measured in Million and volume, measured in K Unit.
11. Are there any specific market keywords associated with the report?
Yes, the market keyword associated with the report is "Live Attenuated Vaccines Industry," which aids in identifying and referencing the specific market segment covered.
12. How do I determine which pricing option suits my needs best?
The pricing options vary based on user requirements and access needs. Individual users may opt for single-user licenses, while businesses requiring broader access may choose multi-user or enterprise licenses for cost-effective access to the report.
13. Are there any additional resources or data provided in the Live Attenuated Vaccines Industry report?
While the report offers comprehensive insights, it's advisable to review the specific contents or supplementary materials provided to ascertain if additional resources or data are available.
14. How can I stay updated on further developments or reports in the Live Attenuated Vaccines Industry?
To stay informed about further developments, trends, and reports in the Live Attenuated Vaccines Industry, consider subscribing to industry newsletters, following relevant companies and organizations, or regularly checking reputable industry news sources and publications.
Methodology
Step 1 - Identification of Relevant Samples Size from Population Database


Step 2 - Approaches for Defining Global Market Size (Value, Volume* & Price*)

Note*: In applicable scenarios
Step 3 - Data Sources
Primary Research
- Web Analytics
- Survey Reports
- Research Institute
- Latest Research Reports
- Opinion Leaders
Secondary Research
- Annual Reports
- White Paper
- Latest Press Release
- Industry Association
- Paid Database
- Investor Presentations

Step 4 - Data Triangulation
Involves using different sources of information in order to increase the validity of a study
These sources are likely to be stakeholders in a program - participants, other researchers, program staff, other community members, and so on.
Then we put all data in single framework & apply various statistical tools to find out the dynamic on the market.
During the analysis stage, feedback from the stakeholder groups would be compared to determine areas of agreement as well as areas of divergence