

Key Insights
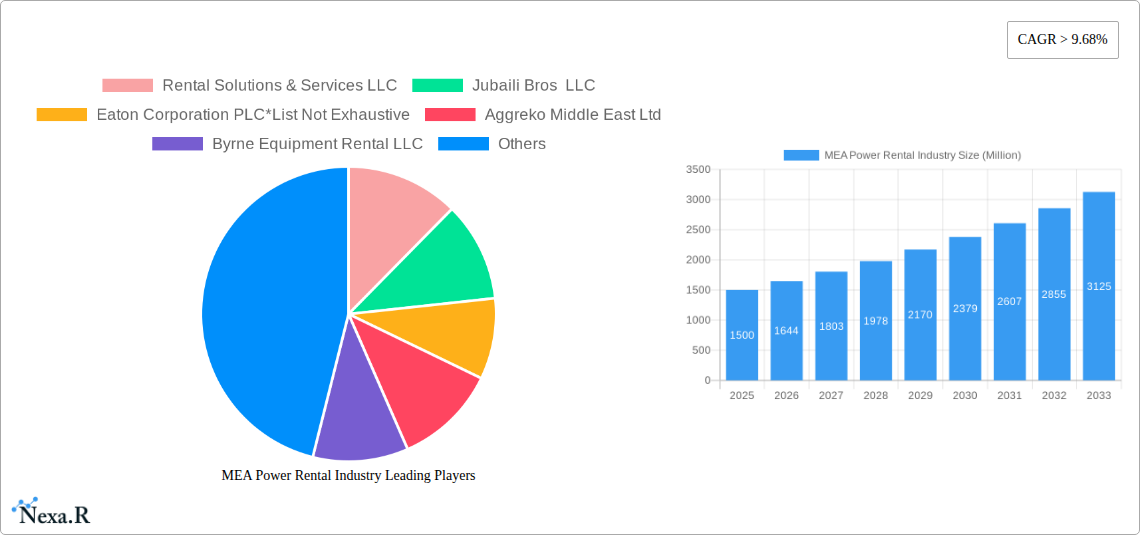
The MEA power rental market is experiencing robust growth, driven by increasing demand for reliable power solutions across diverse sectors. The region's burgeoning infrastructure development, particularly in construction and oil & gas, fuels this expansion. A significant driver is the intermittent nature of renewable energy sources, necessitating backup power generation. Furthermore, the region's economic diversification strategies and large-scale projects contribute to the market's expansion. The high CAGR of 9.68% reflects a significant upward trajectory, indicating substantial investment in power rental solutions. The market segmentation highlights the dominance of natural gas-powered generators, reflecting both cost-effectiveness and availability. However, a shift towards more environmentally friendly fuel types, such as diesel alternatives and potentially even hybrid solutions, is expected as sustainability concerns gain traction. The key players in the market, including Rental Solutions & Services LLC, Jubaili Bros LLC, and Aggreko Middle East Ltd, are strategically positioning themselves to capitalize on this growth, focusing on both equipment rental and service offerings.
The competitive landscape is characterized by a mix of established international players and local companies. Competition centers around service quality, equipment reliability, and cost-effectiveness. The market is also witnessing an increase in technological advancements, with smart energy solutions and advanced monitoring systems improving efficiency and reducing operational costs. While challenges like fluctuating fuel prices and regulatory hurdles exist, the overall market outlook remains positive, projecting continued growth over the forecast period (2025-2033). Future growth will likely be influenced by government initiatives promoting renewable energy integration and the overall economic stability of the region. The construction and oil & gas sectors will continue to be significant contributors to the market's demand.
MEA Power Rental Industry Market Report: 2019-2033
This comprehensive report provides an in-depth analysis of the Middle East and Africa (MEA) power rental industry, covering market dynamics, growth trends, key players, and future outlook. The report utilizes data from 2019-2024 (Historical Period), with a base year of 2025 and a forecast period extending to 2033. The study segments the market by application (Prime Power, Peak Shaving, Emergency Standby), end-user (Utilities, Oil & Gas, Construction, Other End-Users), and fuel type (Natural Gas, Diesel), offering a granular understanding of this dynamic sector. The report is invaluable for industry professionals, investors, and strategic decision-makers seeking a clear picture of the MEA power rental landscape.
MEA Power Rental Industry Market Dynamics & Structure
The MEA power rental market is characterized by a moderately concentrated landscape, with key players like Aggreko Middle East Ltd, Byrne Equipment Rental LLC, and Jubaili Bros LLC holding significant market share. Market concentration is estimated at xx% in 2025. Technological innovation, driven by the demand for efficient and reliable power solutions, is a key driver. However, regulatory frameworks and varying infrastructure across the region present challenges. The market also faces competition from alternative power sources, such as solar and wind energy. M&A activity remains moderate, with an estimated xx number of deals in the last 5 years. The increasing demand for power in the rapidly developing economies of the region presents opportunities for market expansion.
- Market Concentration: xx% in 2025 (Estimated)
- Technological Innovation Drivers: Emphasis on fuel efficiency, automation, and digital monitoring.
- Regulatory Frameworks: Varying across MEA countries, impacting market entry and operation.
- Competitive Product Substitutes: Solar, wind, and other renewable energy sources.
- End-User Demographics: Predominantly driven by infrastructure development, industrial growth and rising population in key markets.
- M&A Trends: Moderate activity, with xx deals estimated over the past 5 years.
MEA Power Rental Industry Growth Trends & Insights
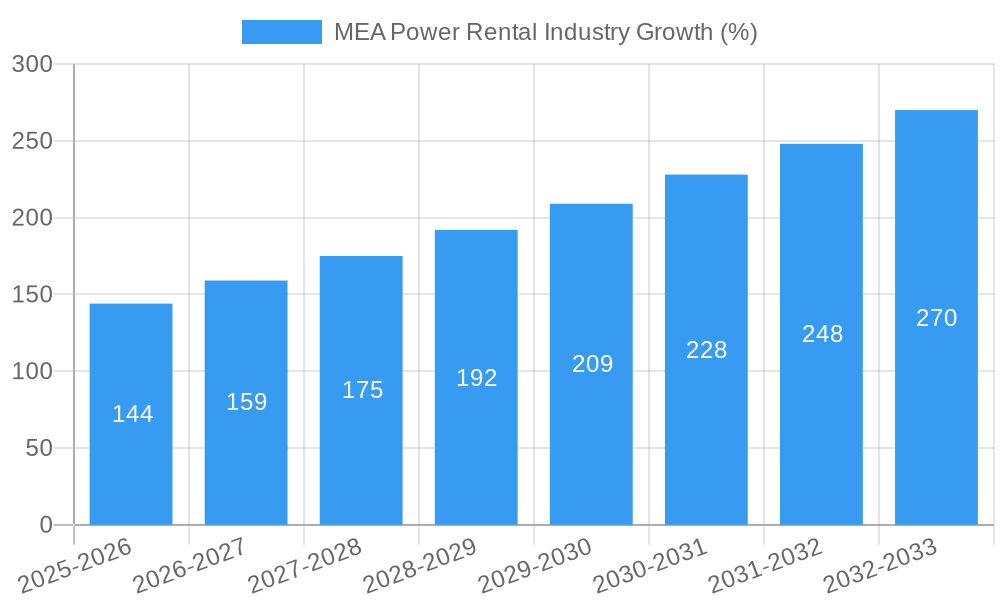
The MEA power rental market witnessed significant growth during the historical period (2019-2024). Driven by increasing urbanization, industrialization, and infrastructure development projects across the region, the market size expanded from xx million units in 2019 to xx million units in 2024, representing a CAGR of xx%. The forecast period (2025-2033) projects continued growth, albeit at a slightly moderated pace, reaching xx million units by 2033 with a projected CAGR of xx%. This growth is fueled by rising energy demands, particularly in emerging economies. Technological advancements in generator sets are also influencing market trends towards efficiency and environmental responsibility. Adoption rates for advanced technologies like remote monitoring and predictive maintenance are gradually increasing but still remain lower in certain market segments.
Dominant Regions, Countries, or Segments in MEA Power Rental Industry
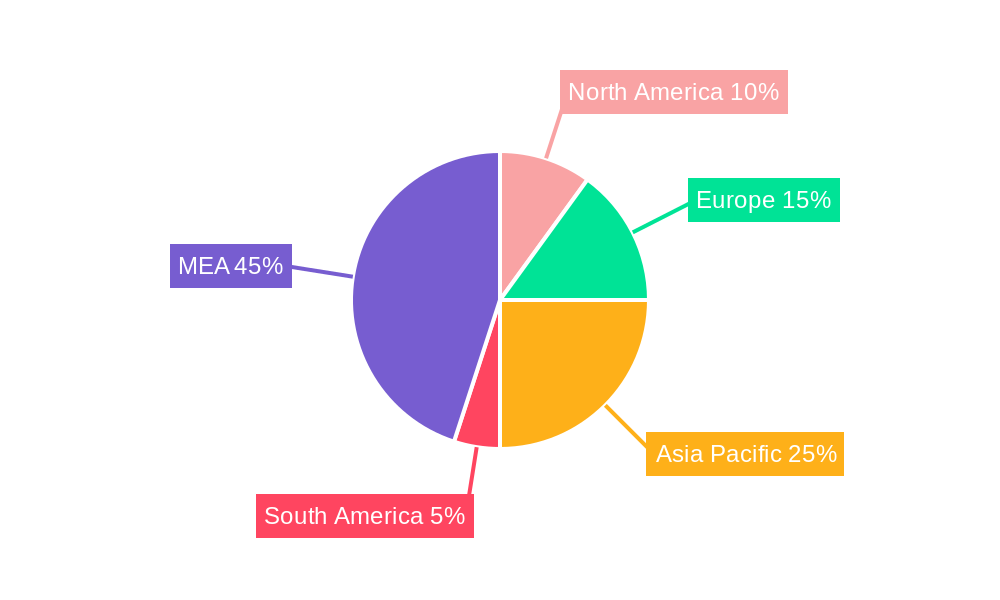
The UAE and Saudi Arabia currently lead the MEA power rental market due to extensive infrastructure development projects, a robust oil and gas sector, and significant investments in renewable energy sources. Within applications, the Prime Power segment dominates, accounting for xx% of the market share in 2025, followed by Emergency Standby and Peak Shaving segments. The Oil and Gas sector is the largest end-user segment.
Key Drivers:
- Economic Growth: High economic activity in several MEA countries fuels demand.
- Infrastructure Development: Extensive investments in infrastructure projects across the region.
- Energy Demand: Rising energy consumption due to population growth and industrialization.
- Government Initiatives: Support for renewable energy adoption and infrastructure investments.
Dominance Factors: Market size, investment in infrastructure, and economic growth.
MEA Power Rental Industry Product Landscape
The MEA power rental market offers a diverse range of generators, ranging from smaller, mobile units for construction to large, stationary systems for industrial use. Innovations focus on improved fuel efficiency, reduced emissions, and enhanced operational reliability. Products are increasingly incorporating smart technologies for remote monitoring and predictive maintenance. Key selling propositions include versatility, ease of operation, and cost-effectiveness.
Key Drivers, Barriers & Challenges in MEA Power Rental Industry
Key Drivers: Rising energy demand, infrastructure development projects, and increasing industrial activities are propelling market growth. Government incentives for renewable energy integration also contribute to expansion.
Challenges: High upfront capital costs, competition from other power generation sources, and regulatory hurdles in obtaining permits and licenses can hamper market expansion. Fluctuations in fuel prices and supply chain disruptions also pose risks. The impact of these challenges on market growth is estimated at a reduction of xx% by 2033.
Emerging Opportunities in MEA Power Rental Industry
Untapped markets in less developed regions of MEA offer significant growth potential. The integration of renewable energy sources into rental solutions is gaining traction, presenting opportunities for environmentally conscious businesses. Moreover, increasing focus on data-driven services and predictive maintenance capabilities offers opportunities to enhance the service value proposition to customers.
Growth Accelerators in the MEA Power Rental Industry
Technological advancements in generator technology, such as improved fuel efficiency and emission reduction technologies, are key growth catalysts. Strategic partnerships between rental companies and technology providers can fuel innovation and expand market reach. Market expansion into underserved regions and diversification of end-user segments can further accelerate growth.
Key Players Shaping the MEA Power Rental Industry Market
- Rental Solutions & Services LLC (If this link is accurate, otherwise replace with appropriate link or remove the link and leave only the company name)
- Jubaili Bros LLC
- Eaton Corporation PLC
- Aggreko Middle East Ltd
- Byrne Equipment Rental LLC
- Jozi Power Limited
- SES SMART Energy Solutions FZCO
- KPS Power Generation
- Peax Equipment Rental
Notable Milestones in MEA Power Rental Industry Sector
- 2021: Aggreko Middle East Ltd launched a new line of hybrid power generation units.
- 2022: Jubaili Bros LLC acquired a smaller rental company, expanding its market reach.
- 2023: Several companies invested heavily in digital solutions to optimize their fleet management. (Further milestones to be added based on research)
In-Depth MEA Power Rental Industry Market Outlook
The MEA power rental industry is poised for continued growth, driven by sustained infrastructure development, increasing energy demands, and the adoption of more efficient technologies. Strategic investments in renewable energy integration and expansion into untapped markets present significant opportunities for industry players. The market’s long-term potential is strong, with significant returns expected for companies embracing innovation and adapting to the evolving energy landscape.
MEA Power Rental Industry Segmentation
-
1. End-User
- 1.1. Utilities
- 1.2. Oil and Gas
- 1.3. Construction
- 1.4. Other End-Users
-
2. Fuel Type
- 2.1. Natural Gas
- 2.2. Diesel
-
3. Application
- 3.1. Prime Power
- 3.2. Peak Shaving
- 3.3. Emergency Standby
-
4. Geography
- 4.1. South Africa
- 4.2. Saudi Arabia
- 4.3. United Arab Emirates
- 4.4. Rest of Middle East and Africa
MEA Power Rental Industry Segmentation By Geography
- 1. South Africa
- 2. Saudi Arabia
- 3. United Arab Emirates
- 4. Rest of Middle East and Africa
MEA Power Rental Industry REPORT HIGHLIGHTS
| Aspects | Details |
|---|---|
| Study Period | 2019-2033 |
| Base Year | 2024 |
| Estimated Year | 2025 |
| Forecast Period | 2025-2033 |
| Historical Period | 2019-2024 |
| Growth Rate | CAGR of > 9.68% from 2019-2033 |
| Segmentation |
|
Table of Contents
- 1. Introduction
- 1.1. Research Scope
- 1.2. Market Segmentation
- 1.3. Research Methodology
- 1.4. Definitions and Assumptions
- 2. Executive Summary
- 2.1. Introduction
- 3. Market Dynamics
- 3.1. Introduction
- 3.2. Market Drivers
- 3.2.1. 4.; Favorable Government Policies
- 3.3. Market Restrains
- 3.3.1. 4.; Rising Emphasis on Other Alternative Clean Energy Sources
- 3.4. Market Trends
- 3.4.1. Utility Segment to Dominate the Market
- 4. Market Factor Analysis
- 4.1. Porters Five Forces
- 4.2. Supply/Value Chain
- 4.3. PESTEL analysis
- 4.4. Market Entropy
- 4.5. Patent/Trademark Analysis
- 5. Global MEA Power Rental Industry Analysis, Insights and Forecast, 2019-2031
- 5.1. Market Analysis, Insights and Forecast - by End-User
- 5.1.1. Utilities
- 5.1.2. Oil and Gas
- 5.1.3. Construction
- 5.1.4. Other End-Users
- 5.2. Market Analysis, Insights and Forecast - by Fuel Type
- 5.2.1. Natural Gas
- 5.2.2. Diesel
- 5.3. Market Analysis, Insights and Forecast - by Application
- 5.3.1. Prime Power
- 5.3.2. Peak Shaving
- 5.3.3. Emergency Standby
- 5.4. Market Analysis, Insights and Forecast - by Geography
- 5.4.1. South Africa
- 5.4.2. Saudi Arabia
- 5.4.3. United Arab Emirates
- 5.4.4. Rest of Middle East and Africa
- 5.5. Market Analysis, Insights and Forecast - by Region
- 5.5.1. South Africa
- 5.5.2. Saudi Arabia
- 5.5.3. United Arab Emirates
- 5.5.4. Rest of Middle East and Africa
- 5.1. Market Analysis, Insights and Forecast - by End-User
- 6. South Africa MEA Power Rental Industry Analysis, Insights and Forecast, 2019-2031
- 6.1. Market Analysis, Insights and Forecast - by End-User
- 6.1.1. Utilities
- 6.1.2. Oil and Gas
- 6.1.3. Construction
- 6.1.4. Other End-Users
- 6.2. Market Analysis, Insights and Forecast - by Fuel Type
- 6.2.1. Natural Gas
- 6.2.2. Diesel
- 6.3. Market Analysis, Insights and Forecast - by Application
- 6.3.1. Prime Power
- 6.3.2. Peak Shaving
- 6.3.3. Emergency Standby
- 6.4. Market Analysis, Insights and Forecast - by Geography
- 6.4.1. South Africa
- 6.4.2. Saudi Arabia
- 6.4.3. United Arab Emirates
- 6.4.4. Rest of Middle East and Africa
- 6.1. Market Analysis, Insights and Forecast - by End-User
- 7. Saudi Arabia MEA Power Rental Industry Analysis, Insights and Forecast, 2019-2031
- 7.1. Market Analysis, Insights and Forecast - by End-User
- 7.1.1. Utilities
- 7.1.2. Oil and Gas
- 7.1.3. Construction
- 7.1.4. Other End-Users
- 7.2. Market Analysis, Insights and Forecast - by Fuel Type
- 7.2.1. Natural Gas
- 7.2.2. Diesel
- 7.3. Market Analysis, Insights and Forecast - by Application
- 7.3.1. Prime Power
- 7.3.2. Peak Shaving
- 7.3.3. Emergency Standby
- 7.4. Market Analysis, Insights and Forecast - by Geography
- 7.4.1. South Africa
- 7.4.2. Saudi Arabia
- 7.4.3. United Arab Emirates
- 7.4.4. Rest of Middle East and Africa
- 7.1. Market Analysis, Insights and Forecast - by End-User
- 8. United Arab Emirates MEA Power Rental Industry Analysis, Insights and Forecast, 2019-2031
- 8.1. Market Analysis, Insights and Forecast - by End-User
- 8.1.1. Utilities
- 8.1.2. Oil and Gas
- 8.1.3. Construction
- 8.1.4. Other End-Users
- 8.2. Market Analysis, Insights and Forecast - by Fuel Type
- 8.2.1. Natural Gas
- 8.2.2. Diesel
- 8.3. Market Analysis, Insights and Forecast - by Application
- 8.3.1. Prime Power
- 8.3.2. Peak Shaving
- 8.3.3. Emergency Standby
- 8.4. Market Analysis, Insights and Forecast - by Geography
- 8.4.1. South Africa
- 8.4.2. Saudi Arabia
- 8.4.3. United Arab Emirates
- 8.4.4. Rest of Middle East and Africa
- 8.1. Market Analysis, Insights and Forecast - by End-User
- 9. Rest of Middle East and Africa MEA Power Rental Industry Analysis, Insights and Forecast, 2019-2031
- 9.1. Market Analysis, Insights and Forecast - by End-User
- 9.1.1. Utilities
- 9.1.2. Oil and Gas
- 9.1.3. Construction
- 9.1.4. Other End-Users
- 9.2. Market Analysis, Insights and Forecast - by Fuel Type
- 9.2.1. Natural Gas
- 9.2.2. Diesel
- 9.3. Market Analysis, Insights and Forecast - by Application
- 9.3.1. Prime Power
- 9.3.2. Peak Shaving
- 9.3.3. Emergency Standby
- 9.4. Market Analysis, Insights and Forecast - by Geography
- 9.4.1. South Africa
- 9.4.2. Saudi Arabia
- 9.4.3. United Arab Emirates
- 9.4.4. Rest of Middle East and Africa
- 9.1. Market Analysis, Insights and Forecast - by End-User
- 10. North America MEA Power Rental Industry Analysis, Insights and Forecast, 2019-2031
- 10.1. Market Analysis, Insights and Forecast - By Country/Sub-region
- 10.1.1 United States
- 10.1.2 Canada
- 10.1.3 Mexico
- 11. Europe MEA Power Rental Industry Analysis, Insights and Forecast, 2019-2031
- 11.1. Market Analysis, Insights and Forecast - By Country/Sub-region
- 11.1.1 Germany
- 11.1.2 United Kingdom
- 11.1.3 France
- 11.1.4 Spain
- 11.1.5 Italy
- 11.1.6 Spain
- 11.1.7 Belgium
- 11.1.8 Netherland
- 11.1.9 Nordics
- 11.1.10 Rest of Europe
- 12. Asia Pacific MEA Power Rental Industry Analysis, Insights and Forecast, 2019-2031
- 12.1. Market Analysis, Insights and Forecast - By Country/Sub-region
- 12.1.1 China
- 12.1.2 Japan
- 12.1.3 India
- 12.1.4 South Korea
- 12.1.5 Southeast Asia
- 12.1.6 Australia
- 12.1.7 Indonesia
- 12.1.8 Phillipes
- 12.1.9 Singapore
- 12.1.10 Thailandc
- 12.1.11 Rest of Asia Pacific
- 13. South America MEA Power Rental Industry Analysis, Insights and Forecast, 2019-2031
- 13.1. Market Analysis, Insights and Forecast - By Country/Sub-region
- 13.1.1 Brazil
- 13.1.2 Argentina
- 13.1.3 Peru
- 13.1.4 Chile
- 13.1.5 Colombia
- 13.1.6 Ecuador
- 13.1.7 Venezuela
- 13.1.8 Rest of South America
- 14. North America MEA Power Rental Industry Analysis, Insights and Forecast, 2019-2031
- 14.1. Market Analysis, Insights and Forecast - By Country/Sub-region
- 14.1.1 United States
- 14.1.2 Canada
- 14.1.3 Mexico
- 15. MEA MEA Power Rental Industry Analysis, Insights and Forecast, 2019-2031
- 15.1. Market Analysis, Insights and Forecast - By Country/Sub-region
- 15.1.1 United Arab Emirates
- 15.1.2 Saudi Arabia
- 15.1.3 South Africa
- 15.1.4 Rest of Middle East and Africa
- 16. Competitive Analysis
- 16.1. Global Market Share Analysis 2024
- 16.2. Company Profiles
- 16.2.1 Rental Solutions & Services LLC
- 16.2.1.1. Overview
- 16.2.1.2. Products
- 16.2.1.3. SWOT Analysis
- 16.2.1.4. Recent Developments
- 16.2.1.5. Financials (Based on Availability)
- 16.2.2 Jubaili Bros LLC
- 16.2.2.1. Overview
- 16.2.2.2. Products
- 16.2.2.3. SWOT Analysis
- 16.2.2.4. Recent Developments
- 16.2.2.5. Financials (Based on Availability)
- 16.2.3 Eaton Corporation PLC*List Not Exhaustive
- 16.2.3.1. Overview
- 16.2.3.2. Products
- 16.2.3.3. SWOT Analysis
- 16.2.3.4. Recent Developments
- 16.2.3.5. Financials (Based on Availability)
- 16.2.4 Aggreko Middle East Ltd
- 16.2.4.1. Overview
- 16.2.4.2. Products
- 16.2.4.3. SWOT Analysis
- 16.2.4.4. Recent Developments
- 16.2.4.5. Financials (Based on Availability)
- 16.2.5 Byrne Equipment Rental LLC
- 16.2.5.1. Overview
- 16.2.5.2. Products
- 16.2.5.3. SWOT Analysis
- 16.2.5.4. Recent Developments
- 16.2.5.5. Financials (Based on Availability)
- 16.2.6 Jozi Power Limited
- 16.2.6.1. Overview
- 16.2.6.2. Products
- 16.2.6.3. SWOT Analysis
- 16.2.6.4. Recent Developments
- 16.2.6.5. Financials (Based on Availability)
- 16.2.7 SES SMART Energy Solutions FZCO
- 16.2.7.1. Overview
- 16.2.7.2. Products
- 16.2.7.3. SWOT Analysis
- 16.2.7.4. Recent Developments
- 16.2.7.5. Financials (Based on Availability)
- 16.2.8 KPS Power Generation
- 16.2.8.1. Overview
- 16.2.8.2. Products
- 16.2.8.3. SWOT Analysis
- 16.2.8.4. Recent Developments
- 16.2.8.5. Financials (Based on Availability)
- 16.2.9 Peax Equipment Rental
- 16.2.9.1. Overview
- 16.2.9.2. Products
- 16.2.9.3. SWOT Analysis
- 16.2.9.4. Recent Developments
- 16.2.9.5. Financials (Based on Availability)
- 16.2.1 Rental Solutions & Services LLC
List of Figures
- Figure 1: Global MEA Power Rental Industry Revenue Breakdown (Million, %) by Region 2024 & 2032
- Figure 2: North America MEA Power Rental Industry Revenue (Million), by Country 2024 & 2032
- Figure 3: North America MEA Power Rental Industry Revenue Share (%), by Country 2024 & 2032
- Figure 4: Europe MEA Power Rental Industry Revenue (Million), by Country 2024 & 2032
- Figure 5: Europe MEA Power Rental Industry Revenue Share (%), by Country 2024 & 2032
- Figure 6: Asia Pacific MEA Power Rental Industry Revenue (Million), by Country 2024 & 2032
- Figure 7: Asia Pacific MEA Power Rental Industry Revenue Share (%), by Country 2024 & 2032
- Figure 8: South America MEA Power Rental Industry Revenue (Million), by Country 2024 & 2032
- Figure 9: South America MEA Power Rental Industry Revenue Share (%), by Country 2024 & 2032
- Figure 10: North America MEA Power Rental Industry Revenue (Million), by Country 2024 & 2032
- Figure 11: North America MEA Power Rental Industry Revenue Share (%), by Country 2024 & 2032
- Figure 12: MEA MEA Power Rental Industry Revenue (Million), by Country 2024 & 2032
- Figure 13: MEA MEA Power Rental Industry Revenue Share (%), by Country 2024 & 2032
- Figure 14: South Africa MEA Power Rental Industry Revenue (Million), by End-User 2024 & 2032
- Figure 15: South Africa MEA Power Rental Industry Revenue Share (%), by End-User 2024 & 2032
- Figure 16: South Africa MEA Power Rental Industry Revenue (Million), by Fuel Type 2024 & 2032
- Figure 17: South Africa MEA Power Rental Industry Revenue Share (%), by Fuel Type 2024 & 2032
- Figure 18: South Africa MEA Power Rental Industry Revenue (Million), by Application 2024 & 2032
- Figure 19: South Africa MEA Power Rental Industry Revenue Share (%), by Application 2024 & 2032
- Figure 20: South Africa MEA Power Rental Industry Revenue (Million), by Geography 2024 & 2032
- Figure 21: South Africa MEA Power Rental Industry Revenue Share (%), by Geography 2024 & 2032
- Figure 22: South Africa MEA Power Rental Industry Revenue (Million), by Country 2024 & 2032
- Figure 23: South Africa MEA Power Rental Industry Revenue Share (%), by Country 2024 & 2032
- Figure 24: Saudi Arabia MEA Power Rental Industry Revenue (Million), by End-User 2024 & 2032
- Figure 25: Saudi Arabia MEA Power Rental Industry Revenue Share (%), by End-User 2024 & 2032
- Figure 26: Saudi Arabia MEA Power Rental Industry Revenue (Million), by Fuel Type 2024 & 2032
- Figure 27: Saudi Arabia MEA Power Rental Industry Revenue Share (%), by Fuel Type 2024 & 2032
- Figure 28: Saudi Arabia MEA Power Rental Industry Revenue (Million), by Application 2024 & 2032
- Figure 29: Saudi Arabia MEA Power Rental Industry Revenue Share (%), by Application 2024 & 2032
- Figure 30: Saudi Arabia MEA Power Rental Industry Revenue (Million), by Geography 2024 & 2032
- Figure 31: Saudi Arabia MEA Power Rental Industry Revenue Share (%), by Geography 2024 & 2032
- Figure 32: Saudi Arabia MEA Power Rental Industry Revenue (Million), by Country 2024 & 2032
- Figure 33: Saudi Arabia MEA Power Rental Industry Revenue Share (%), by Country 2024 & 2032
- Figure 34: United Arab Emirates MEA Power Rental Industry Revenue (Million), by End-User 2024 & 2032
- Figure 35: United Arab Emirates MEA Power Rental Industry Revenue Share (%), by End-User 2024 & 2032
- Figure 36: United Arab Emirates MEA Power Rental Industry Revenue (Million), by Fuel Type 2024 & 2032
- Figure 37: United Arab Emirates MEA Power Rental Industry Revenue Share (%), by Fuel Type 2024 & 2032
- Figure 38: United Arab Emirates MEA Power Rental Industry Revenue (Million), by Application 2024 & 2032
- Figure 39: United Arab Emirates MEA Power Rental Industry Revenue Share (%), by Application 2024 & 2032
- Figure 40: United Arab Emirates MEA Power Rental Industry Revenue (Million), by Geography 2024 & 2032
- Figure 41: United Arab Emirates MEA Power Rental Industry Revenue Share (%), by Geography 2024 & 2032
- Figure 42: United Arab Emirates MEA Power Rental Industry Revenue (Million), by Country 2024 & 2032
- Figure 43: United Arab Emirates MEA Power Rental Industry Revenue Share (%), by Country 2024 & 2032
- Figure 44: Rest of Middle East and Africa MEA Power Rental Industry Revenue (Million), by End-User 2024 & 2032
- Figure 45: Rest of Middle East and Africa MEA Power Rental Industry Revenue Share (%), by End-User 2024 & 2032
- Figure 46: Rest of Middle East and Africa MEA Power Rental Industry Revenue (Million), by Fuel Type 2024 & 2032
- Figure 47: Rest of Middle East and Africa MEA Power Rental Industry Revenue Share (%), by Fuel Type 2024 & 2032
- Figure 48: Rest of Middle East and Africa MEA Power Rental Industry Revenue (Million), by Application 2024 & 2032
- Figure 49: Rest of Middle East and Africa MEA Power Rental Industry Revenue Share (%), by Application 2024 & 2032
- Figure 50: Rest of Middle East and Africa MEA Power Rental Industry Revenue (Million), by Geography 2024 & 2032
- Figure 51: Rest of Middle East and Africa MEA Power Rental Industry Revenue Share (%), by Geography 2024 & 2032
- Figure 52: Rest of Middle East and Africa MEA Power Rental Industry Revenue (Million), by Country 2024 & 2032
- Figure 53: Rest of Middle East and Africa MEA Power Rental Industry Revenue Share (%), by Country 2024 & 2032
List of Tables
- Table 1: Global MEA Power Rental Industry Revenue Million Forecast, by Region 2019 & 2032
- Table 2: Global MEA Power Rental Industry Revenue Million Forecast, by End-User 2019 & 2032
- Table 3: Global MEA Power Rental Industry Revenue Million Forecast, by Fuel Type 2019 & 2032
- Table 4: Global MEA Power Rental Industry Revenue Million Forecast, by Application 2019 & 2032
- Table 5: Global MEA Power Rental Industry Revenue Million Forecast, by Geography 2019 & 2032
- Table 6: Global MEA Power Rental Industry Revenue Million Forecast, by Region 2019 & 2032
- Table 7: Global MEA Power Rental Industry Revenue Million Forecast, by Country 2019 & 2032
- Table 8: United States MEA Power Rental Industry Revenue (Million) Forecast, by Application 2019 & 2032
- Table 9: Canada MEA Power Rental Industry Revenue (Million) Forecast, by Application 2019 & 2032
- Table 10: Mexico MEA Power Rental Industry Revenue (Million) Forecast, by Application 2019 & 2032
- Table 11: Global MEA Power Rental Industry Revenue Million Forecast, by Country 2019 & 2032
- Table 12: Germany MEA Power Rental Industry Revenue (Million) Forecast, by Application 2019 & 2032
- Table 13: United Kingdom MEA Power Rental Industry Revenue (Million) Forecast, by Application 2019 & 2032
- Table 14: France MEA Power Rental Industry Revenue (Million) Forecast, by Application 2019 & 2032
- Table 15: Spain MEA Power Rental Industry Revenue (Million) Forecast, by Application 2019 & 2032
- Table 16: Italy MEA Power Rental Industry Revenue (Million) Forecast, by Application 2019 & 2032
- Table 17: Spain MEA Power Rental Industry Revenue (Million) Forecast, by Application 2019 & 2032
- Table 18: Belgium MEA Power Rental Industry Revenue (Million) Forecast, by Application 2019 & 2032
- Table 19: Netherland MEA Power Rental Industry Revenue (Million) Forecast, by Application 2019 & 2032
- Table 20: Nordics MEA Power Rental Industry Revenue (Million) Forecast, by Application 2019 & 2032
- Table 21: Rest of Europe MEA Power Rental Industry Revenue (Million) Forecast, by Application 2019 & 2032
- Table 22: Global MEA Power Rental Industry Revenue Million Forecast, by Country 2019 & 2032
- Table 23: China MEA Power Rental Industry Revenue (Million) Forecast, by Application 2019 & 2032
- Table 24: Japan MEA Power Rental Industry Revenue (Million) Forecast, by Application 2019 & 2032
- Table 25: India MEA Power Rental Industry Revenue (Million) Forecast, by Application 2019 & 2032
- Table 26: South Korea MEA Power Rental Industry Revenue (Million) Forecast, by Application 2019 & 2032
- Table 27: Southeast Asia MEA Power Rental Industry Revenue (Million) Forecast, by Application 2019 & 2032
- Table 28: Australia MEA Power Rental Industry Revenue (Million) Forecast, by Application 2019 & 2032
- Table 29: Indonesia MEA Power Rental Industry Revenue (Million) Forecast, by Application 2019 & 2032
- Table 30: Phillipes MEA Power Rental Industry Revenue (Million) Forecast, by Application 2019 & 2032
- Table 31: Singapore MEA Power Rental Industry Revenue (Million) Forecast, by Application 2019 & 2032
- Table 32: Thailandc MEA Power Rental Industry Revenue (Million) Forecast, by Application 2019 & 2032
- Table 33: Rest of Asia Pacific MEA Power Rental Industry Revenue (Million) Forecast, by Application 2019 & 2032
- Table 34: Global MEA Power Rental Industry Revenue Million Forecast, by Country 2019 & 2032
- Table 35: Brazil MEA Power Rental Industry Revenue (Million) Forecast, by Application 2019 & 2032
- Table 36: Argentina MEA Power Rental Industry Revenue (Million) Forecast, by Application 2019 & 2032
- Table 37: Peru MEA Power Rental Industry Revenue (Million) Forecast, by Application 2019 & 2032
- Table 38: Chile MEA Power Rental Industry Revenue (Million) Forecast, by Application 2019 & 2032
- Table 39: Colombia MEA Power Rental Industry Revenue (Million) Forecast, by Application 2019 & 2032
- Table 40: Ecuador MEA Power Rental Industry Revenue (Million) Forecast, by Application 2019 & 2032
- Table 41: Venezuela MEA Power Rental Industry Revenue (Million) Forecast, by Application 2019 & 2032
- Table 42: Rest of South America MEA Power Rental Industry Revenue (Million) Forecast, by Application 2019 & 2032
- Table 43: Global MEA Power Rental Industry Revenue Million Forecast, by Country 2019 & 2032
- Table 44: United States MEA Power Rental Industry Revenue (Million) Forecast, by Application 2019 & 2032
- Table 45: Canada MEA Power Rental Industry Revenue (Million) Forecast, by Application 2019 & 2032
- Table 46: Mexico MEA Power Rental Industry Revenue (Million) Forecast, by Application 2019 & 2032
- Table 47: Global MEA Power Rental Industry Revenue Million Forecast, by Country 2019 & 2032
- Table 48: United Arab Emirates MEA Power Rental Industry Revenue (Million) Forecast, by Application 2019 & 2032
- Table 49: Saudi Arabia MEA Power Rental Industry Revenue (Million) Forecast, by Application 2019 & 2032
- Table 50: South Africa MEA Power Rental Industry Revenue (Million) Forecast, by Application 2019 & 2032
- Table 51: Rest of Middle East and Africa MEA Power Rental Industry Revenue (Million) Forecast, by Application 2019 & 2032
- Table 52: Global MEA Power Rental Industry Revenue Million Forecast, by End-User 2019 & 2032
- Table 53: Global MEA Power Rental Industry Revenue Million Forecast, by Fuel Type 2019 & 2032
- Table 54: Global MEA Power Rental Industry Revenue Million Forecast, by Application 2019 & 2032
- Table 55: Global MEA Power Rental Industry Revenue Million Forecast, by Geography 2019 & 2032
- Table 56: Global MEA Power Rental Industry Revenue Million Forecast, by Country 2019 & 2032
- Table 57: Global MEA Power Rental Industry Revenue Million Forecast, by End-User 2019 & 2032
- Table 58: Global MEA Power Rental Industry Revenue Million Forecast, by Fuel Type 2019 & 2032
- Table 59: Global MEA Power Rental Industry Revenue Million Forecast, by Application 2019 & 2032
- Table 60: Global MEA Power Rental Industry Revenue Million Forecast, by Geography 2019 & 2032
- Table 61: Global MEA Power Rental Industry Revenue Million Forecast, by Country 2019 & 2032
- Table 62: Global MEA Power Rental Industry Revenue Million Forecast, by End-User 2019 & 2032
- Table 63: Global MEA Power Rental Industry Revenue Million Forecast, by Fuel Type 2019 & 2032
- Table 64: Global MEA Power Rental Industry Revenue Million Forecast, by Application 2019 & 2032
- Table 65: Global MEA Power Rental Industry Revenue Million Forecast, by Geography 2019 & 2032
- Table 66: Global MEA Power Rental Industry Revenue Million Forecast, by Country 2019 & 2032
- Table 67: Global MEA Power Rental Industry Revenue Million Forecast, by End-User 2019 & 2032
- Table 68: Global MEA Power Rental Industry Revenue Million Forecast, by Fuel Type 2019 & 2032
- Table 69: Global MEA Power Rental Industry Revenue Million Forecast, by Application 2019 & 2032
- Table 70: Global MEA Power Rental Industry Revenue Million Forecast, by Geography 2019 & 2032
- Table 71: Global MEA Power Rental Industry Revenue Million Forecast, by Country 2019 & 2032
Frequently Asked Questions
1. What is the projected Compound Annual Growth Rate (CAGR) of the MEA Power Rental Industry?
The projected CAGR is approximately > 9.68%.
2. Which companies are prominent players in the MEA Power Rental Industry?
Key companies in the market include Rental Solutions & Services LLC, Jubaili Bros LLC, Eaton Corporation PLC*List Not Exhaustive, Aggreko Middle East Ltd, Byrne Equipment Rental LLC, Jozi Power Limited, SES SMART Energy Solutions FZCO, KPS Power Generation, Peax Equipment Rental.
3. What are the main segments of the MEA Power Rental Industry?
The market segments include End-User, Fuel Type, Application, Geography.
4. Can you provide details about the market size?
The market size is estimated to be USD XX Million as of 2022.
5. What are some drivers contributing to market growth?
4.; Favorable Government Policies.
6. What are the notable trends driving market growth?
Utility Segment to Dominate the Market.
7. Are there any restraints impacting market growth?
4.; Rising Emphasis on Other Alternative Clean Energy Sources.
8. Can you provide examples of recent developments in the market?
N/A
9. What pricing options are available for accessing the report?
Pricing options include single-user, multi-user, and enterprise licenses priced at USD 4750, USD 5250, and USD 8750 respectively.
10. Is the market size provided in terms of value or volume?
The market size is provided in terms of value, measured in Million.
11. Are there any specific market keywords associated with the report?
Yes, the market keyword associated with the report is "MEA Power Rental Industry," which aids in identifying and referencing the specific market segment covered.
12. How do I determine which pricing option suits my needs best?
The pricing options vary based on user requirements and access needs. Individual users may opt for single-user licenses, while businesses requiring broader access may choose multi-user or enterprise licenses for cost-effective access to the report.
13. Are there any additional resources or data provided in the MEA Power Rental Industry report?
While the report offers comprehensive insights, it's advisable to review the specific contents or supplementary materials provided to ascertain if additional resources or data are available.
14. How can I stay updated on further developments or reports in the MEA Power Rental Industry?
To stay informed about further developments, trends, and reports in the MEA Power Rental Industry, consider subscribing to industry newsletters, following relevant companies and organizations, or regularly checking reputable industry news sources and publications.
Methodology
Step 1 - Identification of Relevant Samples Size from Population Database


Step 2 - Approaches for Defining Global Market Size (Value, Volume* & Price*)

Note*: In applicable scenarios
Step 3 - Data Sources
Primary Research
- Web Analytics
- Survey Reports
- Research Institute
- Latest Research Reports
- Opinion Leaders
Secondary Research
- Annual Reports
- White Paper
- Latest Press Release
- Industry Association
- Paid Database
- Investor Presentations

Step 4 - Data Triangulation
Involves using different sources of information in order to increase the validity of a study
These sources are likely to be stakeholders in a program - participants, other researchers, program staff, other community members, and so on.
Then we put all data in single framework & apply various statistical tools to find out the dynamic on the market.
During the analysis stage, feedback from the stakeholder groups would be compared to determine areas of agreement as well as areas of divergence
