

Key Insights
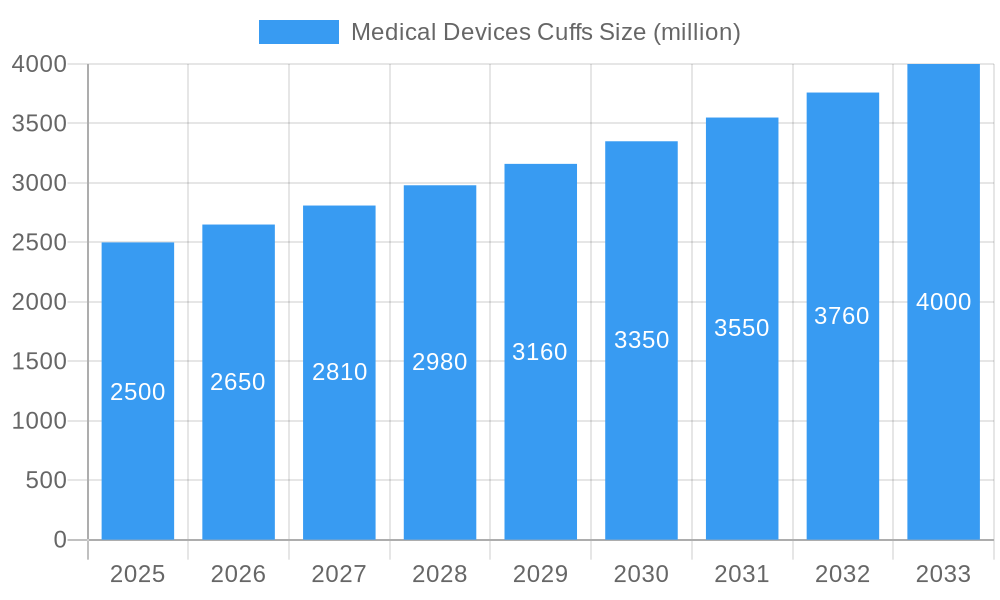
The global medical devices cuffs market is experiencing robust growth, driven by an aging population, increasing prevalence of chronic diseases requiring tracheal intubation and ventilation, and technological advancements leading to more comfortable and effective cuff designs. The market, estimated at $2.5 billion in 2025, is projected to exhibit a Compound Annual Growth Rate (CAGR) of 6% from 2025 to 2033, reaching an estimated market value of approximately $4.2 billion by 2033. Key drivers include the rising demand for minimally invasive procedures, the growing adoption of high-quality cuffs in intensive care units (ICUs), and the increasing awareness among healthcare professionals regarding the importance of appropriate cuff pressure management to prevent complications like tracheal damage and infection. Market segmentation includes different cuff types (e.g., high-volume/low-pressure, low-volume/high-pressure), materials (e.g., silicone, PVC), and applications (e.g., endotracheal tubes, tracheostomy tubes). Leading companies like Medtronic, Smiths Medical, and Teleflex Incorporated are actively investing in research and development to improve cuff technology and expand their product portfolios to meet the evolving needs of the market.
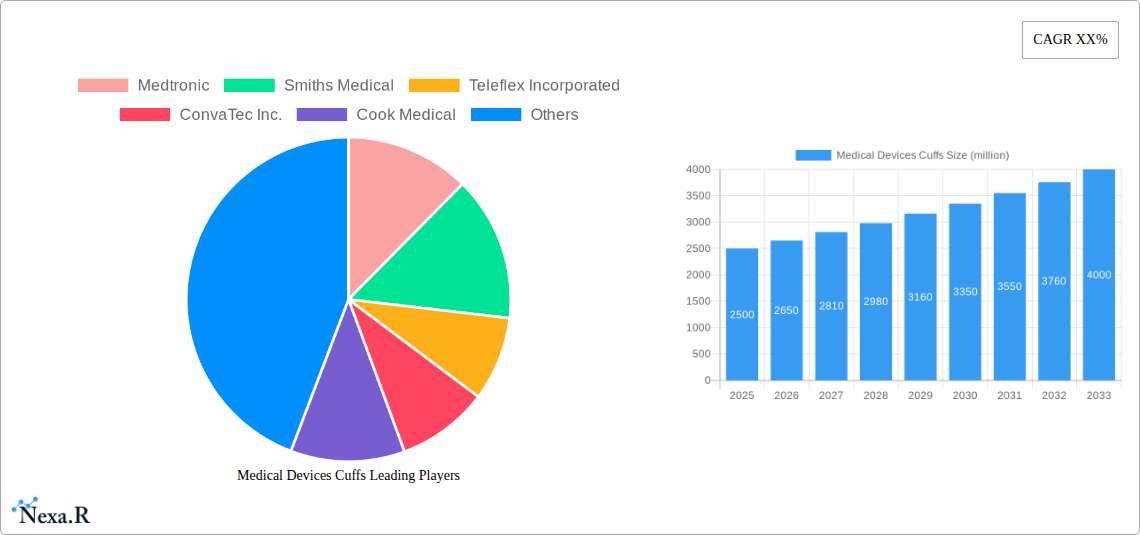
Medical Devices Cuffs Market Size (In Billion)
The market's growth is being influenced by several factors. While the increasing demand for advanced medical devices fuels expansion, certain restraints exist. These include stringent regulatory requirements for medical device approvals and potential pricing pressures from healthcare cost containment initiatives. However, innovations such as low-profile cuffs minimizing airway trauma, biocompatible materials reducing the risk of adverse reactions, and integrated pressure monitoring systems are anticipated to mitigate these restraints and drive market growth in the coming years. Regional variations in market penetration and healthcare infrastructure will also influence the overall market trajectory. Growth is expected to be particularly strong in developing economies experiencing rapid healthcare infrastructure improvements and rising disposable incomes.
Medical Devices Cuffs Company Market Share
Medical Devices Cuffs Market Report: 2019-2033
This comprehensive report provides an in-depth analysis of the Medical Devices Cuffs market, encompassing market dynamics, growth trends, regional dominance, product landscape, and key players. The study covers the period from 2019 to 2033, with a focus on the forecast period of 2025-2033 and a base year of 2025. The report's insights are crucial for industry professionals, investors, and strategic decision-makers seeking a comprehensive understanding of this dynamic market. The global market size is projected to reach xx million units by 2033.
Medical Devices Cuffs Market Dynamics & Structure
This section analyzes the competitive landscape, technological advancements, regulatory influences, and market trends within the medical devices cuffs market (parent market: Medical Devices; child market: Respiratory & Critical Care Devices). The market is characterized by a moderate level of concentration, with key players holding significant market share. However, the emergence of innovative technologies and new entrants is fostering increased competition. Regulatory frameworks, particularly those related to safety and efficacy, significantly influence market dynamics. The prevalence of chronic respiratory diseases and the increasing demand for minimally invasive procedures are key drivers. Furthermore, strategic mergers and acquisitions (M&A) are reshaping the competitive landscape. Over the historical period (2019-2024), approximately xx M&A deals involving medical devices cuffs companies were recorded, leading to significant consolidation.
- Market Concentration: Moderate, with top 5 players holding approximately xx% market share in 2024.
- Technological Innovation: Focus on improved biocompatibility, minimally invasive designs, and enhanced patient comfort. Barriers include high R&D costs and stringent regulatory approvals.
- Regulatory Frameworks: Stringent regulations related to safety and efficacy drive innovation and impact market entry.
- Competitive Product Substitutes: Limited substitutes exist, but alternative ventilation techniques pose indirect competition.
- End-User Demographics: Primarily hospitals and intensive care units (ICUs), with increasing adoption in home healthcare settings.
- M&A Trends: Consolidation through acquisitions, driving scale and technological advancements.
Medical Devices Cuffs Growth Trends & Insights
The medical devices cuffs market experienced a compound annual growth rate (CAGR) of xx% during the historical period (2019-2024), reaching xx million units in 2024. This growth is primarily driven by the rising prevalence of respiratory illnesses, an aging global population, and the increasing demand for advanced respiratory support. Technological advancements, such as the development of low-pressure cuffs and improved material science, have also contributed to market expansion. The market penetration rate in developed countries is high, while emerging markets present significant growth potential, particularly in regions with increasing healthcare infrastructure investment and rising healthcare expenditure. Shifting consumer preferences towards minimally invasive procedures and improved patient outcomes are further accelerating market growth. We project a CAGR of xx% from 2025 to 2033.
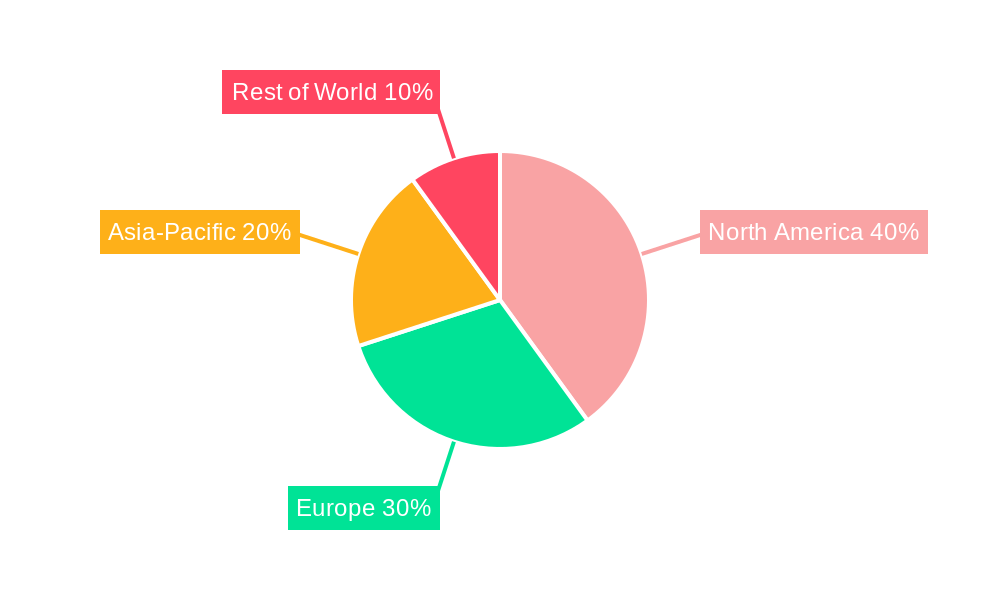
Dominant Regions, Countries, or Segments in Medical Devices Cuffs
North America currently holds the largest market share in medical devices cuffs, driven by factors such as high healthcare expenditure, advanced medical infrastructure, and a large patient pool. Europe follows as a significant market, while Asia-Pacific is projected to witness substantial growth in the coming years due to increasing healthcare awareness, rising disposable incomes, and expanding healthcare infrastructure. Within specific segments, high-volume/high-pressure cuffs dominate the market, followed by low-pressure and specialized cuffs.
- Key Drivers in North America: High healthcare expenditure, well-established healthcare infrastructure, and strong regulatory support.
- Key Drivers in Europe: Growing prevalence of respiratory diseases, increasing adoption of advanced medical technologies, and supportive healthcare policies.
- Key Drivers in Asia-Pacific: Rising healthcare expenditure, growing awareness of respiratory health, and expanding healthcare infrastructure.
Medical Devices Cuffs Product Landscape
The medical devices cuffs market offers a range of products, including high-volume/high-pressure cuffs, low-pressure cuffs, and specialized cuffs designed for specific applications. Innovations focus on improving patient comfort, reducing the risk of tracheal injury, and enhancing ease of use. Key features include biocompatible materials, advanced designs for pressure control, and integrated monitoring systems. These advancements are aimed at improving patient outcomes and streamlining clinical workflows.
Key Drivers, Barriers & Challenges in Medical Devices Cuffs
Key Drivers: Increasing prevalence of respiratory diseases, growing demand for minimally invasive procedures, technological advancements leading to improved cuff designs and materials, and increasing healthcare expenditure.
Key Challenges: Stringent regulatory requirements leading to lengthy approval processes, high R&D costs, potential for adverse events related to cuff inflation, and competition from established players. The impact of supply chain disruptions, particularly in the sourcing of raw materials, could constrain production and increase costs, potentially impacting market growth by xx% over the next 5 years.
Emerging Opportunities in Medical Devices Cuffs
Emerging opportunities lie in the development of innovative cuff designs, such as smart cuffs with integrated sensors for real-time monitoring, and the expansion into untapped markets in developing countries. There's significant potential in developing cuffs specifically tailored for pediatric and geriatric patients, addressing their unique needs and vulnerabilities.
Growth Accelerators in the Medical Devices Cuffs Industry
Strategic partnerships between manufacturers and healthcare providers can accelerate market growth by facilitating access to new technologies and expanding distribution networks. Furthermore, technological breakthroughs, particularly in material science and sensor technology, will drive the development of improved and innovative cuffs, enhancing market potential.
Key Players Shaping the Medical Devices Cuffs Market
- Medtronic
- Smiths Medical
- Teleflex Incorporated
- ConvaTec Inc.
- Cook Medical
- Troge Medical GmbH
- Fuji Systems
- Well Lead Medical Co. Ltd.
- TRACOE medical GmbH
- Pulmodyne, Inc.
Notable Milestones in Medical Devices Cuffs Sector
- 2021: Launch of a new low-pressure cuff by Medtronic.
- 2022: Acquisition of a smaller medical devices company specializing in cuffs by Smiths Medical.
- 2023: Approval of a novel cuff design with improved biocompatibility by the FDA. (Further milestones will be detailed in the full report)
In-Depth Medical Devices Cuffs Market Outlook
The medical devices cuffs market is poised for continued growth, driven by technological advancements, expanding healthcare infrastructure, and the increasing prevalence of respiratory diseases. Strategic partnerships, market expansion initiatives, and the development of innovative products will further fuel market expansion. The long-term outlook is positive, with significant opportunities for market participants to capitalize on the growing demand for advanced respiratory support technologies.
Medical Devices Cuffs Segmentation
-
1. Application
- 1.1. Hospitals
- 1.2. Clinics
- 1.3. Ambulatory Surgery Centers
- 1.4. Others
-
2. Types
- 2.1. Blood Pressure Cuffs
- 2.2. Cuffed Endotracheal Tube
- 2.3. Tracheostomy Tube
Medical Devices Cuffs Segmentation By Geography
-
1. North America
- 1.1. United States
- 1.2. Canada
- 1.3. Mexico
-
2. South America
- 2.1. Brazil
- 2.2. Argentina
- 2.3. Rest of South America
-
3. Europe
- 3.1. United Kingdom
- 3.2. Germany
- 3.3. France
- 3.4. Italy
- 3.5. Spain
- 3.6. Russia
- 3.7. Benelux
- 3.8. Nordics
- 3.9. Rest of Europe
-
4. Middle East & Africa
- 4.1. Turkey
- 4.2. Israel
- 4.3. GCC
- 4.4. North Africa
- 4.5. South Africa
- 4.6. Rest of Middle East & Africa
-
5. Asia Pacific
- 5.1. China
- 5.2. India
- 5.3. Japan
- 5.4. South Korea
- 5.5. ASEAN
- 5.6. Oceania
- 5.7. Rest of Asia Pacific
Medical Devices Cuffs Regional Market Share
Geographic Coverage of Medical Devices Cuffs
Medical Devices Cuffs REPORT HIGHLIGHTS
| Aspects | Details |
|---|---|
| Study Period | 2020-2034 |
| Base Year | 2025 |
| Estimated Year | 2026 |
| Forecast Period | 2026-2034 |
| Historical Period | 2020-2025 |
| Growth Rate | CAGR of 4.25% from 2020-2034 |
| Segmentation |
|
Table of Contents
- 1. Introduction
- 1.1. Research Scope
- 1.2. Market Segmentation
- 1.3. Research Objective
- 1.4. Definitions and Assumptions
- 2. Executive Summary
- 2.1. Market Snapshot
- 3. Market Dynamics
- 3.1. Market Drivers
- 3.2. Market Restrains
- 3.3. Market Trends
- 3.4. Market Opportunities
- 4. Market Factor Analysis
- 4.1. Porters Five Forces
- 4.1.1. Bargaining Power of Suppliers
- 4.1.2. Bargaining Power of Buyers
- 4.1.3. Threat of New Entrants
- 4.1.4. Threat of Substitutes
- 4.1.5. Competitive Rivalry
- 4.2. PESTEL analysis
- 4.3. BCG Analysis
- 4.3.1. Stars (High Growth, High Market Share)
- 4.3.2. Cash Cows (Low Growth, High Market Share)
- 4.3.3. Question Mark (High Growth, Low Market Share)
- 4.3.4. Dogs (Low Growth, Low Market Share)
- 4.4. Ansoff Matrix Analysis
- 4.5. Supply Chain Analysis
- 4.6. Regulatory Landscape
- 4.7. Current Market Potential and Opportunity Assessment (TAM–SAM–SOM Framework)
- 4.8. NRP Analyst Note
- 4.1. Porters Five Forces
- 5. Market Analysis, Insights and Forecast 2021-2033
- 5.1. Market Analysis, Insights and Forecast - by Application
- 5.1.1. Hospitals
- 5.1.2. Clinics
- 5.1.3. Ambulatory Surgery Centers
- 5.1.4. Others
- 5.2. Market Analysis, Insights and Forecast - by Types
- 5.2.1. Blood Pressure Cuffs
- 5.2.2. Cuffed Endotracheal Tube
- 5.2.3. Tracheostomy Tube
- 5.3. Market Analysis, Insights and Forecast - by Region
- 5.3.1. North America
- 5.3.2. South America
- 5.3.3. Europe
- 5.3.4. Middle East & Africa
- 5.3.5. Asia Pacific
- 5.1. Market Analysis, Insights and Forecast - by Application
- 6. Global Medical Devices Cuffs Analysis, Insights and Forecast, 2021-2033
- 6.1. Market Analysis, Insights and Forecast - by Application
- 6.1.1. Hospitals
- 6.1.2. Clinics
- 6.1.3. Ambulatory Surgery Centers
- 6.1.4. Others
- 6.2. Market Analysis, Insights and Forecast - by Types
- 6.2.1. Blood Pressure Cuffs
- 6.2.2. Cuffed Endotracheal Tube
- 6.2.3. Tracheostomy Tube
- 6.1. Market Analysis, Insights and Forecast - by Application
- 7. North America Medical Devices Cuffs Analysis, Insights and Forecast, 2020-2032
- 7.1. Market Analysis, Insights and Forecast - by Application
- 7.1.1. Hospitals
- 7.1.2. Clinics
- 7.1.3. Ambulatory Surgery Centers
- 7.1.4. Others
- 7.2. Market Analysis, Insights and Forecast - by Types
- 7.2.1. Blood Pressure Cuffs
- 7.2.2. Cuffed Endotracheal Tube
- 7.2.3. Tracheostomy Tube
- 7.1. Market Analysis, Insights and Forecast - by Application
- 8. South America Medical Devices Cuffs Analysis, Insights and Forecast, 2020-2032
- 8.1. Market Analysis, Insights and Forecast - by Application
- 8.1.1. Hospitals
- 8.1.2. Clinics
- 8.1.3. Ambulatory Surgery Centers
- 8.1.4. Others
- 8.2. Market Analysis, Insights and Forecast - by Types
- 8.2.1. Blood Pressure Cuffs
- 8.2.2. Cuffed Endotracheal Tube
- 8.2.3. Tracheostomy Tube
- 8.1. Market Analysis, Insights and Forecast - by Application
- 9. Europe Medical Devices Cuffs Analysis, Insights and Forecast, 2020-2032
- 9.1. Market Analysis, Insights and Forecast - by Application
- 9.1.1. Hospitals
- 9.1.2. Clinics
- 9.1.3. Ambulatory Surgery Centers
- 9.1.4. Others
- 9.2. Market Analysis, Insights and Forecast - by Types
- 9.2.1. Blood Pressure Cuffs
- 9.2.2. Cuffed Endotracheal Tube
- 9.2.3. Tracheostomy Tube
- 9.1. Market Analysis, Insights and Forecast - by Application
- 10. Middle East & Africa Medical Devices Cuffs Analysis, Insights and Forecast, 2020-2032
- 10.1. Market Analysis, Insights and Forecast - by Application
- 10.1.1. Hospitals
- 10.1.2. Clinics
- 10.1.3. Ambulatory Surgery Centers
- 10.1.4. Others
- 10.2. Market Analysis, Insights and Forecast - by Types
- 10.2.1. Blood Pressure Cuffs
- 10.2.2. Cuffed Endotracheal Tube
- 10.2.3. Tracheostomy Tube
- 10.1. Market Analysis, Insights and Forecast - by Application
- 11. Asia Pacific Medical Devices Cuffs Analysis, Insights and Forecast, 2020-2032
- 11.1. Market Analysis, Insights and Forecast - by Application
- 11.1.1. Hospitals
- 11.1.2. Clinics
- 11.1.3. Ambulatory Surgery Centers
- 11.1.4. Others
- 11.2. Market Analysis, Insights and Forecast - by Types
- 11.2.1. Blood Pressure Cuffs
- 11.2.2. Cuffed Endotracheal Tube
- 11.2.3. Tracheostomy Tube
- 11.1. Market Analysis, Insights and Forecast - by Application
- 12. Competitive Analysis
- 12.1. Company Profiles
- 12.1.1 Medtronic
- 12.1.1.1. Company Overview
- 12.1.1.2. Products
- 12.1.1.3. Company Financials
- 12.1.1.4. SWOT Analysis
- 12.1.2 Smiths Medical
- 12.1.2.1. Company Overview
- 12.1.2.2. Products
- 12.1.2.3. Company Financials
- 12.1.2.4. SWOT Analysis
- 12.1.3 Teleflex Incorporated
- 12.1.3.1. Company Overview
- 12.1.3.2. Products
- 12.1.3.3. Company Financials
- 12.1.3.4. SWOT Analysis
- 12.1.4 ConvaTec Inc.
- 12.1.4.1. Company Overview
- 12.1.4.2. Products
- 12.1.4.3. Company Financials
- 12.1.4.4. SWOT Analysis
- 12.1.5 Cook Medical
- 12.1.5.1. Company Overview
- 12.1.5.2. Products
- 12.1.5.3. Company Financials
- 12.1.5.4. SWOT Analysis
- 12.1.6 Troge Medical GmbH
- 12.1.6.1. Company Overview
- 12.1.6.2. Products
- 12.1.6.3. Company Financials
- 12.1.6.4. SWOT Analysis
- 12.1.7 Fuji Systems
- 12.1.7.1. Company Overview
- 12.1.7.2. Products
- 12.1.7.3. Company Financials
- 12.1.7.4. SWOT Analysis
- 12.1.8 Well Lead Medical Co. Ltd.
- 12.1.8.1. Company Overview
- 12.1.8.2. Products
- 12.1.8.3. Company Financials
- 12.1.8.4. SWOT Analysis
- 12.1.9 TRACOE medical GmbH
- 12.1.9.1. Company Overview
- 12.1.9.2. Products
- 12.1.9.3. Company Financials
- 12.1.9.4. SWOT Analysis
- 12.1.10 Pulmodyne
- 12.1.10.1. Company Overview
- 12.1.10.2. Products
- 12.1.10.3. Company Financials
- 12.1.10.4. SWOT Analysis
- 12.1.11 Inc.
- 12.1.11.1. Company Overview
- 12.1.11.2. Products
- 12.1.11.3. Company Financials
- 12.1.11.4. SWOT Analysis
- 12.1.1 Medtronic
- 12.2. Market Entropy
- 12.2.1 Company's Key Areas Served
- 12.2.2 Recent Developments
- 12.3. Company Market Share Analysis 2025
- 12.3.1 Top 5 Companies Market Share Analysis
- 12.3.2 Top 3 Companies Market Share Analysis
- 12.4. List of Potential Customers
- 13. Research Methodology
List of Figures
- Figure 1: Global Medical Devices Cuffs Revenue Breakdown (million, %) by Region 2025 & 2033
- Figure 2: Global Medical Devices Cuffs Volume Breakdown (K, %) by Region 2025 & 2033
- Figure 3: North America Medical Devices Cuffs Revenue (million), by Application 2025 & 2033
- Figure 4: North America Medical Devices Cuffs Volume (K), by Application 2025 & 2033
- Figure 5: North America Medical Devices Cuffs Revenue Share (%), by Application 2025 & 2033
- Figure 6: North America Medical Devices Cuffs Volume Share (%), by Application 2025 & 2033
- Figure 7: North America Medical Devices Cuffs Revenue (million), by Types 2025 & 2033
- Figure 8: North America Medical Devices Cuffs Volume (K), by Types 2025 & 2033
- Figure 9: North America Medical Devices Cuffs Revenue Share (%), by Types 2025 & 2033
- Figure 10: North America Medical Devices Cuffs Volume Share (%), by Types 2025 & 2033
- Figure 11: North America Medical Devices Cuffs Revenue (million), by Country 2025 & 2033
- Figure 12: North America Medical Devices Cuffs Volume (K), by Country 2025 & 2033
- Figure 13: North America Medical Devices Cuffs Revenue Share (%), by Country 2025 & 2033
- Figure 14: North America Medical Devices Cuffs Volume Share (%), by Country 2025 & 2033
- Figure 15: South America Medical Devices Cuffs Revenue (million), by Application 2025 & 2033
- Figure 16: South America Medical Devices Cuffs Volume (K), by Application 2025 & 2033
- Figure 17: South America Medical Devices Cuffs Revenue Share (%), by Application 2025 & 2033
- Figure 18: South America Medical Devices Cuffs Volume Share (%), by Application 2025 & 2033
- Figure 19: South America Medical Devices Cuffs Revenue (million), by Types 2025 & 2033
- Figure 20: South America Medical Devices Cuffs Volume (K), by Types 2025 & 2033
- Figure 21: South America Medical Devices Cuffs Revenue Share (%), by Types 2025 & 2033
- Figure 22: South America Medical Devices Cuffs Volume Share (%), by Types 2025 & 2033
- Figure 23: South America Medical Devices Cuffs Revenue (million), by Country 2025 & 2033
- Figure 24: South America Medical Devices Cuffs Volume (K), by Country 2025 & 2033
- Figure 25: South America Medical Devices Cuffs Revenue Share (%), by Country 2025 & 2033
- Figure 26: South America Medical Devices Cuffs Volume Share (%), by Country 2025 & 2033
- Figure 27: Europe Medical Devices Cuffs Revenue (million), by Application 2025 & 2033
- Figure 28: Europe Medical Devices Cuffs Volume (K), by Application 2025 & 2033
- Figure 29: Europe Medical Devices Cuffs Revenue Share (%), by Application 2025 & 2033
- Figure 30: Europe Medical Devices Cuffs Volume Share (%), by Application 2025 & 2033
- Figure 31: Europe Medical Devices Cuffs Revenue (million), by Types 2025 & 2033
- Figure 32: Europe Medical Devices Cuffs Volume (K), by Types 2025 & 2033
- Figure 33: Europe Medical Devices Cuffs Revenue Share (%), by Types 2025 & 2033
- Figure 34: Europe Medical Devices Cuffs Volume Share (%), by Types 2025 & 2033
- Figure 35: Europe Medical Devices Cuffs Revenue (million), by Country 2025 & 2033
- Figure 36: Europe Medical Devices Cuffs Volume (K), by Country 2025 & 2033
- Figure 37: Europe Medical Devices Cuffs Revenue Share (%), by Country 2025 & 2033
- Figure 38: Europe Medical Devices Cuffs Volume Share (%), by Country 2025 & 2033
- Figure 39: Middle East & Africa Medical Devices Cuffs Revenue (million), by Application 2025 & 2033
- Figure 40: Middle East & Africa Medical Devices Cuffs Volume (K), by Application 2025 & 2033
- Figure 41: Middle East & Africa Medical Devices Cuffs Revenue Share (%), by Application 2025 & 2033
- Figure 42: Middle East & Africa Medical Devices Cuffs Volume Share (%), by Application 2025 & 2033
- Figure 43: Middle East & Africa Medical Devices Cuffs Revenue (million), by Types 2025 & 2033
- Figure 44: Middle East & Africa Medical Devices Cuffs Volume (K), by Types 2025 & 2033
- Figure 45: Middle East & Africa Medical Devices Cuffs Revenue Share (%), by Types 2025 & 2033
- Figure 46: Middle East & Africa Medical Devices Cuffs Volume Share (%), by Types 2025 & 2033
- Figure 47: Middle East & Africa Medical Devices Cuffs Revenue (million), by Country 2025 & 2033
- Figure 48: Middle East & Africa Medical Devices Cuffs Volume (K), by Country 2025 & 2033
- Figure 49: Middle East & Africa Medical Devices Cuffs Revenue Share (%), by Country 2025 & 2033
- Figure 50: Middle East & Africa Medical Devices Cuffs Volume Share (%), by Country 2025 & 2033
- Figure 51: Asia Pacific Medical Devices Cuffs Revenue (million), by Application 2025 & 2033
- Figure 52: Asia Pacific Medical Devices Cuffs Volume (K), by Application 2025 & 2033
- Figure 53: Asia Pacific Medical Devices Cuffs Revenue Share (%), by Application 2025 & 2033
- Figure 54: Asia Pacific Medical Devices Cuffs Volume Share (%), by Application 2025 & 2033
- Figure 55: Asia Pacific Medical Devices Cuffs Revenue (million), by Types 2025 & 2033
- Figure 56: Asia Pacific Medical Devices Cuffs Volume (K), by Types 2025 & 2033
- Figure 57: Asia Pacific Medical Devices Cuffs Revenue Share (%), by Types 2025 & 2033
- Figure 58: Asia Pacific Medical Devices Cuffs Volume Share (%), by Types 2025 & 2033
- Figure 59: Asia Pacific Medical Devices Cuffs Revenue (million), by Country 2025 & 2033
- Figure 60: Asia Pacific Medical Devices Cuffs Volume (K), by Country 2025 & 2033
- Figure 61: Asia Pacific Medical Devices Cuffs Revenue Share (%), by Country 2025 & 2033
- Figure 62: Asia Pacific Medical Devices Cuffs Volume Share (%), by Country 2025 & 2033
List of Tables
- Table 1: Global Medical Devices Cuffs Revenue million Forecast, by Application 2020 & 2033
- Table 2: Global Medical Devices Cuffs Volume K Forecast, by Application 2020 & 2033
- Table 3: Global Medical Devices Cuffs Revenue million Forecast, by Types 2020 & 2033
- Table 4: Global Medical Devices Cuffs Volume K Forecast, by Types 2020 & 2033
- Table 5: Global Medical Devices Cuffs Revenue million Forecast, by Region 2020 & 2033
- Table 6: Global Medical Devices Cuffs Volume K Forecast, by Region 2020 & 2033
- Table 7: Global Medical Devices Cuffs Revenue million Forecast, by Application 2020 & 2033
- Table 8: Global Medical Devices Cuffs Volume K Forecast, by Application 2020 & 2033
- Table 9: Global Medical Devices Cuffs Revenue million Forecast, by Types 2020 & 2033
- Table 10: Global Medical Devices Cuffs Volume K Forecast, by Types 2020 & 2033
- Table 11: Global Medical Devices Cuffs Revenue million Forecast, by Country 2020 & 2033
- Table 12: Global Medical Devices Cuffs Volume K Forecast, by Country 2020 & 2033
- Table 13: United States Medical Devices Cuffs Revenue (million) Forecast, by Application 2020 & 2033
- Table 14: United States Medical Devices Cuffs Volume (K) Forecast, by Application 2020 & 2033
- Table 15: Canada Medical Devices Cuffs Revenue (million) Forecast, by Application 2020 & 2033
- Table 16: Canada Medical Devices Cuffs Volume (K) Forecast, by Application 2020 & 2033
- Table 17: Mexico Medical Devices Cuffs Revenue (million) Forecast, by Application 2020 & 2033
- Table 18: Mexico Medical Devices Cuffs Volume (K) Forecast, by Application 2020 & 2033
- Table 19: Global Medical Devices Cuffs Revenue million Forecast, by Application 2020 & 2033
- Table 20: Global Medical Devices Cuffs Volume K Forecast, by Application 2020 & 2033
- Table 21: Global Medical Devices Cuffs Revenue million Forecast, by Types 2020 & 2033
- Table 22: Global Medical Devices Cuffs Volume K Forecast, by Types 2020 & 2033
- Table 23: Global Medical Devices Cuffs Revenue million Forecast, by Country 2020 & 2033
- Table 24: Global Medical Devices Cuffs Volume K Forecast, by Country 2020 & 2033
- Table 25: Brazil Medical Devices Cuffs Revenue (million) Forecast, by Application 2020 & 2033
- Table 26: Brazil Medical Devices Cuffs Volume (K) Forecast, by Application 2020 & 2033
- Table 27: Argentina Medical Devices Cuffs Revenue (million) Forecast, by Application 2020 & 2033
- Table 28: Argentina Medical Devices Cuffs Volume (K) Forecast, by Application 2020 & 2033
- Table 29: Rest of South America Medical Devices Cuffs Revenue (million) Forecast, by Application 2020 & 2033
- Table 30: Rest of South America Medical Devices Cuffs Volume (K) Forecast, by Application 2020 & 2033
- Table 31: Global Medical Devices Cuffs Revenue million Forecast, by Application 2020 & 2033
- Table 32: Global Medical Devices Cuffs Volume K Forecast, by Application 2020 & 2033
- Table 33: Global Medical Devices Cuffs Revenue million Forecast, by Types 2020 & 2033
- Table 34: Global Medical Devices Cuffs Volume K Forecast, by Types 2020 & 2033
- Table 35: Global Medical Devices Cuffs Revenue million Forecast, by Country 2020 & 2033
- Table 36: Global Medical Devices Cuffs Volume K Forecast, by Country 2020 & 2033
- Table 37: United Kingdom Medical Devices Cuffs Revenue (million) Forecast, by Application 2020 & 2033
- Table 38: United Kingdom Medical Devices Cuffs Volume (K) Forecast, by Application 2020 & 2033
- Table 39: Germany Medical Devices Cuffs Revenue (million) Forecast, by Application 2020 & 2033
- Table 40: Germany Medical Devices Cuffs Volume (K) Forecast, by Application 2020 & 2033
- Table 41: France Medical Devices Cuffs Revenue (million) Forecast, by Application 2020 & 2033
- Table 42: France Medical Devices Cuffs Volume (K) Forecast, by Application 2020 & 2033
- Table 43: Italy Medical Devices Cuffs Revenue (million) Forecast, by Application 2020 & 2033
- Table 44: Italy Medical Devices Cuffs Volume (K) Forecast, by Application 2020 & 2033
- Table 45: Spain Medical Devices Cuffs Revenue (million) Forecast, by Application 2020 & 2033
- Table 46: Spain Medical Devices Cuffs Volume (K) Forecast, by Application 2020 & 2033
- Table 47: Russia Medical Devices Cuffs Revenue (million) Forecast, by Application 2020 & 2033
- Table 48: Russia Medical Devices Cuffs Volume (K) Forecast, by Application 2020 & 2033
- Table 49: Benelux Medical Devices Cuffs Revenue (million) Forecast, by Application 2020 & 2033
- Table 50: Benelux Medical Devices Cuffs Volume (K) Forecast, by Application 2020 & 2033
- Table 51: Nordics Medical Devices Cuffs Revenue (million) Forecast, by Application 2020 & 2033
- Table 52: Nordics Medical Devices Cuffs Volume (K) Forecast, by Application 2020 & 2033
- Table 53: Rest of Europe Medical Devices Cuffs Revenue (million) Forecast, by Application 2020 & 2033
- Table 54: Rest of Europe Medical Devices Cuffs Volume (K) Forecast, by Application 2020 & 2033
- Table 55: Global Medical Devices Cuffs Revenue million Forecast, by Application 2020 & 2033
- Table 56: Global Medical Devices Cuffs Volume K Forecast, by Application 2020 & 2033
- Table 57: Global Medical Devices Cuffs Revenue million Forecast, by Types 2020 & 2033
- Table 58: Global Medical Devices Cuffs Volume K Forecast, by Types 2020 & 2033
- Table 59: Global Medical Devices Cuffs Revenue million Forecast, by Country 2020 & 2033
- Table 60: Global Medical Devices Cuffs Volume K Forecast, by Country 2020 & 2033
- Table 61: Turkey Medical Devices Cuffs Revenue (million) Forecast, by Application 2020 & 2033
- Table 62: Turkey Medical Devices Cuffs Volume (K) Forecast, by Application 2020 & 2033
- Table 63: Israel Medical Devices Cuffs Revenue (million) Forecast, by Application 2020 & 2033
- Table 64: Israel Medical Devices Cuffs Volume (K) Forecast, by Application 2020 & 2033
- Table 65: GCC Medical Devices Cuffs Revenue (million) Forecast, by Application 2020 & 2033
- Table 66: GCC Medical Devices Cuffs Volume (K) Forecast, by Application 2020 & 2033
- Table 67: North Africa Medical Devices Cuffs Revenue (million) Forecast, by Application 2020 & 2033
- Table 68: North Africa Medical Devices Cuffs Volume (K) Forecast, by Application 2020 & 2033
- Table 69: South Africa Medical Devices Cuffs Revenue (million) Forecast, by Application 2020 & 2033
- Table 70: South Africa Medical Devices Cuffs Volume (K) Forecast, by Application 2020 & 2033
- Table 71: Rest of Middle East & Africa Medical Devices Cuffs Revenue (million) Forecast, by Application 2020 & 2033
- Table 72: Rest of Middle East & Africa Medical Devices Cuffs Volume (K) Forecast, by Application 2020 & 2033
- Table 73: Global Medical Devices Cuffs Revenue million Forecast, by Application 2020 & 2033
- Table 74: Global Medical Devices Cuffs Volume K Forecast, by Application 2020 & 2033
- Table 75: Global Medical Devices Cuffs Revenue million Forecast, by Types 2020 & 2033
- Table 76: Global Medical Devices Cuffs Volume K Forecast, by Types 2020 & 2033
- Table 77: Global Medical Devices Cuffs Revenue million Forecast, by Country 2020 & 2033
- Table 78: Global Medical Devices Cuffs Volume K Forecast, by Country 2020 & 2033
- Table 79: China Medical Devices Cuffs Revenue (million) Forecast, by Application 2020 & 2033
- Table 80: China Medical Devices Cuffs Volume (K) Forecast, by Application 2020 & 2033
- Table 81: India Medical Devices Cuffs Revenue (million) Forecast, by Application 2020 & 2033
- Table 82: India Medical Devices Cuffs Volume (K) Forecast, by Application 2020 & 2033
- Table 83: Japan Medical Devices Cuffs Revenue (million) Forecast, by Application 2020 & 2033
- Table 84: Japan Medical Devices Cuffs Volume (K) Forecast, by Application 2020 & 2033
- Table 85: South Korea Medical Devices Cuffs Revenue (million) Forecast, by Application 2020 & 2033
- Table 86: South Korea Medical Devices Cuffs Volume (K) Forecast, by Application 2020 & 2033
- Table 87: ASEAN Medical Devices Cuffs Revenue (million) Forecast, by Application 2020 & 2033
- Table 88: ASEAN Medical Devices Cuffs Volume (K) Forecast, by Application 2020 & 2033
- Table 89: Oceania Medical Devices Cuffs Revenue (million) Forecast, by Application 2020 & 2033
- Table 90: Oceania Medical Devices Cuffs Volume (K) Forecast, by Application 2020 & 2033
- Table 91: Rest of Asia Pacific Medical Devices Cuffs Revenue (million) Forecast, by Application 2020 & 2033
- Table 92: Rest of Asia Pacific Medical Devices Cuffs Volume (K) Forecast, by Application 2020 & 2033
Frequently Asked Questions
1. What is the projected Compound Annual Growth Rate (CAGR) of the Medical Devices Cuffs?
The projected CAGR is approximately 4.25%.
2. Which companies are prominent players in the Medical Devices Cuffs?
Key companies in the market include Medtronic, Smiths Medical, Teleflex Incorporated, ConvaTec Inc., Cook Medical, Troge Medical GmbH, Fuji Systems, Well Lead Medical Co. Ltd., TRACOE medical GmbH, Pulmodyne, Inc..
3. What are the main segments of the Medical Devices Cuffs?
The market segments include Application, Types.
4. Can you provide details about the market size?
The market size is estimated to be USD 871.68 million as of 2022.
5. What are some drivers contributing to market growth?
N/A
6. What are the notable trends driving market growth?
N/A
7. Are there any restraints impacting market growth?
N/A
8. Can you provide examples of recent developments in the market?
N/A
9. What pricing options are available for accessing the report?
Pricing options include single-user, multi-user, and enterprise licenses priced at USD 3950.00, USD 5925.00, and USD 7900.00 respectively.
10. Is the market size provided in terms of value or volume?
The market size is provided in terms of value, measured in million and volume, measured in K.
11. Are there any specific market keywords associated with the report?
Yes, the market keyword associated with the report is "Medical Devices Cuffs," which aids in identifying and referencing the specific market segment covered.
12. How do I determine which pricing option suits my needs best?
The pricing options vary based on user requirements and access needs. Individual users may opt for single-user licenses, while businesses requiring broader access may choose multi-user or enterprise licenses for cost-effective access to the report.
13. Are there any additional resources or data provided in the Medical Devices Cuffs report?
While the report offers comprehensive insights, it's advisable to review the specific contents or supplementary materials provided to ascertain if additional resources or data are available.
14. How can I stay updated on further developments or reports in the Medical Devices Cuffs?
To stay informed about further developments, trends, and reports in the Medical Devices Cuffs, consider subscribing to industry newsletters, following relevant companies and organizations, or regularly checking reputable industry news sources and publications.
Methodology
Step 1 - Identification of Relevant Samples Size from Population Database


Step 2 - Approaches for Defining Global Market Size (Value, Volume* & Price*)

Note*: In applicable scenarios
Step 3 - Data Sources
Primary Research
- Web Analytics
- Survey Reports
- Research Institute
- Latest Research Reports
- Opinion Leaders
Secondary Research
- Annual Reports
- White Paper
- Latest Press Release
- Industry Association
- Paid Database
- Investor Presentations

Step 4 - Data Triangulation
Involves using different sources of information in order to increase the validity of a study
These sources are likely to be stakeholders in a program - participants, other researchers, program staff, other community members, and so on.
Then we put all data in single framework & apply various statistical tools to find out the dynamic on the market.
During the analysis stage, feedback from the stakeholder groups would be compared to determine areas of agreement as well as areas of divergence