

Key Insights
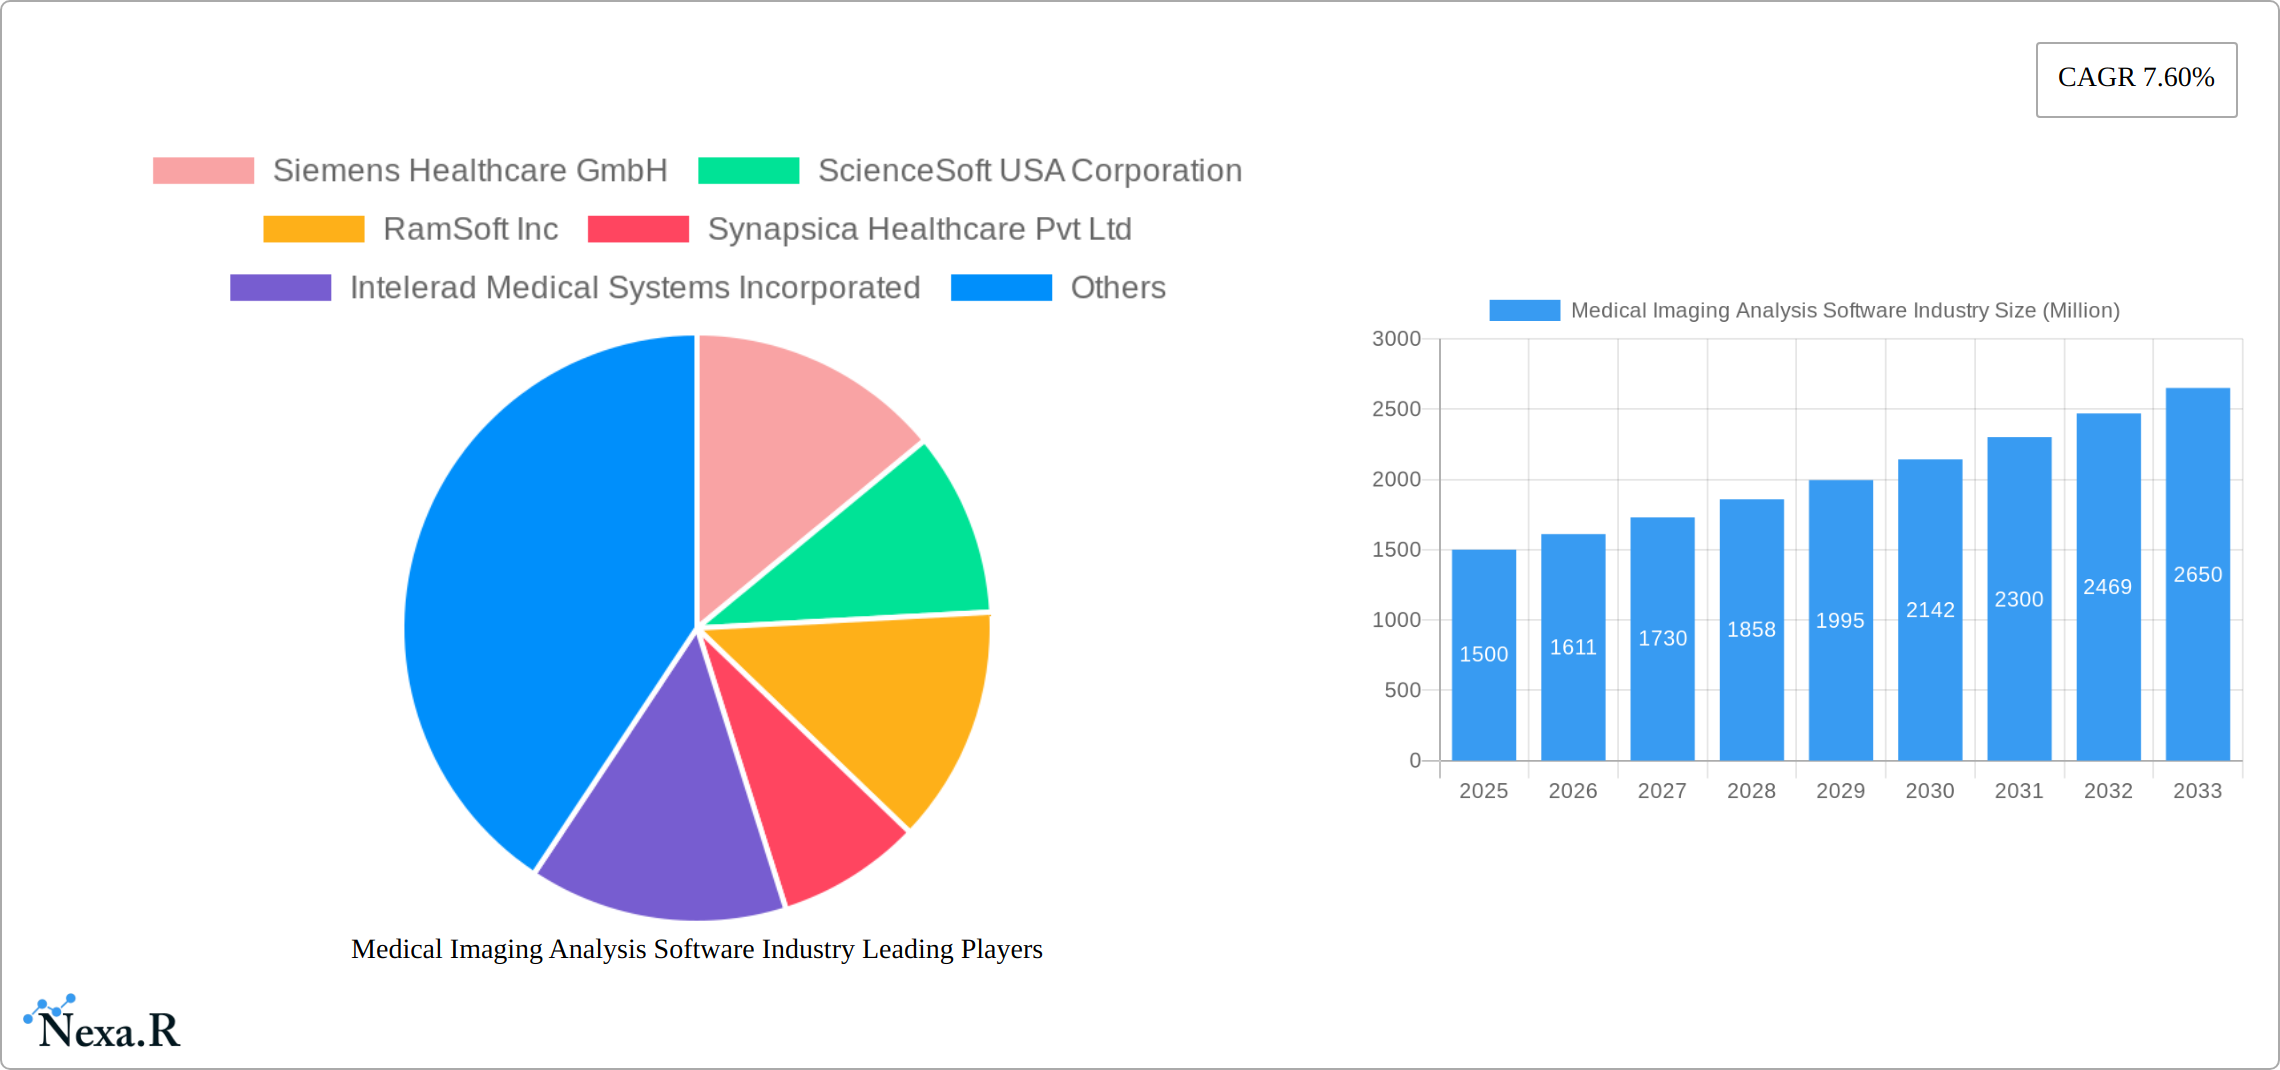
The medical imaging analysis software market is experiencing robust growth, projected to reach a significant size by 2033, driven by a 7.60% CAGR. This expansion is fueled by several key factors. The increasing prevalence of chronic diseases necessitates more sophisticated diagnostic tools, leading to higher demand for software that can efficiently analyze medical images such as X-rays, MRIs, and ultrasounds. Technological advancements, particularly in artificial intelligence (AI) and machine learning (ML), are enhancing the accuracy and speed of image analysis, further boosting market growth. The integration of these technologies allows for faster diagnosis, improved treatment planning, and ultimately, better patient outcomes. Furthermore, the rising adoption of cloud-based solutions is facilitating remote access to imaging data and analysis, expanding the reach of these software solutions across geographical boundaries and healthcare settings. The market is segmented by image type (2D, 3D, 4D), modality (tomography, ultrasound, radiographic, X-ray, MRI, others), software type (integrated, standalone), and end-user (hospitals, diagnostic centers, research centers). The competitive landscape is populated by major players like Siemens Healthcare, GE Healthcare, Philips, and IBM, alongside several specialized software developers. The North American market currently holds a significant share, but growth is expected across all regions, particularly in Asia-Pacific due to increasing healthcare infrastructure development and rising disposable incomes. However, high implementation costs, data security concerns, and the need for skilled professionals to interpret the analysis are potential restraints to market expansion.
The diverse range of software functionalities, from basic image viewing and manipulation to advanced AI-powered diagnostic tools, caters to a wide spectrum of healthcare providers. The shift towards value-based care is also influencing market trends, as healthcare systems prioritize cost-effectiveness and improved efficiency. This trend favors the adoption of medical imaging analysis software that streamlines workflows, reduces operational costs, and improves diagnostic accuracy. The ongoing development and refinement of AI algorithms tailored to specific imaging modalities and disease areas will continue to be a major driver of innovation and market expansion in the coming years. The competitive landscape is likely to remain dynamic, with continuous innovation, mergers, and acquisitions shaping the market structure. Regulatory approvals and data privacy regulations will continue to play a critical role in the market's trajectory. Overall, the outlook for the medical imaging analysis software market remains positive, with significant opportunities for growth and innovation in the years to come.
Medical Imaging Analysis Software Market Report: 2019-2033
This comprehensive report provides a detailed analysis of the Medical Imaging Analysis Software market, encompassing its dynamics, growth trends, regional segmentation, product landscape, key players, and future outlook. The study period covers 2019-2033, with a base year of 2025 and a forecast period of 2025-2033. The report segments the market by image type (2D, 3D, 4D), modality (Tomography, Ultrasound Imaging, Radiographic Imaging, X-ray Imaging, MRI, Other), software type (Integrated, Standalone), and end-user (Hospital, Diagnostic Center, Research Center). The report values are presented in million units.
Medical Imaging Analysis Software Industry Market Dynamics & Structure
The medical imaging analysis software market is characterized by a moderately concentrated landscape, with key players like Siemens Healthineers and GE Healthcare holding significant market share. Technological innovation, driven by advancements in artificial intelligence (AI), deep learning, and cloud computing, is a primary growth driver. Stringent regulatory frameworks governing medical software development and deployment impact market entry and expansion. Competitive product substitutes, such as traditional image analysis methods, pose a challenge, while the increasing adoption of digital healthcare and telemedicine creates new opportunities. The end-user demographic is expanding with the aging global population and rising prevalence of chronic diseases. Mergers and acquisitions (M&A) activity, exemplified by Canon Medical Systems' acquisition of Nordisk Rontgen Teknik, is reshaping the competitive landscape.
- Market Concentration: Moderately concentrated, with top 5 players holding xx% market share in 2024.
- Technological Innovation: AI, deep learning, and cloud computing are key drivers.
- Regulatory Framework: Stringent regulations influence market entry and expansion.
- M&A Activity: xx deals recorded between 2019 and 2024, indicating significant consolidation.
- Competitive Landscape: Intense competition among established players and emerging startups.
Medical Imaging Analysis Software Industry Growth Trends & Insights
The medical imaging analysis software market is experiencing robust growth, fueled by the escalating demand for precise and efficient diagnostic tools. This market, valued at xx million units in 2024, is projected to reach xx million units by 2033, demonstrating a CAGR of xx% throughout the forecast period. Adoption is surging, especially within developed nations boasting advanced healthcare infrastructure. This expansion is significantly driven by transformative technological advancements, including the integration of artificial intelligence (AI) and cloud-based solutions. Furthermore, evolving consumer preferences favor user-friendly, integrated software that streamlines workflows and accelerates diagnostic turnaround times. Market penetration is poised to increase from xx% in 2024 to xx% in 2033, reflecting this significant upward trend.
Dominant Regions, Countries, or Segments in Medical Imaging Analysis Software Industry
North America currently dominates the medical imaging analysis software market, driven by high healthcare spending, advanced infrastructure, and early adoption of new technologies. Within North America, the United States holds the largest market share. The MRI modality segment shows the strongest growth potential, followed by X-ray imaging and ultrasound imaging. Hospitals remain the largest end-user segment, followed by diagnostic centers and research institutions. The integrated software type is more prevalent due to its comprehensive features and workflow integration. Europe and Asia-Pacific are also experiencing significant growth, driven by increasing healthcare expenditure and rising demand for improved diagnostic capabilities.
- Key Drivers in North America: High healthcare spending, advanced infrastructure, early adoption of new technologies.
- Strong Growth Segments: MRI, X-ray imaging, integrated software, hospital end-users.
- Emerging Markets: Asia-Pacific and Europe demonstrate strong growth potential.
Medical Imaging Analysis Software Industry Product Landscape
The medical imaging analysis software market presents a diverse array of products tailored to various imaging modalities and user requirements. Product innovation centers on AI-powered image enhancement, sophisticated visualization tools, and seamless integration with existing healthcare information systems (HIS). Key performance indicators (KPIs) encompass diagnostic accuracy, processing speed, and ease of use. Unique selling propositions frequently involve specialized algorithms for specific clinical applications and readily accessible cloud-based deployment. Recent technological breakthroughs include the implementation of deep learning for automated image analysis, resulting in enhanced diagnostic accuracy and improved efficiency for clinicians.
Key Drivers, Barriers & Challenges in Medical Imaging Analysis Software Industry
Key Drivers:
- Increasing demand for accurate and efficient diagnostic tools.
- Technological advancements in AI, deep learning, and cloud computing.
- Rising prevalence of chronic diseases requiring advanced imaging techniques.
- Government initiatives promoting digital healthcare transformation.
Challenges & Restraints:
- High cost of software and implementation.
- Data security and privacy concerns related to patient medical information.
- Lack of skilled professionals capable of using and interpreting AI-powered software.
- Regulatory hurdles in obtaining software approvals and certifications. This accounts for approximately xx% of the challenges faced by the industry.
Emerging Opportunities in Medical Imaging Analysis Software Industry
- Expanding Telehealth and Remote Diagnostics: The rise of telehealth creates significant opportunities for remote image analysis and diagnosis, expanding access to care.
- Specialized AI-Powered Software: The demand for AI solutions tailored to specific clinical needs (e.g., oncology, cardiology) is driving innovation and market growth.
- Penetration of Emerging Markets: Untapped markets in developing nations represent a substantial area for future expansion and improved healthcare access.
- Scalable Cloud-Based Solutions: Cloud-based platforms offer enhanced accessibility, scalability, and cost-effectiveness for healthcare providers.
- Improved Data Security and Privacy: Solutions addressing stringent data security and privacy regulations will be crucial for market adoption and trust.
Growth Accelerators in the Medical Imaging Analysis Software Industry Industry
Technological breakthroughs in AI and machine learning, coupled with strategic partnerships between software vendors and medical device manufacturers, are driving substantial long-term growth. Expansion into untapped markets, such as developing countries, represents a significant opportunity for market expansion. The adoption of innovative business models, such as Software-as-a-Service (SaaS), further enhances market penetration and revenue streams.
Key Players Shaping the Medical Imaging Analysis Software Market
- Siemens Healthcare GmbH
- ScienceSoft USA Corporation
- RamSoft Inc
- Synapsica Healthcare Pvt Ltd
- Intelerad Medical Systems Incorporated
- Carestream Health
- Xinapse Systems Ltd
- General Electric Company (GE Healthcare)
- Canon Inc (Canon Medical Systems USA)
- Koninklijke Philips NV
- International Business Machines Corporation (IBM)
- AQUILAB SAS
- Agfa-Gevaert Group
Notable Milestones in Medical Imaging Analysis Software Industry Sector
- July 2022: Siemens Healthineers integrates Subtle Medical's SubtleMR software into its Open Recon pipeline, enhancing MRI image quality.
- March 2022: Canon Medical Systems acquires Nordisk Rontgen Teknik, strengthening its X-ray business.
In-Depth Medical Imaging Analysis Software Industry Market Outlook
The medical imaging analysis software market is poised for sustained growth, fueled by continuous technological advancements and increasing demand for improved diagnostic capabilities. Strategic partnerships, market expansion into underserved regions, and the adoption of innovative business models will further propel market growth. The integration of AI and cloud technologies will continue to transform the industry, creating opportunities for new entrants and established players alike. The focus on improved user experience and enhanced diagnostic accuracy will remain paramount in shaping the future of the market.
Medical Imaging Analysis Software Industry Segmentation
-
1. Image Type
- 1.1. 2D Image
- 1.2. 3D Image
- 1.3. 4D Image
-
2. Modality
- 2.1. Tomography
- 2.2. Ultrasound Imaging
- 2.3. Radiographic Imaging
- 2.4. X-ray Imaging
- 2.5. Magnetic Resonance Imaging (MRI)
- 2.6. Other Modalities
-
3. Software Type
- 3.1. Integrated Software
- 3.2. Standalone Software
-
4. End User
- 4.1. Hospital
- 4.2. Diagnostic Center
- 4.3. Research Center
Medical Imaging Analysis Software Industry Segmentation By Geography
-
1. North America
- 1.1. United States
- 1.2. Canada
- 1.3. Mexico
-
2. Europe
- 2.1. Germany
- 2.2. United Kingdom
- 2.3. France
- 2.4. Italy
- 2.5. Spain
- 2.6. Rest of Europe
-
3. Asia Pacific
- 3.1. China
- 3.2. Japan
- 3.3. India
- 3.4. Australia
- 3.5. South Korea
- 3.6. Rest of Asia Pacific
-
4. Middle East and Africa
- 4.1. GCC
- 4.2. South Africa
- 4.3. Rest of Middle East and Africa
-
5. South America
- 5.1. Brazil
- 5.2. Argentina
- 5.3. Rest of South America

Medical Imaging Analysis Software Industry REPORT HIGHLIGHTS
| Aspects | Details |
|---|---|
| Study Period | 2019-2033 |
| Base Year | 2024 |
| Estimated Year | 2025 |
| Forecast Period | 2025-2033 |
| Historical Period | 2019-2024 |
| Growth Rate | CAGR of 7.60% from 2019-2033 |
| Segmentation |
|
Table of Contents
- 1. Introduction
- 1.1. Research Scope
- 1.2. Market Segmentation
- 1.3. Research Methodology
- 1.4. Definitions and Assumptions
- 2. Executive Summary
- 2.1. Introduction
- 3. Market Dynamics
- 3.1. Introduction
- 3.2. Market Drivers
- 3.2.1. Technological Advancements in Medical Imaging Systems and Analysis Software; Increasing Usage of Imaging Equipment Due to Rising Prevalence of Chronic Diseases; Rising Applications of Computer-aided Diagnosis
- 3.3. Market Restrains
- 3.3.1. Budgetary Constraints
- 3.4. Market Trends
- 3.4.1. The X-ray Imaging Segment is Expected to Witness Significant Growth Over the Forecast Period
- 4. Market Factor Analysis
- 4.1. Porters Five Forces
- 4.2. Supply/Value Chain
- 4.3. PESTEL analysis
- 4.4. Market Entropy
- 4.5. Patent/Trademark Analysis
- 5. Global Medical Imaging Analysis Software Industry Analysis, Insights and Forecast, 2019-2031
- 5.1. Market Analysis, Insights and Forecast - by Image Type
- 5.1.1. 2D Image
- 5.1.2. 3D Image
- 5.1.3. 4D Image
- 5.2. Market Analysis, Insights and Forecast - by Modality
- 5.2.1. Tomography
- 5.2.2. Ultrasound Imaging
- 5.2.3. Radiographic Imaging
- 5.2.4. X-ray Imaging
- 5.2.5. Magnetic Resonance Imaging (MRI)
- 5.2.6. Other Modalities
- 5.3. Market Analysis, Insights and Forecast - by Software Type
- 5.3.1. Integrated Software
- 5.3.2. Standalone Software
- 5.4. Market Analysis, Insights and Forecast - by End User
- 5.4.1. Hospital
- 5.4.2. Diagnostic Center
- 5.4.3. Research Center
- 5.5. Market Analysis, Insights and Forecast - by Region
- 5.5.1. North America
- 5.5.2. Europe
- 5.5.3. Asia Pacific
- 5.5.4. Middle East and Africa
- 5.5.5. South America
- 5.1. Market Analysis, Insights and Forecast - by Image Type
- 6. North America Medical Imaging Analysis Software Industry Analysis, Insights and Forecast, 2019-2031
- 6.1. Market Analysis, Insights and Forecast - by Image Type
- 6.1.1. 2D Image
- 6.1.2. 3D Image
- 6.1.3. 4D Image
- 6.2. Market Analysis, Insights and Forecast - by Modality
- 6.2.1. Tomography
- 6.2.2. Ultrasound Imaging
- 6.2.3. Radiographic Imaging
- 6.2.4. X-ray Imaging
- 6.2.5. Magnetic Resonance Imaging (MRI)
- 6.2.6. Other Modalities
- 6.3. Market Analysis, Insights and Forecast - by Software Type
- 6.3.1. Integrated Software
- 6.3.2. Standalone Software
- 6.4. Market Analysis, Insights and Forecast - by End User
- 6.4.1. Hospital
- 6.4.2. Diagnostic Center
- 6.4.3. Research Center
- 6.1. Market Analysis, Insights and Forecast - by Image Type
- 7. Europe Medical Imaging Analysis Software Industry Analysis, Insights and Forecast, 2019-2031
- 7.1. Market Analysis, Insights and Forecast - by Image Type
- 7.1.1. 2D Image
- 7.1.2. 3D Image
- 7.1.3. 4D Image
- 7.2. Market Analysis, Insights and Forecast - by Modality
- 7.2.1. Tomography
- 7.2.2. Ultrasound Imaging
- 7.2.3. Radiographic Imaging
- 7.2.4. X-ray Imaging
- 7.2.5. Magnetic Resonance Imaging (MRI)
- 7.2.6. Other Modalities
- 7.3. Market Analysis, Insights and Forecast - by Software Type
- 7.3.1. Integrated Software
- 7.3.2. Standalone Software
- 7.4. Market Analysis, Insights and Forecast - by End User
- 7.4.1. Hospital
- 7.4.2. Diagnostic Center
- 7.4.3. Research Center
- 7.1. Market Analysis, Insights and Forecast - by Image Type
- 8. Asia Pacific Medical Imaging Analysis Software Industry Analysis, Insights and Forecast, 2019-2031
- 8.1. Market Analysis, Insights and Forecast - by Image Type
- 8.1.1. 2D Image
- 8.1.2. 3D Image
- 8.1.3. 4D Image
- 8.2. Market Analysis, Insights and Forecast - by Modality
- 8.2.1. Tomography
- 8.2.2. Ultrasound Imaging
- 8.2.3. Radiographic Imaging
- 8.2.4. X-ray Imaging
- 8.2.5. Magnetic Resonance Imaging (MRI)
- 8.2.6. Other Modalities
- 8.3. Market Analysis, Insights and Forecast - by Software Type
- 8.3.1. Integrated Software
- 8.3.2. Standalone Software
- 8.4. Market Analysis, Insights and Forecast - by End User
- 8.4.1. Hospital
- 8.4.2. Diagnostic Center
- 8.4.3. Research Center
- 8.1. Market Analysis, Insights and Forecast - by Image Type
- 9. Middle East and Africa Medical Imaging Analysis Software Industry Analysis, Insights and Forecast, 2019-2031
- 9.1. Market Analysis, Insights and Forecast - by Image Type
- 9.1.1. 2D Image
- 9.1.2. 3D Image
- 9.1.3. 4D Image
- 9.2. Market Analysis, Insights and Forecast - by Modality
- 9.2.1. Tomography
- 9.2.2. Ultrasound Imaging
- 9.2.3. Radiographic Imaging
- 9.2.4. X-ray Imaging
- 9.2.5. Magnetic Resonance Imaging (MRI)
- 9.2.6. Other Modalities
- 9.3. Market Analysis, Insights and Forecast - by Software Type
- 9.3.1. Integrated Software
- 9.3.2. Standalone Software
- 9.4. Market Analysis, Insights and Forecast - by End User
- 9.4.1. Hospital
- 9.4.2. Diagnostic Center
- 9.4.3. Research Center
- 9.1. Market Analysis, Insights and Forecast - by Image Type
- 10. South America Medical Imaging Analysis Software Industry Analysis, Insights and Forecast, 2019-2031
- 10.1. Market Analysis, Insights and Forecast - by Image Type
- 10.1.1. 2D Image
- 10.1.2. 3D Image
- 10.1.3. 4D Image
- 10.2. Market Analysis, Insights and Forecast - by Modality
- 10.2.1. Tomography
- 10.2.2. Ultrasound Imaging
- 10.2.3. Radiographic Imaging
- 10.2.4. X-ray Imaging
- 10.2.5. Magnetic Resonance Imaging (MRI)
- 10.2.6. Other Modalities
- 10.3. Market Analysis, Insights and Forecast - by Software Type
- 10.3.1. Integrated Software
- 10.3.2. Standalone Software
- 10.4. Market Analysis, Insights and Forecast - by End User
- 10.4.1. Hospital
- 10.4.2. Diagnostic Center
- 10.4.3. Research Center
- 10.1. Market Analysis, Insights and Forecast - by Image Type
- 11. North America Medical Imaging Analysis Software Industry Analysis, Insights and Forecast, 2019-2031
- 11.1. Market Analysis, Insights and Forecast - By Country/Sub-region
- 11.1.1 United States
- 11.1.2 Canada
- 11.1.3 Mexico
- 12. Europe Medical Imaging Analysis Software Industry Analysis, Insights and Forecast, 2019-2031
- 12.1. Market Analysis, Insights and Forecast - By Country/Sub-region
- 12.1.1 Germany
- 12.1.2 United Kingdom
- 12.1.3 France
- 12.1.4 Italy
- 12.1.5 Spain
- 12.1.6 Rest of Europe
- 13. Asia Pacific Medical Imaging Analysis Software Industry Analysis, Insights and Forecast, 2019-2031
- 13.1. Market Analysis, Insights and Forecast - By Country/Sub-region
- 13.1.1 China
- 13.1.2 Japan
- 13.1.3 India
- 13.1.4 Australia
- 13.1.5 South Korea
- 13.1.6 Rest of Asia Pacific
- 14. Middle East and Africa Medical Imaging Analysis Software Industry Analysis, Insights and Forecast, 2019-2031
- 14.1. Market Analysis, Insights and Forecast - By Country/Sub-region
- 14.1.1 GCC
- 14.1.2 South Africa
- 14.1.3 Rest of Middle East and Africa
- 15. South America Medical Imaging Analysis Software Industry Analysis, Insights and Forecast, 2019-2031
- 15.1. Market Analysis, Insights and Forecast - By Country/Sub-region
- 15.1.1 Brazil
- 15.1.2 Argentina
- 15.1.3 Rest of South America
- 16. Competitive Analysis
- 16.1. Global Market Share Analysis 2024
- 16.2. Company Profiles
- 16.2.1 Siemens Healthcare GmbH
- 16.2.1.1. Overview
- 16.2.1.2. Products
- 16.2.1.3. SWOT Analysis
- 16.2.1.4. Recent Developments
- 16.2.1.5. Financials (Based on Availability)
- 16.2.2 ScienceSoft USA Corporation
- 16.2.2.1. Overview
- 16.2.2.2. Products
- 16.2.2.3. SWOT Analysis
- 16.2.2.4. Recent Developments
- 16.2.2.5. Financials (Based on Availability)
- 16.2.3 RamSoft Inc
- 16.2.3.1. Overview
- 16.2.3.2. Products
- 16.2.3.3. SWOT Analysis
- 16.2.3.4. Recent Developments
- 16.2.3.5. Financials (Based on Availability)
- 16.2.4 Synapsica Healthcare Pvt Ltd
- 16.2.4.1. Overview
- 16.2.4.2. Products
- 16.2.4.3. SWOT Analysis
- 16.2.4.4. Recent Developments
- 16.2.4.5. Financials (Based on Availability)
- 16.2.5 Intelerad Medical Systems Incorporated
- 16.2.5.1. Overview
- 16.2.5.2. Products
- 16.2.5.3. SWOT Analysis
- 16.2.5.4. Recent Developments
- 16.2.5.5. Financials (Based on Availability)
- 16.2.6 Carestream Health
- 16.2.6.1. Overview
- 16.2.6.2. Products
- 16.2.6.3. SWOT Analysis
- 16.2.6.4. Recent Developments
- 16.2.6.5. Financials (Based on Availability)
- 16.2.7 Xinapse Systems Ltd
- 16.2.7.1. Overview
- 16.2.7.2. Products
- 16.2.7.3. SWOT Analysis
- 16.2.7.4. Recent Developments
- 16.2.7.5. Financials (Based on Availability)
- 16.2.8 General Electric Company (GE Healthcare)
- 16.2.8.1. Overview
- 16.2.8.2. Products
- 16.2.8.3. SWOT Analysis
- 16.2.8.4. Recent Developments
- 16.2.8.5. Financials (Based on Availability)
- 16.2.9 Canon Inc (Canon Medical Systems USA)
- 16.2.9.1. Overview
- 16.2.9.2. Products
- 16.2.9.3. SWOT Analysis
- 16.2.9.4. Recent Developments
- 16.2.9.5. Financials (Based on Availability)
- 16.2.10 Koninklijke Philips NV
- 16.2.10.1. Overview
- 16.2.10.2. Products
- 16.2.10.3. SWOT Analysis
- 16.2.10.4. Recent Developments
- 16.2.10.5. Financials (Based on Availability)
- 16.2.11 International Business Machines Corporation (IBM)
- 16.2.11.1. Overview
- 16.2.11.2. Products
- 16.2.11.3. SWOT Analysis
- 16.2.11.4. Recent Developments
- 16.2.11.5. Financials (Based on Availability)
- 16.2.12 AQUILAB SAS
- 16.2.12.1. Overview
- 16.2.12.2. Products
- 16.2.12.3. SWOT Analysis
- 16.2.12.4. Recent Developments
- 16.2.12.5. Financials (Based on Availability)
- 16.2.13 Agfa-Gevaert Group
- 16.2.13.1. Overview
- 16.2.13.2. Products
- 16.2.13.3. SWOT Analysis
- 16.2.13.4. Recent Developments
- 16.2.13.5. Financials (Based on Availability)
- 16.2.1 Siemens Healthcare GmbH
List of Figures
- Figure 1: Global Medical Imaging Analysis Software Industry Revenue Breakdown (Million, %) by Region 2024 & 2032
- Figure 2: Global Medical Imaging Analysis Software Industry Volume Breakdown (K Unit, %) by Region 2024 & 2032
- Figure 3: North America Medical Imaging Analysis Software Industry Revenue (Million), by Country 2024 & 2032
- Figure 4: North America Medical Imaging Analysis Software Industry Volume (K Unit), by Country 2024 & 2032
- Figure 5: North America Medical Imaging Analysis Software Industry Revenue Share (%), by Country 2024 & 2032
- Figure 6: North America Medical Imaging Analysis Software Industry Volume Share (%), by Country 2024 & 2032
- Figure 7: Europe Medical Imaging Analysis Software Industry Revenue (Million), by Country 2024 & 2032
- Figure 8: Europe Medical Imaging Analysis Software Industry Volume (K Unit), by Country 2024 & 2032
- Figure 9: Europe Medical Imaging Analysis Software Industry Revenue Share (%), by Country 2024 & 2032
- Figure 10: Europe Medical Imaging Analysis Software Industry Volume Share (%), by Country 2024 & 2032
- Figure 11: Asia Pacific Medical Imaging Analysis Software Industry Revenue (Million), by Country 2024 & 2032
- Figure 12: Asia Pacific Medical Imaging Analysis Software Industry Volume (K Unit), by Country 2024 & 2032
- Figure 13: Asia Pacific Medical Imaging Analysis Software Industry Revenue Share (%), by Country 2024 & 2032
- Figure 14: Asia Pacific Medical Imaging Analysis Software Industry Volume Share (%), by Country 2024 & 2032
- Figure 15: Middle East and Africa Medical Imaging Analysis Software Industry Revenue (Million), by Country 2024 & 2032
- Figure 16: Middle East and Africa Medical Imaging Analysis Software Industry Volume (K Unit), by Country 2024 & 2032
- Figure 17: Middle East and Africa Medical Imaging Analysis Software Industry Revenue Share (%), by Country 2024 & 2032
- Figure 18: Middle East and Africa Medical Imaging Analysis Software Industry Volume Share (%), by Country 2024 & 2032
- Figure 19: South America Medical Imaging Analysis Software Industry Revenue (Million), by Country 2024 & 2032
- Figure 20: South America Medical Imaging Analysis Software Industry Volume (K Unit), by Country 2024 & 2032
- Figure 21: South America Medical Imaging Analysis Software Industry Revenue Share (%), by Country 2024 & 2032
- Figure 22: South America Medical Imaging Analysis Software Industry Volume Share (%), by Country 2024 & 2032
- Figure 23: North America Medical Imaging Analysis Software Industry Revenue (Million), by Image Type 2024 & 2032
- Figure 24: North America Medical Imaging Analysis Software Industry Volume (K Unit), by Image Type 2024 & 2032
- Figure 25: North America Medical Imaging Analysis Software Industry Revenue Share (%), by Image Type 2024 & 2032
- Figure 26: North America Medical Imaging Analysis Software Industry Volume Share (%), by Image Type 2024 & 2032
- Figure 27: North America Medical Imaging Analysis Software Industry Revenue (Million), by Modality 2024 & 2032
- Figure 28: North America Medical Imaging Analysis Software Industry Volume (K Unit), by Modality 2024 & 2032
- Figure 29: North America Medical Imaging Analysis Software Industry Revenue Share (%), by Modality 2024 & 2032
- Figure 30: North America Medical Imaging Analysis Software Industry Volume Share (%), by Modality 2024 & 2032
- Figure 31: North America Medical Imaging Analysis Software Industry Revenue (Million), by Software Type 2024 & 2032
- Figure 32: North America Medical Imaging Analysis Software Industry Volume (K Unit), by Software Type 2024 & 2032
- Figure 33: North America Medical Imaging Analysis Software Industry Revenue Share (%), by Software Type 2024 & 2032
- Figure 34: North America Medical Imaging Analysis Software Industry Volume Share (%), by Software Type 2024 & 2032
- Figure 35: North America Medical Imaging Analysis Software Industry Revenue (Million), by End User 2024 & 2032
- Figure 36: North America Medical Imaging Analysis Software Industry Volume (K Unit), by End User 2024 & 2032
- Figure 37: North America Medical Imaging Analysis Software Industry Revenue Share (%), by End User 2024 & 2032
- Figure 38: North America Medical Imaging Analysis Software Industry Volume Share (%), by End User 2024 & 2032
- Figure 39: North America Medical Imaging Analysis Software Industry Revenue (Million), by Country 2024 & 2032
- Figure 40: North America Medical Imaging Analysis Software Industry Volume (K Unit), by Country 2024 & 2032
- Figure 41: North America Medical Imaging Analysis Software Industry Revenue Share (%), by Country 2024 & 2032
- Figure 42: North America Medical Imaging Analysis Software Industry Volume Share (%), by Country 2024 & 2032
- Figure 43: Europe Medical Imaging Analysis Software Industry Revenue (Million), by Image Type 2024 & 2032
- Figure 44: Europe Medical Imaging Analysis Software Industry Volume (K Unit), by Image Type 2024 & 2032
- Figure 45: Europe Medical Imaging Analysis Software Industry Revenue Share (%), by Image Type 2024 & 2032
- Figure 46: Europe Medical Imaging Analysis Software Industry Volume Share (%), by Image Type 2024 & 2032
- Figure 47: Europe Medical Imaging Analysis Software Industry Revenue (Million), by Modality 2024 & 2032
- Figure 48: Europe Medical Imaging Analysis Software Industry Volume (K Unit), by Modality 2024 & 2032
- Figure 49: Europe Medical Imaging Analysis Software Industry Revenue Share (%), by Modality 2024 & 2032
- Figure 50: Europe Medical Imaging Analysis Software Industry Volume Share (%), by Modality 2024 & 2032
- Figure 51: Europe Medical Imaging Analysis Software Industry Revenue (Million), by Software Type 2024 & 2032
- Figure 52: Europe Medical Imaging Analysis Software Industry Volume (K Unit), by Software Type 2024 & 2032
- Figure 53: Europe Medical Imaging Analysis Software Industry Revenue Share (%), by Software Type 2024 & 2032
- Figure 54: Europe Medical Imaging Analysis Software Industry Volume Share (%), by Software Type 2024 & 2032
- Figure 55: Europe Medical Imaging Analysis Software Industry Revenue (Million), by End User 2024 & 2032
- Figure 56: Europe Medical Imaging Analysis Software Industry Volume (K Unit), by End User 2024 & 2032
- Figure 57: Europe Medical Imaging Analysis Software Industry Revenue Share (%), by End User 2024 & 2032
- Figure 58: Europe Medical Imaging Analysis Software Industry Volume Share (%), by End User 2024 & 2032
- Figure 59: Europe Medical Imaging Analysis Software Industry Revenue (Million), by Country 2024 & 2032
- Figure 60: Europe Medical Imaging Analysis Software Industry Volume (K Unit), by Country 2024 & 2032
- Figure 61: Europe Medical Imaging Analysis Software Industry Revenue Share (%), by Country 2024 & 2032
- Figure 62: Europe Medical Imaging Analysis Software Industry Volume Share (%), by Country 2024 & 2032
- Figure 63: Asia Pacific Medical Imaging Analysis Software Industry Revenue (Million), by Image Type 2024 & 2032
- Figure 64: Asia Pacific Medical Imaging Analysis Software Industry Volume (K Unit), by Image Type 2024 & 2032
- Figure 65: Asia Pacific Medical Imaging Analysis Software Industry Revenue Share (%), by Image Type 2024 & 2032
- Figure 66: Asia Pacific Medical Imaging Analysis Software Industry Volume Share (%), by Image Type 2024 & 2032
- Figure 67: Asia Pacific Medical Imaging Analysis Software Industry Revenue (Million), by Modality 2024 & 2032
- Figure 68: Asia Pacific Medical Imaging Analysis Software Industry Volume (K Unit), by Modality 2024 & 2032
- Figure 69: Asia Pacific Medical Imaging Analysis Software Industry Revenue Share (%), by Modality 2024 & 2032
- Figure 70: Asia Pacific Medical Imaging Analysis Software Industry Volume Share (%), by Modality 2024 & 2032
- Figure 71: Asia Pacific Medical Imaging Analysis Software Industry Revenue (Million), by Software Type 2024 & 2032
- Figure 72: Asia Pacific Medical Imaging Analysis Software Industry Volume (K Unit), by Software Type 2024 & 2032
- Figure 73: Asia Pacific Medical Imaging Analysis Software Industry Revenue Share (%), by Software Type 2024 & 2032
- Figure 74: Asia Pacific Medical Imaging Analysis Software Industry Volume Share (%), by Software Type 2024 & 2032
- Figure 75: Asia Pacific Medical Imaging Analysis Software Industry Revenue (Million), by End User 2024 & 2032
- Figure 76: Asia Pacific Medical Imaging Analysis Software Industry Volume (K Unit), by End User 2024 & 2032
- Figure 77: Asia Pacific Medical Imaging Analysis Software Industry Revenue Share (%), by End User 2024 & 2032
- Figure 78: Asia Pacific Medical Imaging Analysis Software Industry Volume Share (%), by End User 2024 & 2032
- Figure 79: Asia Pacific Medical Imaging Analysis Software Industry Revenue (Million), by Country 2024 & 2032
- Figure 80: Asia Pacific Medical Imaging Analysis Software Industry Volume (K Unit), by Country 2024 & 2032
- Figure 81: Asia Pacific Medical Imaging Analysis Software Industry Revenue Share (%), by Country 2024 & 2032
- Figure 82: Asia Pacific Medical Imaging Analysis Software Industry Volume Share (%), by Country 2024 & 2032
- Figure 83: Middle East and Africa Medical Imaging Analysis Software Industry Revenue (Million), by Image Type 2024 & 2032
- Figure 84: Middle East and Africa Medical Imaging Analysis Software Industry Volume (K Unit), by Image Type 2024 & 2032
- Figure 85: Middle East and Africa Medical Imaging Analysis Software Industry Revenue Share (%), by Image Type 2024 & 2032
- Figure 86: Middle East and Africa Medical Imaging Analysis Software Industry Volume Share (%), by Image Type 2024 & 2032
- Figure 87: Middle East and Africa Medical Imaging Analysis Software Industry Revenue (Million), by Modality 2024 & 2032
- Figure 88: Middle East and Africa Medical Imaging Analysis Software Industry Volume (K Unit), by Modality 2024 & 2032
- Figure 89: Middle East and Africa Medical Imaging Analysis Software Industry Revenue Share (%), by Modality 2024 & 2032
- Figure 90: Middle East and Africa Medical Imaging Analysis Software Industry Volume Share (%), by Modality 2024 & 2032
- Figure 91: Middle East and Africa Medical Imaging Analysis Software Industry Revenue (Million), by Software Type 2024 & 2032
- Figure 92: Middle East and Africa Medical Imaging Analysis Software Industry Volume (K Unit), by Software Type 2024 & 2032
- Figure 93: Middle East and Africa Medical Imaging Analysis Software Industry Revenue Share (%), by Software Type 2024 & 2032
- Figure 94: Middle East and Africa Medical Imaging Analysis Software Industry Volume Share (%), by Software Type 2024 & 2032
- Figure 95: Middle East and Africa Medical Imaging Analysis Software Industry Revenue (Million), by End User 2024 & 2032
- Figure 96: Middle East and Africa Medical Imaging Analysis Software Industry Volume (K Unit), by End User 2024 & 2032
- Figure 97: Middle East and Africa Medical Imaging Analysis Software Industry Revenue Share (%), by End User 2024 & 2032
- Figure 98: Middle East and Africa Medical Imaging Analysis Software Industry Volume Share (%), by End User 2024 & 2032
- Figure 99: Middle East and Africa Medical Imaging Analysis Software Industry Revenue (Million), by Country 2024 & 2032
- Figure 100: Middle East and Africa Medical Imaging Analysis Software Industry Volume (K Unit), by Country 2024 & 2032
- Figure 101: Middle East and Africa Medical Imaging Analysis Software Industry Revenue Share (%), by Country 2024 & 2032
- Figure 102: Middle East and Africa Medical Imaging Analysis Software Industry Volume Share (%), by Country 2024 & 2032
- Figure 103: South America Medical Imaging Analysis Software Industry Revenue (Million), by Image Type 2024 & 2032
- Figure 104: South America Medical Imaging Analysis Software Industry Volume (K Unit), by Image Type 2024 & 2032
- Figure 105: South America Medical Imaging Analysis Software Industry Revenue Share (%), by Image Type 2024 & 2032
- Figure 106: South America Medical Imaging Analysis Software Industry Volume Share (%), by Image Type 2024 & 2032
- Figure 107: South America Medical Imaging Analysis Software Industry Revenue (Million), by Modality 2024 & 2032
- Figure 108: South America Medical Imaging Analysis Software Industry Volume (K Unit), by Modality 2024 & 2032
- Figure 109: South America Medical Imaging Analysis Software Industry Revenue Share (%), by Modality 2024 & 2032
- Figure 110: South America Medical Imaging Analysis Software Industry Volume Share (%), by Modality 2024 & 2032
- Figure 111: South America Medical Imaging Analysis Software Industry Revenue (Million), by Software Type 2024 & 2032
- Figure 112: South America Medical Imaging Analysis Software Industry Volume (K Unit), by Software Type 2024 & 2032
- Figure 113: South America Medical Imaging Analysis Software Industry Revenue Share (%), by Software Type 2024 & 2032
- Figure 114: South America Medical Imaging Analysis Software Industry Volume Share (%), by Software Type 2024 & 2032
- Figure 115: South America Medical Imaging Analysis Software Industry Revenue (Million), by End User 2024 & 2032
- Figure 116: South America Medical Imaging Analysis Software Industry Volume (K Unit), by End User 2024 & 2032
- Figure 117: South America Medical Imaging Analysis Software Industry Revenue Share (%), by End User 2024 & 2032
- Figure 118: South America Medical Imaging Analysis Software Industry Volume Share (%), by End User 2024 & 2032
- Figure 119: South America Medical Imaging Analysis Software Industry Revenue (Million), by Country 2024 & 2032
- Figure 120: South America Medical Imaging Analysis Software Industry Volume (K Unit), by Country 2024 & 2032
- Figure 121: South America Medical Imaging Analysis Software Industry Revenue Share (%), by Country 2024 & 2032
- Figure 122: South America Medical Imaging Analysis Software Industry Volume Share (%), by Country 2024 & 2032
List of Tables
- Table 1: Global Medical Imaging Analysis Software Industry Revenue Million Forecast, by Region 2019 & 2032
- Table 2: Global Medical Imaging Analysis Software Industry Volume K Unit Forecast, by Region 2019 & 2032
- Table 3: Global Medical Imaging Analysis Software Industry Revenue Million Forecast, by Image Type 2019 & 2032
- Table 4: Global Medical Imaging Analysis Software Industry Volume K Unit Forecast, by Image Type 2019 & 2032
- Table 5: Global Medical Imaging Analysis Software Industry Revenue Million Forecast, by Modality 2019 & 2032
- Table 6: Global Medical Imaging Analysis Software Industry Volume K Unit Forecast, by Modality 2019 & 2032
- Table 7: Global Medical Imaging Analysis Software Industry Revenue Million Forecast, by Software Type 2019 & 2032
- Table 8: Global Medical Imaging Analysis Software Industry Volume K Unit Forecast, by Software Type 2019 & 2032
- Table 9: Global Medical Imaging Analysis Software Industry Revenue Million Forecast, by End User 2019 & 2032
- Table 10: Global Medical Imaging Analysis Software Industry Volume K Unit Forecast, by End User 2019 & 2032
- Table 11: Global Medical Imaging Analysis Software Industry Revenue Million Forecast, by Region 2019 & 2032
- Table 12: Global Medical Imaging Analysis Software Industry Volume K Unit Forecast, by Region 2019 & 2032
- Table 13: Global Medical Imaging Analysis Software Industry Revenue Million Forecast, by Country 2019 & 2032
- Table 14: Global Medical Imaging Analysis Software Industry Volume K Unit Forecast, by Country 2019 & 2032
- Table 15: United States Medical Imaging Analysis Software Industry Revenue (Million) Forecast, by Application 2019 & 2032
- Table 16: United States Medical Imaging Analysis Software Industry Volume (K Unit) Forecast, by Application 2019 & 2032
- Table 17: Canada Medical Imaging Analysis Software Industry Revenue (Million) Forecast, by Application 2019 & 2032
- Table 18: Canada Medical Imaging Analysis Software Industry Volume (K Unit) Forecast, by Application 2019 & 2032
- Table 19: Mexico Medical Imaging Analysis Software Industry Revenue (Million) Forecast, by Application 2019 & 2032
- Table 20: Mexico Medical Imaging Analysis Software Industry Volume (K Unit) Forecast, by Application 2019 & 2032
- Table 21: Global Medical Imaging Analysis Software Industry Revenue Million Forecast, by Country 2019 & 2032
- Table 22: Global Medical Imaging Analysis Software Industry Volume K Unit Forecast, by Country 2019 & 2032
- Table 23: Germany Medical Imaging Analysis Software Industry Revenue (Million) Forecast, by Application 2019 & 2032
- Table 24: Germany Medical Imaging Analysis Software Industry Volume (K Unit) Forecast, by Application 2019 & 2032
- Table 25: United Kingdom Medical Imaging Analysis Software Industry Revenue (Million) Forecast, by Application 2019 & 2032
- Table 26: United Kingdom Medical Imaging Analysis Software Industry Volume (K Unit) Forecast, by Application 2019 & 2032
- Table 27: France Medical Imaging Analysis Software Industry Revenue (Million) Forecast, by Application 2019 & 2032
- Table 28: France Medical Imaging Analysis Software Industry Volume (K Unit) Forecast, by Application 2019 & 2032
- Table 29: Italy Medical Imaging Analysis Software Industry Revenue (Million) Forecast, by Application 2019 & 2032
- Table 30: Italy Medical Imaging Analysis Software Industry Volume (K Unit) Forecast, by Application 2019 & 2032
- Table 31: Spain Medical Imaging Analysis Software Industry Revenue (Million) Forecast, by Application 2019 & 2032
- Table 32: Spain Medical Imaging Analysis Software Industry Volume (K Unit) Forecast, by Application 2019 & 2032
- Table 33: Rest of Europe Medical Imaging Analysis Software Industry Revenue (Million) Forecast, by Application 2019 & 2032
- Table 34: Rest of Europe Medical Imaging Analysis Software Industry Volume (K Unit) Forecast, by Application 2019 & 2032
- Table 35: Global Medical Imaging Analysis Software Industry Revenue Million Forecast, by Country 2019 & 2032
- Table 36: Global Medical Imaging Analysis Software Industry Volume K Unit Forecast, by Country 2019 & 2032
- Table 37: China Medical Imaging Analysis Software Industry Revenue (Million) Forecast, by Application 2019 & 2032
- Table 38: China Medical Imaging Analysis Software Industry Volume (K Unit) Forecast, by Application 2019 & 2032
- Table 39: Japan Medical Imaging Analysis Software Industry Revenue (Million) Forecast, by Application 2019 & 2032
- Table 40: Japan Medical Imaging Analysis Software Industry Volume (K Unit) Forecast, by Application 2019 & 2032
- Table 41: India Medical Imaging Analysis Software Industry Revenue (Million) Forecast, by Application 2019 & 2032
- Table 42: India Medical Imaging Analysis Software Industry Volume (K Unit) Forecast, by Application 2019 & 2032
- Table 43: Australia Medical Imaging Analysis Software Industry Revenue (Million) Forecast, by Application 2019 & 2032
- Table 44: Australia Medical Imaging Analysis Software Industry Volume (K Unit) Forecast, by Application 2019 & 2032
- Table 45: South Korea Medical Imaging Analysis Software Industry Revenue (Million) Forecast, by Application 2019 & 2032
- Table 46: South Korea Medical Imaging Analysis Software Industry Volume (K Unit) Forecast, by Application 2019 & 2032
- Table 47: Rest of Asia Pacific Medical Imaging Analysis Software Industry Revenue (Million) Forecast, by Application 2019 & 2032
- Table 48: Rest of Asia Pacific Medical Imaging Analysis Software Industry Volume (K Unit) Forecast, by Application 2019 & 2032
- Table 49: Global Medical Imaging Analysis Software Industry Revenue Million Forecast, by Country 2019 & 2032
- Table 50: Global Medical Imaging Analysis Software Industry Volume K Unit Forecast, by Country 2019 & 2032
- Table 51: GCC Medical Imaging Analysis Software Industry Revenue (Million) Forecast, by Application 2019 & 2032
- Table 52: GCC Medical Imaging Analysis Software Industry Volume (K Unit) Forecast, by Application 2019 & 2032
- Table 53: South Africa Medical Imaging Analysis Software Industry Revenue (Million) Forecast, by Application 2019 & 2032
- Table 54: South Africa Medical Imaging Analysis Software Industry Volume (K Unit) Forecast, by Application 2019 & 2032
- Table 55: Rest of Middle East and Africa Medical Imaging Analysis Software Industry Revenue (Million) Forecast, by Application 2019 & 2032
- Table 56: Rest of Middle East and Africa Medical Imaging Analysis Software Industry Volume (K Unit) Forecast, by Application 2019 & 2032
- Table 57: Global Medical Imaging Analysis Software Industry Revenue Million Forecast, by Country 2019 & 2032
- Table 58: Global Medical Imaging Analysis Software Industry Volume K Unit Forecast, by Country 2019 & 2032
- Table 59: Brazil Medical Imaging Analysis Software Industry Revenue (Million) Forecast, by Application 2019 & 2032
- Table 60: Brazil Medical Imaging Analysis Software Industry Volume (K Unit) Forecast, by Application 2019 & 2032
- Table 61: Argentina Medical Imaging Analysis Software Industry Revenue (Million) Forecast, by Application 2019 & 2032
- Table 62: Argentina Medical Imaging Analysis Software Industry Volume (K Unit) Forecast, by Application 2019 & 2032
- Table 63: Rest of South America Medical Imaging Analysis Software Industry Revenue (Million) Forecast, by Application 2019 & 2032
- Table 64: Rest of South America Medical Imaging Analysis Software Industry Volume (K Unit) Forecast, by Application 2019 & 2032
- Table 65: Global Medical Imaging Analysis Software Industry Revenue Million Forecast, by Image Type 2019 & 2032
- Table 66: Global Medical Imaging Analysis Software Industry Volume K Unit Forecast, by Image Type 2019 & 2032
- Table 67: Global Medical Imaging Analysis Software Industry Revenue Million Forecast, by Modality 2019 & 2032
- Table 68: Global Medical Imaging Analysis Software Industry Volume K Unit Forecast, by Modality 2019 & 2032
- Table 69: Global Medical Imaging Analysis Software Industry Revenue Million Forecast, by Software Type 2019 & 2032
- Table 70: Global Medical Imaging Analysis Software Industry Volume K Unit Forecast, by Software Type 2019 & 2032
- Table 71: Global Medical Imaging Analysis Software Industry Revenue Million Forecast, by End User 2019 & 2032
- Table 72: Global Medical Imaging Analysis Software Industry Volume K Unit Forecast, by End User 2019 & 2032
- Table 73: Global Medical Imaging Analysis Software Industry Revenue Million Forecast, by Country 2019 & 2032
- Table 74: Global Medical Imaging Analysis Software Industry Volume K Unit Forecast, by Country 2019 & 2032
- Table 75: United States Medical Imaging Analysis Software Industry Revenue (Million) Forecast, by Application 2019 & 2032
- Table 76: United States Medical Imaging Analysis Software Industry Volume (K Unit) Forecast, by Application 2019 & 2032
- Table 77: Canada Medical Imaging Analysis Software Industry Revenue (Million) Forecast, by Application 2019 & 2032
- Table 78: Canada Medical Imaging Analysis Software Industry Volume (K Unit) Forecast, by Application 2019 & 2032
- Table 79: Mexico Medical Imaging Analysis Software Industry Revenue (Million) Forecast, by Application 2019 & 2032
- Table 80: Mexico Medical Imaging Analysis Software Industry Volume (K Unit) Forecast, by Application 2019 & 2032
- Table 81: Global Medical Imaging Analysis Software Industry Revenue Million Forecast, by Image Type 2019 & 2032
- Table 82: Global Medical Imaging Analysis Software Industry Volume K Unit Forecast, by Image Type 2019 & 2032
- Table 83: Global Medical Imaging Analysis Software Industry Revenue Million Forecast, by Modality 2019 & 2032
- Table 84: Global Medical Imaging Analysis Software Industry Volume K Unit Forecast, by Modality 2019 & 2032
- Table 85: Global Medical Imaging Analysis Software Industry Revenue Million Forecast, by Software Type 2019 & 2032
- Table 86: Global Medical Imaging Analysis Software Industry Volume K Unit Forecast, by Software Type 2019 & 2032
- Table 87: Global Medical Imaging Analysis Software Industry Revenue Million Forecast, by End User 2019 & 2032
- Table 88: Global Medical Imaging Analysis Software Industry Volume K Unit Forecast, by End User 2019 & 2032
- Table 89: Global Medical Imaging Analysis Software Industry Revenue Million Forecast, by Country 2019 & 2032
- Table 90: Global Medical Imaging Analysis Software Industry Volume K Unit Forecast, by Country 2019 & 2032
- Table 91: Germany Medical Imaging Analysis Software Industry Revenue (Million) Forecast, by Application 2019 & 2032
- Table 92: Germany Medical Imaging Analysis Software Industry Volume (K Unit) Forecast, by Application 2019 & 2032
- Table 93: United Kingdom Medical Imaging Analysis Software Industry Revenue (Million) Forecast, by Application 2019 & 2032
- Table 94: United Kingdom Medical Imaging Analysis Software Industry Volume (K Unit) Forecast, by Application 2019 & 2032
- Table 95: France Medical Imaging Analysis Software Industry Revenue (Million) Forecast, by Application 2019 & 2032
- Table 96: France Medical Imaging Analysis Software Industry Volume (K Unit) Forecast, by Application 2019 & 2032
- Table 97: Italy Medical Imaging Analysis Software Industry Revenue (Million) Forecast, by Application 2019 & 2032
- Table 98: Italy Medical Imaging Analysis Software Industry Volume (K Unit) Forecast, by Application 2019 & 2032
- Table 99: Spain Medical Imaging Analysis Software Industry Revenue (Million) Forecast, by Application 2019 & 2032
- Table 100: Spain Medical Imaging Analysis Software Industry Volume (K Unit) Forecast, by Application 2019 & 2032
- Table 101: Rest of Europe Medical Imaging Analysis Software Industry Revenue (Million) Forecast, by Application 2019 & 2032
- Table 102: Rest of Europe Medical Imaging Analysis Software Industry Volume (K Unit) Forecast, by Application 2019 & 2032
- Table 103: Global Medical Imaging Analysis Software Industry Revenue Million Forecast, by Image Type 2019 & 2032
- Table 104: Global Medical Imaging Analysis Software Industry Volume K Unit Forecast, by Image Type 2019 & 2032
- Table 105: Global Medical Imaging Analysis Software Industry Revenue Million Forecast, by Modality 2019 & 2032
- Table 106: Global Medical Imaging Analysis Software Industry Volume K Unit Forecast, by Modality 2019 & 2032
- Table 107: Global Medical Imaging Analysis Software Industry Revenue Million Forecast, by Software Type 2019 & 2032
- Table 108: Global Medical Imaging Analysis Software Industry Volume K Unit Forecast, by Software Type 2019 & 2032
- Table 109: Global Medical Imaging Analysis Software Industry Revenue Million Forecast, by End User 2019 & 2032
- Table 110: Global Medical Imaging Analysis Software Industry Volume K Unit Forecast, by End User 2019 & 2032
- Table 111: Global Medical Imaging Analysis Software Industry Revenue Million Forecast, by Country 2019 & 2032
- Table 112: Global Medical Imaging Analysis Software Industry Volume K Unit Forecast, by Country 2019 & 2032
- Table 113: China Medical Imaging Analysis Software Industry Revenue (Million) Forecast, by Application 2019 & 2032
- Table 114: China Medical Imaging Analysis Software Industry Volume (K Unit) Forecast, by Application 2019 & 2032
- Table 115: Japan Medical Imaging Analysis Software Industry Revenue (Million) Forecast, by Application 2019 & 2032
- Table 116: Japan Medical Imaging Analysis Software Industry Volume (K Unit) Forecast, by Application 2019 & 2032
- Table 117: India Medical Imaging Analysis Software Industry Revenue (Million) Forecast, by Application 2019 & 2032
- Table 118: India Medical Imaging Analysis Software Industry Volume (K Unit) Forecast, by Application 2019 & 2032
- Table 119: Australia Medical Imaging Analysis Software Industry Revenue (Million) Forecast, by Application 2019 & 2032
- Table 120: Australia Medical Imaging Analysis Software Industry Volume (K Unit) Forecast, by Application 2019 & 2032
- Table 121: South Korea Medical Imaging Analysis Software Industry Revenue (Million) Forecast, by Application 2019 & 2032
- Table 122: South Korea Medical Imaging Analysis Software Industry Volume (K Unit) Forecast, by Application 2019 & 2032
- Table 123: Rest of Asia Pacific Medical Imaging Analysis Software Industry Revenue (Million) Forecast, by Application 2019 & 2032
- Table 124: Rest of Asia Pacific Medical Imaging Analysis Software Industry Volume (K Unit) Forecast, by Application 2019 & 2032
- Table 125: Global Medical Imaging Analysis Software Industry Revenue Million Forecast, by Image Type 2019 & 2032
- Table 126: Global Medical Imaging Analysis Software Industry Volume K Unit Forecast, by Image Type 2019 & 2032
- Table 127: Global Medical Imaging Analysis Software Industry Revenue Million Forecast, by Modality 2019 & 2032
- Table 128: Global Medical Imaging Analysis Software Industry Volume K Unit Forecast, by Modality 2019 & 2032
- Table 129: Global Medical Imaging Analysis Software Industry Revenue Million Forecast, by Software Type 2019 & 2032
- Table 130: Global Medical Imaging Analysis Software Industry Volume K Unit Forecast, by Software Type 2019 & 2032
- Table 131: Global Medical Imaging Analysis Software Industry Revenue Million Forecast, by End User 2019 & 2032
- Table 132: Global Medical Imaging Analysis Software Industry Volume K Unit Forecast, by End User 2019 & 2032
- Table 133: Global Medical Imaging Analysis Software Industry Revenue Million Forecast, by Country 2019 & 2032
- Table 134: Global Medical Imaging Analysis Software Industry Volume K Unit Forecast, by Country 2019 & 2032
- Table 135: GCC Medical Imaging Analysis Software Industry Revenue (Million) Forecast, by Application 2019 & 2032
- Table 136: GCC Medical Imaging Analysis Software Industry Volume (K Unit) Forecast, by Application 2019 & 2032
- Table 137: South Africa Medical Imaging Analysis Software Industry Revenue (Million) Forecast, by Application 2019 & 2032
- Table 138: South Africa Medical Imaging Analysis Software Industry Volume (K Unit) Forecast, by Application 2019 & 2032
- Table 139: Rest of Middle East and Africa Medical Imaging Analysis Software Industry Revenue (Million) Forecast, by Application 2019 & 2032
- Table 140: Rest of Middle East and Africa Medical Imaging Analysis Software Industry Volume (K Unit) Forecast, by Application 2019 & 2032
- Table 141: Global Medical Imaging Analysis Software Industry Revenue Million Forecast, by Image Type 2019 & 2032
- Table 142: Global Medical Imaging Analysis Software Industry Volume K Unit Forecast, by Image Type 2019 & 2032
- Table 143: Global Medical Imaging Analysis Software Industry Revenue Million Forecast, by Modality 2019 & 2032
- Table 144: Global Medical Imaging Analysis Software Industry Volume K Unit Forecast, by Modality 2019 & 2032
- Table 145: Global Medical Imaging Analysis Software Industry Revenue Million Forecast, by Software Type 2019 & 2032
- Table 146: Global Medical Imaging Analysis Software Industry Volume K Unit Forecast, by Software Type 2019 & 2032
- Table 147: Global Medical Imaging Analysis Software Industry Revenue Million Forecast, by End User 2019 & 2032
- Table 148: Global Medical Imaging Analysis Software Industry Volume K Unit Forecast, by End User 2019 & 2032
- Table 149: Global Medical Imaging Analysis Software Industry Revenue Million Forecast, by Country 2019 & 2032
- Table 150: Global Medical Imaging Analysis Software Industry Volume K Unit Forecast, by Country 2019 & 2032
- Table 151: Brazil Medical Imaging Analysis Software Industry Revenue (Million) Forecast, by Application 2019 & 2032
- Table 152: Brazil Medical Imaging Analysis Software Industry Volume (K Unit) Forecast, by Application 2019 & 2032
- Table 153: Argentina Medical Imaging Analysis Software Industry Revenue (Million) Forecast, by Application 2019 & 2032
- Table 154: Argentina Medical Imaging Analysis Software Industry Volume (K Unit) Forecast, by Application 2019 & 2032
- Table 155: Rest of South America Medical Imaging Analysis Software Industry Revenue (Million) Forecast, by Application 2019 & 2032
- Table 156: Rest of South America Medical Imaging Analysis Software Industry Volume (K Unit) Forecast, by Application 2019 & 2032
Frequently Asked Questions
1. What is the projected Compound Annual Growth Rate (CAGR) of the Medical Imaging Analysis Software Industry?
The projected CAGR is approximately 7.60%.
2. Which companies are prominent players in the Medical Imaging Analysis Software Industry?
Key companies in the market include Siemens Healthcare GmbH, ScienceSoft USA Corporation, RamSoft Inc, Synapsica Healthcare Pvt Ltd, Intelerad Medical Systems Incorporated, Carestream Health, Xinapse Systems Ltd, General Electric Company (GE Healthcare), Canon Inc (Canon Medical Systems USA), Koninklijke Philips NV, International Business Machines Corporation (IBM), AQUILAB SAS, Agfa-Gevaert Group.
3. What are the main segments of the Medical Imaging Analysis Software Industry?
The market segments include Image Type, Modality, Software Type, End User.
4. Can you provide details about the market size?
The market size is estimated to be USD XX Million as of 2022.
5. What are some drivers contributing to market growth?
Technological Advancements in Medical Imaging Systems and Analysis Software; Increasing Usage of Imaging Equipment Due to Rising Prevalence of Chronic Diseases; Rising Applications of Computer-aided Diagnosis.
6. What are the notable trends driving market growth?
The X-ray Imaging Segment is Expected to Witness Significant Growth Over the Forecast Period.
7. Are there any restraints impacting market growth?
Budgetary Constraints.
8. Can you provide examples of recent developments in the market?
In July 2022, Siemens Healthineers, a medical technology company, officially integrated Subtle Medical's SubtleMR image-enhancement software into the new reconstruction pipeline of Siemens Healthineers, Open Recon. SubtleMR offers DL (deep learning) post-processing for denoising and increased sharpness on faster MRI sequences, enabling improved image quality, optimized workflow, and a better patient experience.
9. What pricing options are available for accessing the report?
Pricing options include single-user, multi-user, and enterprise licenses priced at USD 4750, USD 5250, and USD 8750 respectively.
10. Is the market size provided in terms of value or volume?
The market size is provided in terms of value, measured in Million and volume, measured in K Unit.
11. Are there any specific market keywords associated with the report?
Yes, the market keyword associated with the report is "Medical Imaging Analysis Software Industry," which aids in identifying and referencing the specific market segment covered.
12. How do I determine which pricing option suits my needs best?
The pricing options vary based on user requirements and access needs. Individual users may opt for single-user licenses, while businesses requiring broader access may choose multi-user or enterprise licenses for cost-effective access to the report.
13. Are there any additional resources or data provided in the Medical Imaging Analysis Software Industry report?
While the report offers comprehensive insights, it's advisable to review the specific contents or supplementary materials provided to ascertain if additional resources or data are available.
14. How can I stay updated on further developments or reports in the Medical Imaging Analysis Software Industry?
To stay informed about further developments, trends, and reports in the Medical Imaging Analysis Software Industry, consider subscribing to industry newsletters, following relevant companies and organizations, or regularly checking reputable industry news sources and publications.
Methodology
Step 1 - Identification of Relevant Samples Size from Population Database


Step 2 - Approaches for Defining Global Market Size (Value, Volume* & Price*)

Note*: In applicable scenarios
Step 3 - Data Sources
Primary Research
- Web Analytics
- Survey Reports
- Research Institute
- Latest Research Reports
- Opinion Leaders
Secondary Research
- Annual Reports
- White Paper
- Latest Press Release
- Industry Association
- Paid Database
- Investor Presentations

Step 4 - Data Triangulation
Involves using different sources of information in order to increase the validity of a study
These sources are likely to be stakeholders in a program - participants, other researchers, program staff, other community members, and so on.
Then we put all data in single framework & apply various statistical tools to find out the dynamic on the market.
During the analysis stage, feedback from the stakeholder groups would be compared to determine areas of agreement as well as areas of divergence
