

Key Insights
The global miticide for plant market is experiencing robust growth, driven by the increasing prevalence of mite infestations in agricultural crops and horticulture. The rising demand for high-quality and safe agricultural produce, coupled with the escalating awareness regarding the harmful effects of chemical pesticides, is fueling the adoption of effective and environmentally friendly miticides. This market is segmented by type (chemical, biological), application (row crops, fruits & vegetables, ornamentals), and region. The chemical segment currently dominates, owing to its proven efficacy and established distribution channels. However, the biological segment is witnessing significant growth, driven by the growing consumer preference for organic produce and stringent regulations on chemical pesticide usage. Key players, including BASF, Bayer, and Syngenta, are strategically investing in research and development to introduce innovative miticide formulations with enhanced efficacy and reduced environmental impact. The market also sees considerable regional variation, with developed regions like North America and Europe exhibiting higher adoption rates due to increased awareness and stringent regulations. However, developing regions in Asia and Latin America are projected to show significant growth potential, fueled by expanding agricultural practices and rising disposable incomes. The market faces restraints such as the high cost of certain miticides, potential resistance development in mites, and the need for precise application techniques to maximize effectiveness.
Despite these challenges, the market outlook remains positive, with a projected compound annual growth rate (CAGR) of approximately 5% from 2025 to 2033. This growth will be fueled by the ongoing research into novel miticide formulations, the development of integrated pest management (IPM) strategies, and the growing demand for sustainable agricultural practices. Companies are likely to focus on strategic partnerships, mergers and acquisitions, and product diversification to enhance their market share and cater to evolving consumer needs. The focus on bio-pesticides and environmentally friendly options presents a significant opportunity for growth within the market. Technological advancements in precision agriculture, enabling targeted miticide application, further contribute to the market's positive trajectory.
Miticide for Plant Market Report: 2019-2033
This comprehensive report provides a detailed analysis of the global miticide for plant market, covering the period from 2019 to 2033. It offers invaluable insights into market dynamics, growth trends, competitive landscapes, and future opportunities for industry professionals, investors, and stakeholders. The report leverages extensive primary and secondary research to deliver accurate and actionable intelligence, focusing on key segments within the broader crop protection market.
Miticide for Plant Market Dynamics & Structure
This section analyzes the intricate structure of the miticide for plant market, examining its concentration, technological advancements, regulatory landscapes, competitive dynamics, and end-user characteristics. The study period spans 2019-2033, with 2025 serving as the base and estimated year. The forecast period extends from 2025-2033, while the historical period covers 2019-2024.
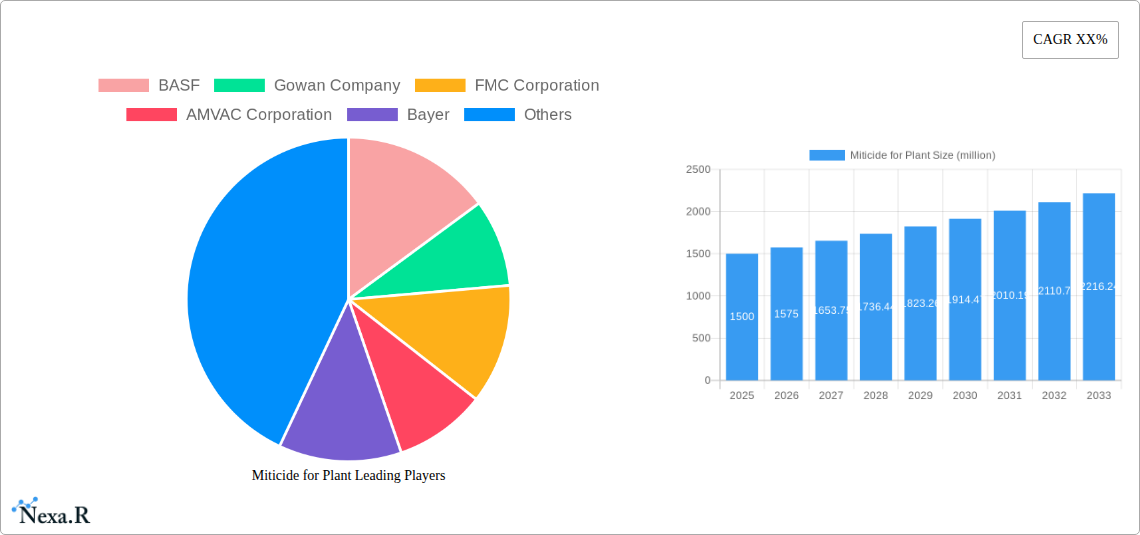
Market Concentration & Competition: The global miticide market exhibits a moderately concentrated structure, with key players like BASF, Bayer, and Syngenta holding significant market share. Smaller players focus on niche segments or geographic areas. The market share of the top five players is estimated at xx% in 2025. This concentration is expected to remain relatively stable throughout the forecast period, although smaller players may gain share through innovation and strategic partnerships.
- Market Share (2025, estimated): BASF (xx%), Bayer (xx%), Syngenta (xx%), FMC Corporation (xx%), Sumitomo Chemical (xx%), Others (xx%).
- M&A Activity (2019-2024): xx deals, with a total value of approximately $xx billion. Consolidation is expected to continue, driven by the need for economies of scale and access to new technologies.
- Competitive Landscape: Intense competition is driven by product innovation, pricing strategies, and expansion into new markets. The entry of bio-based miticide producers is intensifying competition.
- Regulatory Framework: Stringent regulations governing pesticide registration and usage significantly influence market dynamics, creating both challenges and opportunities for innovation.
Miticide for Plant Growth Trends & Insights
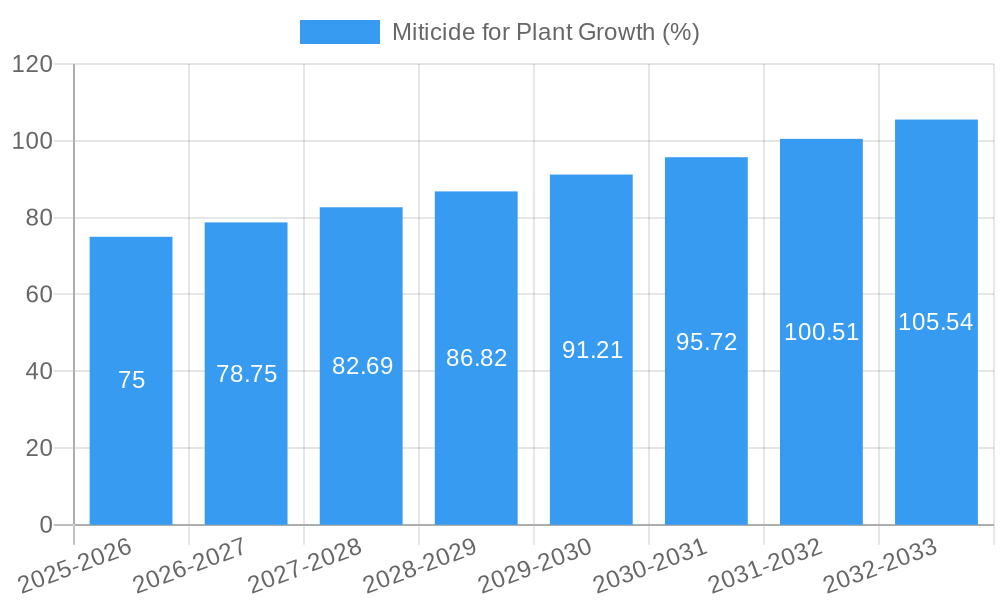
The global miticide for plant market has witnessed steady growth over the historical period (2019-2024). This growth is primarily attributed to increasing crop production, rising pest infestations due to climate change, and increasing demand for high-quality agricultural produce. The market size is projected to reach xx million units by 2025 and is expected to exhibit a CAGR of xx% during the forecast period (2025-2033), reaching xx million units by 2033. Adoption rates are highest in regions with intensive agricultural practices and significant pest pressure.
- Market Size (Million Units): 2019 (xx), 2024 (xx), 2025 (xx), 2033 (xx)
- CAGR (2025-2033): xx%
- Market Penetration: xx% in key agricultural regions by 2025.
Dominant Regions, Countries, or Segments in Miticide for Plant
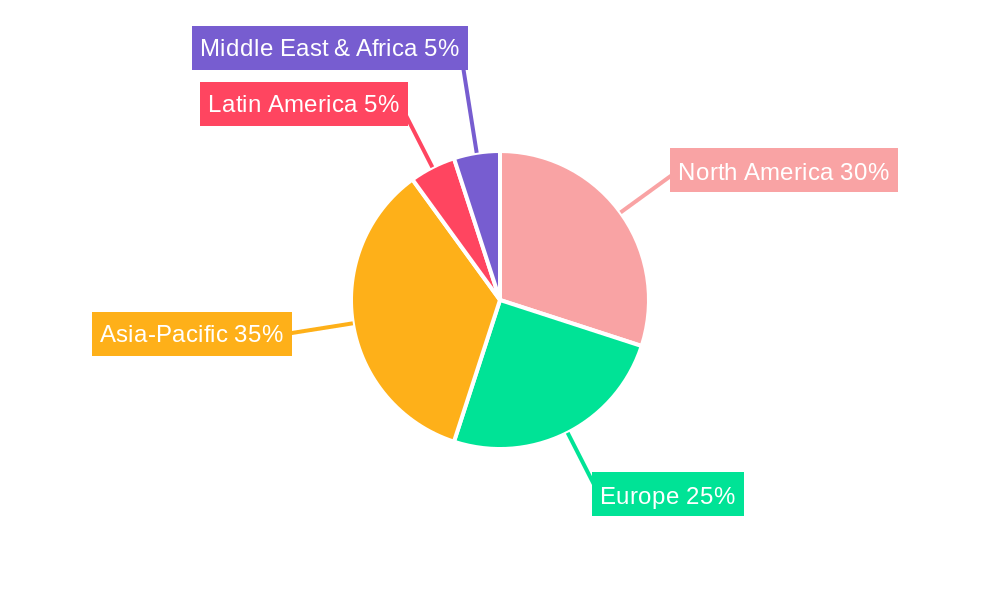
The Asia-Pacific region dominates the global miticide market, followed by North America and Europe. This dominance is primarily driven by factors such as large agricultural land areas, increasing crop production, and growing demand for high-quality crops. China and India are significant contributors to the growth in this region. However, North America and Europe present significant opportunities due to the adoption of advanced technologies and premium pricing.
- Key Growth Drivers:
- Rising disposable incomes and increasing demand for fresh produce in developing nations.
- Government initiatives and support for agricultural development.
- Technological advancements in miticide formulation and application.
- Regional Market Share (2025, estimated): Asia-Pacific (xx%), North America (xx%), Europe (xx%), Rest of World (xx%).
- Country-Specific Analysis: China (xx%), India (xx%), USA (xx%), Brazil (xx%).
Miticide for Plant Product Landscape
The miticide market offers a diverse range of products, encompassing synthetic chemicals, biopesticides, and integrated pest management (IPM) solutions. Innovations focus on improving efficacy, reducing environmental impact, and enhancing safety for applicators and consumers. Key advancements include the development of novel active ingredients, targeted formulations, and improved application technologies. The market sees a growing demand for bio-based miticides as concerns about environmental sustainability increase.
Key Drivers, Barriers & Challenges in Miticide for Plant
Key Drivers:
- Growing global population and increasing demand for food.
- Climate change and the associated rise in pest infestations.
- Stringent regulations requiring effective pest management.
- Technological innovations leading to improved efficacy and reduced environmental impact.
Key Challenges & Restraints:
- Strict regulations and lengthy registration processes for new miticides.
- Development of pest resistance to existing miticides, requiring continuous innovation.
- Concerns regarding environmental impact and human health effects of certain miticides.
- Fluctuations in raw material prices and supply chain disruptions.
Emerging Opportunities in Miticide for Plant
- Growing demand for biopesticides and other environmentally friendly solutions.
- Expansion into developing markets with high growth potential.
- Development of innovative formulations and application technologies to improve efficacy.
- Focus on integrated pest management (IPM) strategies for sustainable pest control.
Growth Accelerators in the Miticide for Plant Industry
The long-term growth of the miticide market will be fueled by several factors, including technological advancements in targeted delivery systems, the increasing adoption of precision agriculture, and strategic partnerships between chemical companies and agricultural technology providers. The development and commercialization of novel, more environmentally friendly miticides will also play a significant role in accelerating market expansion.
Key Players Shaping the Miticide for Plant Market
- BASF
- Gowan Company
- FMC Corporation
- AMVAC Corporation
- Bayer
- Sumitomo Chemical
- Syngenta
- Nufarm
- Certis Biologicals
- Griffin Greenhouse Supplies
- Arysta LifeScience
- Osho Chemical Industries
- Zhejiang WELL-DONE Chemical Co.,Ltd
- Wynca Group
- Shandong Weifang Rainbow Chemical Co.,Ltd
Notable Milestones in Miticide for Plant Sector
- 2020: Launch of a new biopesticide miticide by Certis Biologicals.
- 2021: Acquisition of a smaller miticide producer by BASF.
- 2022: Approval of a new synthetic miticide by the EPA in the USA.
- 2023: Significant investment in R&D for bio-based miticides by Syngenta.
- 2024: Introduction of a novel application technology for miticides.
In-Depth Miticide for Plant Market Outlook
The miticide for plant market is poised for continued growth driven by the persistent need for effective pest control in agriculture. Future growth will be shaped by advancements in sustainable and environmentally friendly solutions, the increasing adoption of precision agriculture technologies, and ongoing efforts to combat pest resistance. Strategic collaborations and investments in research and development will further propel the market's expansion in the coming years, with promising opportunities for both established and emerging players.
Miticide for Plant Segmentation
-
1. Application
- 1.1. Orchard
- 1.2. Nursery
- 1.3. Greenhouse
- 1.4. Gardening
- 1.5. Others
-
2. Types
- 2.1. Abamectin Miticide
- 2.2. Carbamate Miticide
- 2.3. Organophosphate Miticide
- 2.4. Others
Miticide for Plant Segmentation By Geography
-
1. North America
- 1.1. United States
- 1.2. Canada
- 1.3. Mexico
-
2. South America
- 2.1. Brazil
- 2.2. Argentina
- 2.3. Rest of South America
-
3. Europe
- 3.1. United Kingdom
- 3.2. Germany
- 3.3. France
- 3.4. Italy
- 3.5. Spain
- 3.6. Russia
- 3.7. Benelux
- 3.8. Nordics
- 3.9. Rest of Europe
-
4. Middle East & Africa
- 4.1. Turkey
- 4.2. Israel
- 4.3. GCC
- 4.4. North Africa
- 4.5. South Africa
- 4.6. Rest of Middle East & Africa
-
5. Asia Pacific
- 5.1. China
- 5.2. India
- 5.3. Japan
- 5.4. South Korea
- 5.5. ASEAN
- 5.6. Oceania
- 5.7. Rest of Asia Pacific
Miticide for Plant REPORT HIGHLIGHTS
| Aspects | Details |
|---|---|
| Study Period | 2019-2033 |
| Base Year | 2024 |
| Estimated Year | 2025 |
| Forecast Period | 2025-2033 |
| Historical Period | 2019-2024 |
| Growth Rate | CAGR of XX% from 2019-2033 |
| Segmentation |
|
Table of Contents
- 1. Introduction
- 1.1. Research Scope
- 1.2. Market Segmentation
- 1.3. Research Methodology
- 1.4. Definitions and Assumptions
- 2. Executive Summary
- 2.1. Introduction
- 3. Market Dynamics
- 3.1. Introduction
- 3.2. Market Drivers
- 3.3. Market Restrains
- 3.4. Market Trends
- 4. Market Factor Analysis
- 4.1. Porters Five Forces
- 4.2. Supply/Value Chain
- 4.3. PESTEL analysis
- 4.4. Market Entropy
- 4.5. Patent/Trademark Analysis
- 5. Global Miticide for Plant Analysis, Insights and Forecast, 2019-2031
- 5.1. Market Analysis, Insights and Forecast - by Application
- 5.1.1. Orchard
- 5.1.2. Nursery
- 5.1.3. Greenhouse
- 5.1.4. Gardening
- 5.1.5. Others
- 5.2. Market Analysis, Insights and Forecast - by Types
- 5.2.1. Abamectin Miticide
- 5.2.2. Carbamate Miticide
- 5.2.3. Organophosphate Miticide
- 5.2.4. Others
- 5.3. Market Analysis, Insights and Forecast - by Region
- 5.3.1. North America
- 5.3.2. South America
- 5.3.3. Europe
- 5.3.4. Middle East & Africa
- 5.3.5. Asia Pacific
- 5.1. Market Analysis, Insights and Forecast - by Application
- 6. North America Miticide for Plant Analysis, Insights and Forecast, 2019-2031
- 6.1. Market Analysis, Insights and Forecast - by Application
- 6.1.1. Orchard
- 6.1.2. Nursery
- 6.1.3. Greenhouse
- 6.1.4. Gardening
- 6.1.5. Others
- 6.2. Market Analysis, Insights and Forecast - by Types
- 6.2.1. Abamectin Miticide
- 6.2.2. Carbamate Miticide
- 6.2.3. Organophosphate Miticide
- 6.2.4. Others
- 6.1. Market Analysis, Insights and Forecast - by Application
- 7. South America Miticide for Plant Analysis, Insights and Forecast, 2019-2031
- 7.1. Market Analysis, Insights and Forecast - by Application
- 7.1.1. Orchard
- 7.1.2. Nursery
- 7.1.3. Greenhouse
- 7.1.4. Gardening
- 7.1.5. Others
- 7.2. Market Analysis, Insights and Forecast - by Types
- 7.2.1. Abamectin Miticide
- 7.2.2. Carbamate Miticide
- 7.2.3. Organophosphate Miticide
- 7.2.4. Others
- 7.1. Market Analysis, Insights and Forecast - by Application
- 8. Europe Miticide for Plant Analysis, Insights and Forecast, 2019-2031
- 8.1. Market Analysis, Insights and Forecast - by Application
- 8.1.1. Orchard
- 8.1.2. Nursery
- 8.1.3. Greenhouse
- 8.1.4. Gardening
- 8.1.5. Others
- 8.2. Market Analysis, Insights and Forecast - by Types
- 8.2.1. Abamectin Miticide
- 8.2.2. Carbamate Miticide
- 8.2.3. Organophosphate Miticide
- 8.2.4. Others
- 8.1. Market Analysis, Insights and Forecast - by Application
- 9. Middle East & Africa Miticide for Plant Analysis, Insights and Forecast, 2019-2031
- 9.1. Market Analysis, Insights and Forecast - by Application
- 9.1.1. Orchard
- 9.1.2. Nursery
- 9.1.3. Greenhouse
- 9.1.4. Gardening
- 9.1.5. Others
- 9.2. Market Analysis, Insights and Forecast - by Types
- 9.2.1. Abamectin Miticide
- 9.2.2. Carbamate Miticide
- 9.2.3. Organophosphate Miticide
- 9.2.4. Others
- 9.1. Market Analysis, Insights and Forecast - by Application
- 10. Asia Pacific Miticide for Plant Analysis, Insights and Forecast, 2019-2031
- 10.1. Market Analysis, Insights and Forecast - by Application
- 10.1.1. Orchard
- 10.1.2. Nursery
- 10.1.3. Greenhouse
- 10.1.4. Gardening
- 10.1.5. Others
- 10.2. Market Analysis, Insights and Forecast - by Types
- 10.2.1. Abamectin Miticide
- 10.2.2. Carbamate Miticide
- 10.2.3. Organophosphate Miticide
- 10.2.4. Others
- 10.1. Market Analysis, Insights and Forecast - by Application
- 11. Competitive Analysis
- 11.1. Global Market Share Analysis 2024
- 11.2. Company Profiles
- 11.2.1 BASF
- 11.2.1.1. Overview
- 11.2.1.2. Products
- 11.2.1.3. SWOT Analysis
- 11.2.1.4. Recent Developments
- 11.2.1.5. Financials (Based on Availability)
- 11.2.2 Gowan Company
- 11.2.2.1. Overview
- 11.2.2.2. Products
- 11.2.2.3. SWOT Analysis
- 11.2.2.4. Recent Developments
- 11.2.2.5. Financials (Based on Availability)
- 11.2.3 FMC Corporation
- 11.2.3.1. Overview
- 11.2.3.2. Products
- 11.2.3.3. SWOT Analysis
- 11.2.3.4. Recent Developments
- 11.2.3.5. Financials (Based on Availability)
- 11.2.4 AMVAC Corporation
- 11.2.4.1. Overview
- 11.2.4.2. Products
- 11.2.4.3. SWOT Analysis
- 11.2.4.4. Recent Developments
- 11.2.4.5. Financials (Based on Availability)
- 11.2.5 Bayer
- 11.2.5.1. Overview
- 11.2.5.2. Products
- 11.2.5.3. SWOT Analysis
- 11.2.5.4. Recent Developments
- 11.2.5.5. Financials (Based on Availability)
- 11.2.6 Sumitomo Chemical
- 11.2.6.1. Overview
- 11.2.6.2. Products
- 11.2.6.3. SWOT Analysis
- 11.2.6.4. Recent Developments
- 11.2.6.5. Financials (Based on Availability)
- 11.2.7 Syngenta
- 11.2.7.1. Overview
- 11.2.7.2. Products
- 11.2.7.3. SWOT Analysis
- 11.2.7.4. Recent Developments
- 11.2.7.5. Financials (Based on Availability)
- 11.2.8 Nufarm
- 11.2.8.1. Overview
- 11.2.8.2. Products
- 11.2.8.3. SWOT Analysis
- 11.2.8.4. Recent Developments
- 11.2.8.5. Financials (Based on Availability)
- 11.2.9 Certis Biologicals
- 11.2.9.1. Overview
- 11.2.9.2. Products
- 11.2.9.3. SWOT Analysis
- 11.2.9.4. Recent Developments
- 11.2.9.5. Financials (Based on Availability)
- 11.2.10 Griffin Greenhouse Supplies
- 11.2.10.1. Overview
- 11.2.10.2. Products
- 11.2.10.3. SWOT Analysis
- 11.2.10.4. Recent Developments
- 11.2.10.5. Financials (Based on Availability)
- 11.2.11 Arysta LifeScience
- 11.2.11.1. Overview
- 11.2.11.2. Products
- 11.2.11.3. SWOT Analysis
- 11.2.11.4. Recent Developments
- 11.2.11.5. Financials (Based on Availability)
- 11.2.12 Osho Chemical Industries
- 11.2.12.1. Overview
- 11.2.12.2. Products
- 11.2.12.3. SWOT Analysis
- 11.2.12.4. Recent Developments
- 11.2.12.5. Financials (Based on Availability)
- 11.2.13 Zhejiang WELL-DONE Chemical Co.
- 11.2.13.1. Overview
- 11.2.13.2. Products
- 11.2.13.3. SWOT Analysis
- 11.2.13.4. Recent Developments
- 11.2.13.5. Financials (Based on Availability)
- 11.2.14 Ltd
- 11.2.14.1. Overview
- 11.2.14.2. Products
- 11.2.14.3. SWOT Analysis
- 11.2.14.4. Recent Developments
- 11.2.14.5. Financials (Based on Availability)
- 11.2.15 Wynca Group
- 11.2.15.1. Overview
- 11.2.15.2. Products
- 11.2.15.3. SWOT Analysis
- 11.2.15.4. Recent Developments
- 11.2.15.5. Financials (Based on Availability)
- 11.2.16 Shandong Weifang Rainbow Chemical Co.
- 11.2.16.1. Overview
- 11.2.16.2. Products
- 11.2.16.3. SWOT Analysis
- 11.2.16.4. Recent Developments
- 11.2.16.5. Financials (Based on Availability)
- 11.2.17 Ltd
- 11.2.17.1. Overview
- 11.2.17.2. Products
- 11.2.17.3. SWOT Analysis
- 11.2.17.4. Recent Developments
- 11.2.17.5. Financials (Based on Availability)
- 11.2.1 BASF
List of Figures
- Figure 1: Global Miticide for Plant Revenue Breakdown (million, %) by Region 2024 & 2032
- Figure 2: Global Miticide for Plant Volume Breakdown (K, %) by Region 2024 & 2032
- Figure 3: North America Miticide for Plant Revenue (million), by Application 2024 & 2032
- Figure 4: North America Miticide for Plant Volume (K), by Application 2024 & 2032
- Figure 5: North America Miticide for Plant Revenue Share (%), by Application 2024 & 2032
- Figure 6: North America Miticide for Plant Volume Share (%), by Application 2024 & 2032
- Figure 7: North America Miticide for Plant Revenue (million), by Types 2024 & 2032
- Figure 8: North America Miticide for Plant Volume (K), by Types 2024 & 2032
- Figure 9: North America Miticide for Plant Revenue Share (%), by Types 2024 & 2032
- Figure 10: North America Miticide for Plant Volume Share (%), by Types 2024 & 2032
- Figure 11: North America Miticide for Plant Revenue (million), by Country 2024 & 2032
- Figure 12: North America Miticide for Plant Volume (K), by Country 2024 & 2032
- Figure 13: North America Miticide for Plant Revenue Share (%), by Country 2024 & 2032
- Figure 14: North America Miticide for Plant Volume Share (%), by Country 2024 & 2032
- Figure 15: South America Miticide for Plant Revenue (million), by Application 2024 & 2032
- Figure 16: South America Miticide for Plant Volume (K), by Application 2024 & 2032
- Figure 17: South America Miticide for Plant Revenue Share (%), by Application 2024 & 2032
- Figure 18: South America Miticide for Plant Volume Share (%), by Application 2024 & 2032
- Figure 19: South America Miticide for Plant Revenue (million), by Types 2024 & 2032
- Figure 20: South America Miticide for Plant Volume (K), by Types 2024 & 2032
- Figure 21: South America Miticide for Plant Revenue Share (%), by Types 2024 & 2032
- Figure 22: South America Miticide for Plant Volume Share (%), by Types 2024 & 2032
- Figure 23: South America Miticide for Plant Revenue (million), by Country 2024 & 2032
- Figure 24: South America Miticide for Plant Volume (K), by Country 2024 & 2032
- Figure 25: South America Miticide for Plant Revenue Share (%), by Country 2024 & 2032
- Figure 26: South America Miticide for Plant Volume Share (%), by Country 2024 & 2032
- Figure 27: Europe Miticide for Plant Revenue (million), by Application 2024 & 2032
- Figure 28: Europe Miticide for Plant Volume (K), by Application 2024 & 2032
- Figure 29: Europe Miticide for Plant Revenue Share (%), by Application 2024 & 2032
- Figure 30: Europe Miticide for Plant Volume Share (%), by Application 2024 & 2032
- Figure 31: Europe Miticide for Plant Revenue (million), by Types 2024 & 2032
- Figure 32: Europe Miticide for Plant Volume (K), by Types 2024 & 2032
- Figure 33: Europe Miticide for Plant Revenue Share (%), by Types 2024 & 2032
- Figure 34: Europe Miticide for Plant Volume Share (%), by Types 2024 & 2032
- Figure 35: Europe Miticide for Plant Revenue (million), by Country 2024 & 2032
- Figure 36: Europe Miticide for Plant Volume (K), by Country 2024 & 2032
- Figure 37: Europe Miticide for Plant Revenue Share (%), by Country 2024 & 2032
- Figure 38: Europe Miticide for Plant Volume Share (%), by Country 2024 & 2032
- Figure 39: Middle East & Africa Miticide for Plant Revenue (million), by Application 2024 & 2032
- Figure 40: Middle East & Africa Miticide for Plant Volume (K), by Application 2024 & 2032
- Figure 41: Middle East & Africa Miticide for Plant Revenue Share (%), by Application 2024 & 2032
- Figure 42: Middle East & Africa Miticide for Plant Volume Share (%), by Application 2024 & 2032
- Figure 43: Middle East & Africa Miticide for Plant Revenue (million), by Types 2024 & 2032
- Figure 44: Middle East & Africa Miticide for Plant Volume (K), by Types 2024 & 2032
- Figure 45: Middle East & Africa Miticide for Plant Revenue Share (%), by Types 2024 & 2032
- Figure 46: Middle East & Africa Miticide for Plant Volume Share (%), by Types 2024 & 2032
- Figure 47: Middle East & Africa Miticide for Plant Revenue (million), by Country 2024 & 2032
- Figure 48: Middle East & Africa Miticide for Plant Volume (K), by Country 2024 & 2032
- Figure 49: Middle East & Africa Miticide for Plant Revenue Share (%), by Country 2024 & 2032
- Figure 50: Middle East & Africa Miticide for Plant Volume Share (%), by Country 2024 & 2032
- Figure 51: Asia Pacific Miticide for Plant Revenue (million), by Application 2024 & 2032
- Figure 52: Asia Pacific Miticide for Plant Volume (K), by Application 2024 & 2032
- Figure 53: Asia Pacific Miticide for Plant Revenue Share (%), by Application 2024 & 2032
- Figure 54: Asia Pacific Miticide for Plant Volume Share (%), by Application 2024 & 2032
- Figure 55: Asia Pacific Miticide for Plant Revenue (million), by Types 2024 & 2032
- Figure 56: Asia Pacific Miticide for Plant Volume (K), by Types 2024 & 2032
- Figure 57: Asia Pacific Miticide for Plant Revenue Share (%), by Types 2024 & 2032
- Figure 58: Asia Pacific Miticide for Plant Volume Share (%), by Types 2024 & 2032
- Figure 59: Asia Pacific Miticide for Plant Revenue (million), by Country 2024 & 2032
- Figure 60: Asia Pacific Miticide for Plant Volume (K), by Country 2024 & 2032
- Figure 61: Asia Pacific Miticide for Plant Revenue Share (%), by Country 2024 & 2032
- Figure 62: Asia Pacific Miticide for Plant Volume Share (%), by Country 2024 & 2032
List of Tables
- Table 1: Global Miticide for Plant Revenue million Forecast, by Region 2019 & 2032
- Table 2: Global Miticide for Plant Volume K Forecast, by Region 2019 & 2032
- Table 3: Global Miticide for Plant Revenue million Forecast, by Application 2019 & 2032
- Table 4: Global Miticide for Plant Volume K Forecast, by Application 2019 & 2032
- Table 5: Global Miticide for Plant Revenue million Forecast, by Types 2019 & 2032
- Table 6: Global Miticide for Plant Volume K Forecast, by Types 2019 & 2032
- Table 7: Global Miticide for Plant Revenue million Forecast, by Region 2019 & 2032
- Table 8: Global Miticide for Plant Volume K Forecast, by Region 2019 & 2032
- Table 9: Global Miticide for Plant Revenue million Forecast, by Application 2019 & 2032
- Table 10: Global Miticide for Plant Volume K Forecast, by Application 2019 & 2032
- Table 11: Global Miticide for Plant Revenue million Forecast, by Types 2019 & 2032
- Table 12: Global Miticide for Plant Volume K Forecast, by Types 2019 & 2032
- Table 13: Global Miticide for Plant Revenue million Forecast, by Country 2019 & 2032
- Table 14: Global Miticide for Plant Volume K Forecast, by Country 2019 & 2032
- Table 15: United States Miticide for Plant Revenue (million) Forecast, by Application 2019 & 2032
- Table 16: United States Miticide for Plant Volume (K) Forecast, by Application 2019 & 2032
- Table 17: Canada Miticide for Plant Revenue (million) Forecast, by Application 2019 & 2032
- Table 18: Canada Miticide for Plant Volume (K) Forecast, by Application 2019 & 2032
- Table 19: Mexico Miticide for Plant Revenue (million) Forecast, by Application 2019 & 2032
- Table 20: Mexico Miticide for Plant Volume (K) Forecast, by Application 2019 & 2032
- Table 21: Global Miticide for Plant Revenue million Forecast, by Application 2019 & 2032
- Table 22: Global Miticide for Plant Volume K Forecast, by Application 2019 & 2032
- Table 23: Global Miticide for Plant Revenue million Forecast, by Types 2019 & 2032
- Table 24: Global Miticide for Plant Volume K Forecast, by Types 2019 & 2032
- Table 25: Global Miticide for Plant Revenue million Forecast, by Country 2019 & 2032
- Table 26: Global Miticide for Plant Volume K Forecast, by Country 2019 & 2032
- Table 27: Brazil Miticide for Plant Revenue (million) Forecast, by Application 2019 & 2032
- Table 28: Brazil Miticide for Plant Volume (K) Forecast, by Application 2019 & 2032
- Table 29: Argentina Miticide for Plant Revenue (million) Forecast, by Application 2019 & 2032
- Table 30: Argentina Miticide for Plant Volume (K) Forecast, by Application 2019 & 2032
- Table 31: Rest of South America Miticide for Plant Revenue (million) Forecast, by Application 2019 & 2032
- Table 32: Rest of South America Miticide for Plant Volume (K) Forecast, by Application 2019 & 2032
- Table 33: Global Miticide for Plant Revenue million Forecast, by Application 2019 & 2032
- Table 34: Global Miticide for Plant Volume K Forecast, by Application 2019 & 2032
- Table 35: Global Miticide for Plant Revenue million Forecast, by Types 2019 & 2032
- Table 36: Global Miticide for Plant Volume K Forecast, by Types 2019 & 2032
- Table 37: Global Miticide for Plant Revenue million Forecast, by Country 2019 & 2032
- Table 38: Global Miticide for Plant Volume K Forecast, by Country 2019 & 2032
- Table 39: United Kingdom Miticide for Plant Revenue (million) Forecast, by Application 2019 & 2032
- Table 40: United Kingdom Miticide for Plant Volume (K) Forecast, by Application 2019 & 2032
- Table 41: Germany Miticide for Plant Revenue (million) Forecast, by Application 2019 & 2032
- Table 42: Germany Miticide for Plant Volume (K) Forecast, by Application 2019 & 2032
- Table 43: France Miticide for Plant Revenue (million) Forecast, by Application 2019 & 2032
- Table 44: France Miticide for Plant Volume (K) Forecast, by Application 2019 & 2032
- Table 45: Italy Miticide for Plant Revenue (million) Forecast, by Application 2019 & 2032
- Table 46: Italy Miticide for Plant Volume (K) Forecast, by Application 2019 & 2032
- Table 47: Spain Miticide for Plant Revenue (million) Forecast, by Application 2019 & 2032
- Table 48: Spain Miticide for Plant Volume (K) Forecast, by Application 2019 & 2032
- Table 49: Russia Miticide for Plant Revenue (million) Forecast, by Application 2019 & 2032
- Table 50: Russia Miticide for Plant Volume (K) Forecast, by Application 2019 & 2032
- Table 51: Benelux Miticide for Plant Revenue (million) Forecast, by Application 2019 & 2032
- Table 52: Benelux Miticide for Plant Volume (K) Forecast, by Application 2019 & 2032
- Table 53: Nordics Miticide for Plant Revenue (million) Forecast, by Application 2019 & 2032
- Table 54: Nordics Miticide for Plant Volume (K) Forecast, by Application 2019 & 2032
- Table 55: Rest of Europe Miticide for Plant Revenue (million) Forecast, by Application 2019 & 2032
- Table 56: Rest of Europe Miticide for Plant Volume (K) Forecast, by Application 2019 & 2032
- Table 57: Global Miticide for Plant Revenue million Forecast, by Application 2019 & 2032
- Table 58: Global Miticide for Plant Volume K Forecast, by Application 2019 & 2032
- Table 59: Global Miticide for Plant Revenue million Forecast, by Types 2019 & 2032
- Table 60: Global Miticide for Plant Volume K Forecast, by Types 2019 & 2032
- Table 61: Global Miticide for Plant Revenue million Forecast, by Country 2019 & 2032
- Table 62: Global Miticide for Plant Volume K Forecast, by Country 2019 & 2032
- Table 63: Turkey Miticide for Plant Revenue (million) Forecast, by Application 2019 & 2032
- Table 64: Turkey Miticide for Plant Volume (K) Forecast, by Application 2019 & 2032
- Table 65: Israel Miticide for Plant Revenue (million) Forecast, by Application 2019 & 2032
- Table 66: Israel Miticide for Plant Volume (K) Forecast, by Application 2019 & 2032
- Table 67: GCC Miticide for Plant Revenue (million) Forecast, by Application 2019 & 2032
- Table 68: GCC Miticide for Plant Volume (K) Forecast, by Application 2019 & 2032
- Table 69: North Africa Miticide for Plant Revenue (million) Forecast, by Application 2019 & 2032
- Table 70: North Africa Miticide for Plant Volume (K) Forecast, by Application 2019 & 2032
- Table 71: South Africa Miticide for Plant Revenue (million) Forecast, by Application 2019 & 2032
- Table 72: South Africa Miticide for Plant Volume (K) Forecast, by Application 2019 & 2032
- Table 73: Rest of Middle East & Africa Miticide for Plant Revenue (million) Forecast, by Application 2019 & 2032
- Table 74: Rest of Middle East & Africa Miticide for Plant Volume (K) Forecast, by Application 2019 & 2032
- Table 75: Global Miticide for Plant Revenue million Forecast, by Application 2019 & 2032
- Table 76: Global Miticide for Plant Volume K Forecast, by Application 2019 & 2032
- Table 77: Global Miticide for Plant Revenue million Forecast, by Types 2019 & 2032
- Table 78: Global Miticide for Plant Volume K Forecast, by Types 2019 & 2032
- Table 79: Global Miticide for Plant Revenue million Forecast, by Country 2019 & 2032
- Table 80: Global Miticide for Plant Volume K Forecast, by Country 2019 & 2032
- Table 81: China Miticide for Plant Revenue (million) Forecast, by Application 2019 & 2032
- Table 82: China Miticide for Plant Volume (K) Forecast, by Application 2019 & 2032
- Table 83: India Miticide for Plant Revenue (million) Forecast, by Application 2019 & 2032
- Table 84: India Miticide for Plant Volume (K) Forecast, by Application 2019 & 2032
- Table 85: Japan Miticide for Plant Revenue (million) Forecast, by Application 2019 & 2032
- Table 86: Japan Miticide for Plant Volume (K) Forecast, by Application 2019 & 2032
- Table 87: South Korea Miticide for Plant Revenue (million) Forecast, by Application 2019 & 2032
- Table 88: South Korea Miticide for Plant Volume (K) Forecast, by Application 2019 & 2032
- Table 89: ASEAN Miticide for Plant Revenue (million) Forecast, by Application 2019 & 2032
- Table 90: ASEAN Miticide for Plant Volume (K) Forecast, by Application 2019 & 2032
- Table 91: Oceania Miticide for Plant Revenue (million) Forecast, by Application 2019 & 2032
- Table 92: Oceania Miticide for Plant Volume (K) Forecast, by Application 2019 & 2032
- Table 93: Rest of Asia Pacific Miticide for Plant Revenue (million) Forecast, by Application 2019 & 2032
- Table 94: Rest of Asia Pacific Miticide for Plant Volume (K) Forecast, by Application 2019 & 2032
Frequently Asked Questions
1. What is the projected Compound Annual Growth Rate (CAGR) of the Miticide for Plant?
The projected CAGR is approximately XX%.
2. Which companies are prominent players in the Miticide for Plant?
Key companies in the market include BASF, Gowan Company, FMC Corporation, AMVAC Corporation, Bayer, Sumitomo Chemical, Syngenta, Nufarm, Certis Biologicals, Griffin Greenhouse Supplies, Arysta LifeScience, Osho Chemical Industries, Zhejiang WELL-DONE Chemical Co., Ltd, Wynca Group, Shandong Weifang Rainbow Chemical Co., Ltd.
3. What are the main segments of the Miticide for Plant?
The market segments include Application, Types.
4. Can you provide details about the market size?
The market size is estimated to be USD XXX million as of 2022.
5. What are some drivers contributing to market growth?
N/A
6. What are the notable trends driving market growth?
N/A
7. Are there any restraints impacting market growth?
N/A
8. Can you provide examples of recent developments in the market?
N/A
9. What pricing options are available for accessing the report?
Pricing options include single-user, multi-user, and enterprise licenses priced at USD 3350.00, USD 5025.00, and USD 6700.00 respectively.
10. Is the market size provided in terms of value or volume?
The market size is provided in terms of value, measured in million and volume, measured in K.
11. Are there any specific market keywords associated with the report?
Yes, the market keyword associated with the report is "Miticide for Plant," which aids in identifying and referencing the specific market segment covered.
12. How do I determine which pricing option suits my needs best?
The pricing options vary based on user requirements and access needs. Individual users may opt for single-user licenses, while businesses requiring broader access may choose multi-user or enterprise licenses for cost-effective access to the report.
13. Are there any additional resources or data provided in the Miticide for Plant report?
While the report offers comprehensive insights, it's advisable to review the specific contents or supplementary materials provided to ascertain if additional resources or data are available.
14. How can I stay updated on further developments or reports in the Miticide for Plant?
To stay informed about further developments, trends, and reports in the Miticide for Plant, consider subscribing to industry newsletters, following relevant companies and organizations, or regularly checking reputable industry news sources and publications.
Methodology
Step 1 - Identification of Relevant Samples Size from Population Database


Step 2 - Approaches for Defining Global Market Size (Value, Volume* & Price*)

Note*: In applicable scenarios
Step 3 - Data Sources
Primary Research
- Web Analytics
- Survey Reports
- Research Institute
- Latest Research Reports
- Opinion Leaders
Secondary Research
- Annual Reports
- White Paper
- Latest Press Release
- Industry Association
- Paid Database
- Investor Presentations

Step 4 - Data Triangulation
Involves using different sources of information in order to increase the validity of a study
These sources are likely to be stakeholders in a program - participants, other researchers, program staff, other community members, and so on.
Then we put all data in single framework & apply various statistical tools to find out the dynamic on the market.
During the analysis stage, feedback from the stakeholder groups would be compared to determine areas of agreement as well as areas of divergence
