

Key Insights
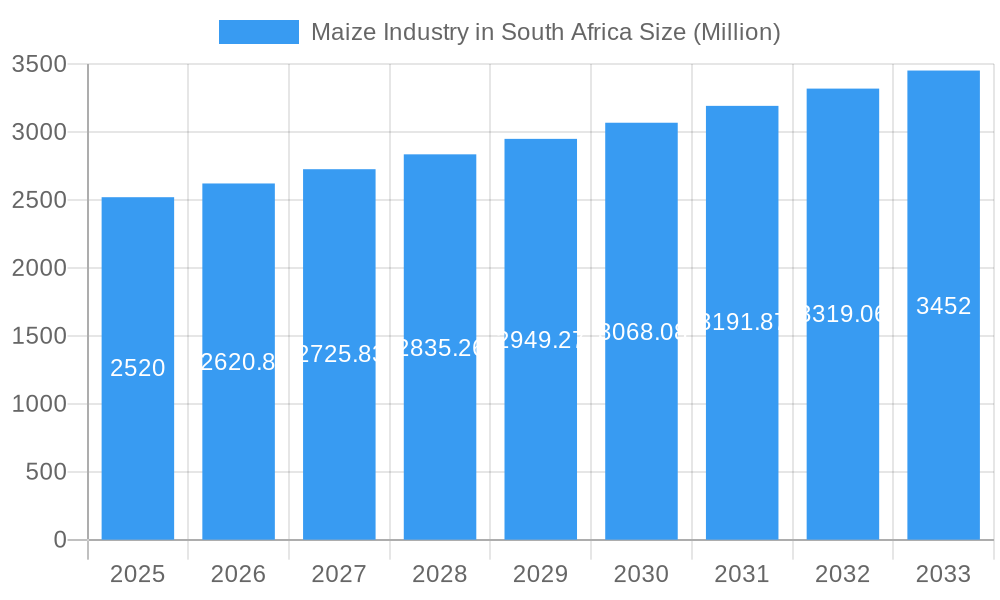
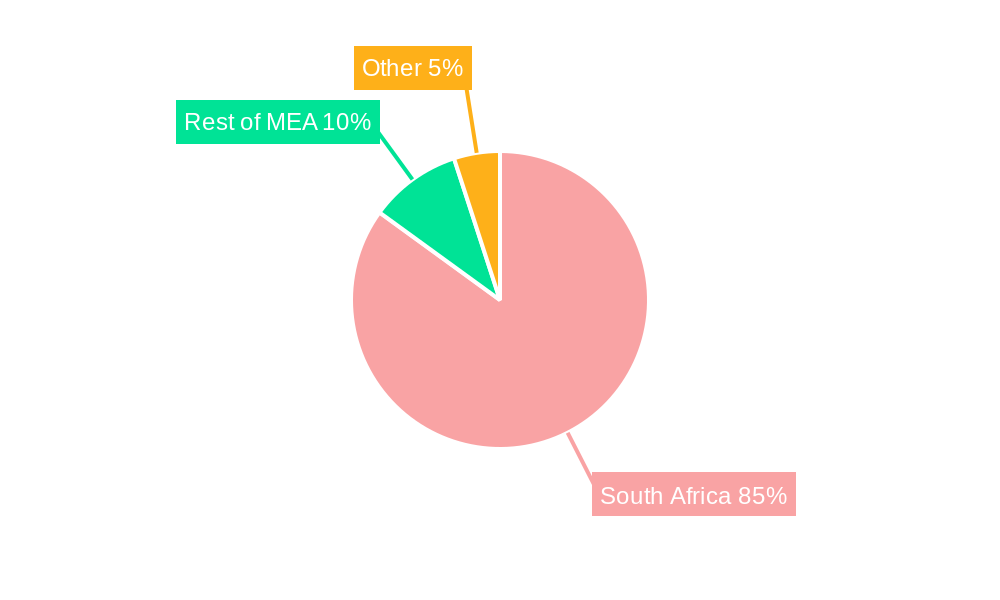
The South African maize industry, valued at $2.52 billion in 2025, exhibits a robust growth trajectory, projected to expand at a compound annual growth rate (CAGR) of 4% from 2025 to 2033. This growth is fueled by several key factors. Increasing demand for maize from the food and beverage sector, driven by a growing population and rising disposable incomes, is a primary driver. The animal feed industry also contributes significantly, with maize serving as a crucial component of livestock diets. Furthermore, the biofuel sector's burgeoning interest in maize as a sustainable feedstock is adding to market expansion. South Africa's favorable climate and established agricultural infrastructure further support this positive outlook. However, the industry faces challenges such as fluctuating weather patterns impacting crop yields, price volatility influenced by global market dynamics, and competition from imported maize. The market is segmented by seed type (hybrid and open-pollinated) and end-use (food and beverages, animal feed, biofuel). Key players like Pioneer Foods, NWK, Tiger Brands, Astral Foods, and AfriSam dominate the market, leveraging their established distribution networks and brand recognition to secure market share. Regional variations exist within South Africa, with certain provinces experiencing higher growth due to superior agricultural conditions and proximity to processing facilities. The Middle East and Africa region, specifically the UAE and Saudi Arabia, also present emerging export opportunities for South African maize producers.
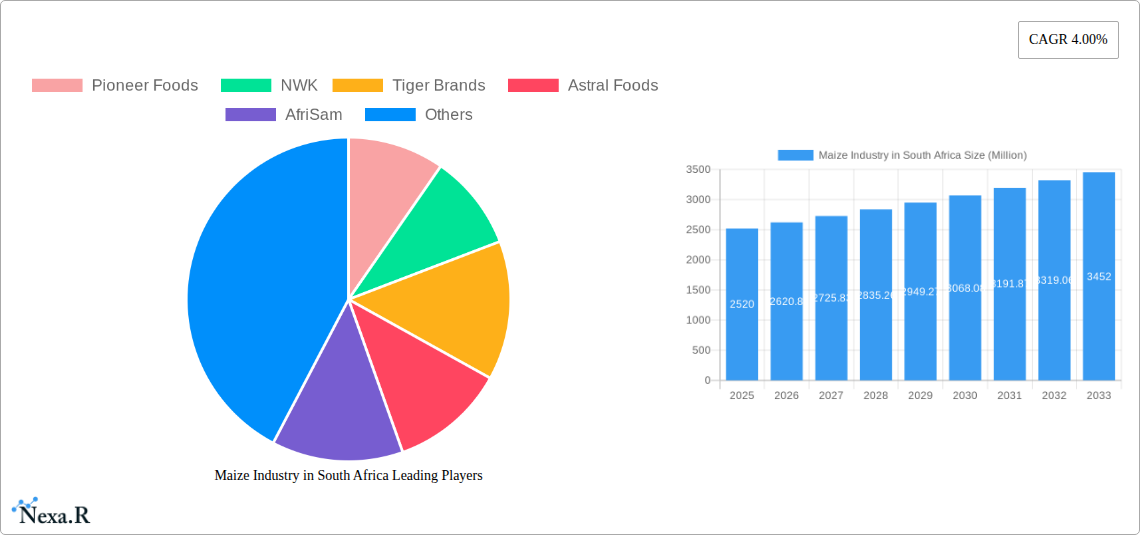
Maize Industry in South Africa Market Size (In Billion)
The forecast period (2025-2033) presents opportunities for strategic investments and expansion within the South African maize industry. Companies focusing on innovation in seed technology, efficient farming practices, and value-added products will be well-positioned for success. Addressing challenges like climate change adaptation and supply chain resilience will be crucial for sustainable growth. Market players are increasingly focusing on developing drought-resistant hybrid seed varieties and implementing precision agriculture techniques to mitigate the impact of unpredictable weather conditions. Collaboration across the value chain, from farmers to processors and exporters, will be key to unlocking the full potential of this dynamic market and ensuring its long-term viability and competitiveness in the global maize market.
Maize Industry in South Africa Company Market Share
Maize Industry in South Africa: A Comprehensive Market Report (2019-2033)
This in-depth report provides a comprehensive analysis of the South African maize industry, encompassing market dynamics, growth trends, key players, and future outlook. With a focus on both the parent market (agricultural commodities) and child markets (seed types, end-use applications), this report is essential for industry professionals, investors, and stakeholders seeking to understand this vital sector. The study period covers 2019-2033, with a base year of 2025 and a forecast period of 2025-2033. Historical data from 2019-2024 is also included. Market values are presented in millions.
Maize Industry in South Africa Market Dynamics & Structure
The South African maize industry exhibits a moderately concentrated market structure, with a few dominant players controlling significant market share. Pioneer Foods, NWK, Tiger Brands, Astral Foods, and AfriSam are key players, though their exact market share percentages vary across segments and are subject to ongoing mergers and acquisitions (M&A) activity. Technological innovation, particularly in seed technology (e.g., hybrid seeds with enhanced pest resistance) and agricultural practices, is a significant driver. Regulatory frameworks, including those governing GMOs and agricultural subsidies, influence market dynamics. Competitive substitutes, such as sorghum and other grains, present alternative options for certain end-use applications. End-user demographics, encompassing food processors, animal feed manufacturers, and biofuel producers, shape demand patterns.
- Market Concentration: Moderately concentrated, with top 5 players controlling xx% of the market (2024 estimate).
- M&A Activity: An average of xx M&A deals per year in the historical period (2019-2024).
- Technological Innovation: Significant advancements in hybrid seed technology and precision agriculture are driving productivity gains.
- Regulatory Landscape: Regulations regarding GMOs and agricultural practices significantly impact the market.
- Competitive Substitutes: Sorghum and other grains pose competition in certain market segments.
Maize Industry in South Africa Growth Trends & Insights
The South African maize market experienced fluctuating growth during the historical period (2019-2024), influenced by factors such as weather patterns, government policies, and global commodity prices. The market size in 2024 is estimated at xx million. The compound annual growth rate (CAGR) from 2019 to 2024 was xx%, with variations across different segments. Technological disruptions, such as the adoption of precision agriculture techniques and improved seed varieties, have enhanced productivity and efficiency. Consumer behavior shifts, driven by increasing health consciousness and demand for value-added maize products, are also impacting market dynamics. Market penetration of hybrid seeds is expected to continue to rise in the forecast period. The projected market size for 2025 is xx million, with a forecasted CAGR of xx% from 2025-2033. Increased adoption of drought-resistant varieties is expected to mitigate the impact of climate change.
Dominant Regions, Countries, or Segments in Maize Industry in South Africa
The Free State and North West provinces are dominant regions in maize production in South Africa. Hybrid seeds dominate the seed market due to higher yields and improved traits. The food and beverage segment is the largest end-use application, followed by animal feed and a nascent biofuel industry.
- Leading Region: Free State and North West Provinces account for xx% of total production (2024 estimate).
- Dominant Seed Type: Hybrid seeds represent xx% of the market share due to superior yields and improved characteristics (2024 estimate).
- Largest End-Use Segment: Food and Beverages holds the largest market share at xx% (2024 estimate)
- Key Drivers: Favorable climate, government support, and efficient irrigation systems contribute to regional dominance. Growing population and increasing disposable income drive food and beverage demand.
Maize Industry in South Africa Product Landscape
The South African maize industry offers a range of products, from conventional maize grain to value-added products such as maize meal, flour, and starches. Recent product innovations include hybrid seeds with enhanced pest and drought resistance, alongside genetically modified varieties (GMOs) entering the market. These products offer farmers higher yields, improved pest management, and enhanced drought tolerance, ultimately impacting food security and profitability. Technological advancements in seed breeding, precision agriculture, and post-harvest technologies further enhance product quality and efficiency.
Key Drivers, Barriers & Challenges in Maize Industry in South Africa
Key Drivers:
- Favorable climatic conditions in certain regions.
- Government support through subsidies and agricultural policies.
- Growing domestic demand for maize-based products.
- Export opportunities to neighboring countries.
Challenges & Restraints:
- Climate change and unpredictable weather patterns impacting yields (estimated annual loss of xx million due to drought in the historical period).
- High input costs (fertilizers, pesticides, labor) reducing profitability.
- Limited access to technology and resources for smallholder farmers (impact estimated at xx% reduction in yield for smallholders compared to large-scale farmers).
- Competition from imported maize products.
Emerging Opportunities in Maize Industry in South Africa
- Growing demand for processed maize products and value-added foods.
- Development of new maize varieties tailored to specific needs.
- Expansion into the biofuel sector.
- Utilizing technology to improve efficiency and sustainability.
Growth Accelerators in the Maize Industry in South Africa Industry
Technological advancements, particularly in seed technology and precision agriculture, are key catalysts for long-term growth. Strategic partnerships between seed companies, agricultural technology providers, and farmers can accelerate adoption. Expanding export markets and developing value-added products will boost industry revenue. Investment in research and development will lead to the creation of more resilient and higher-yielding maize varieties, contributing to sustainable growth in the long term.
Key Players Shaping the Maize Industry in South Africa Market
- Pioneer Foods
- NWK
- Tiger Brands
- Astral Foods
- AfriSam
Notable Milestones in Maize Industry in South Africa Sector
- March 2022: Corteva Agriscience launched Pannar and Pioneer seeds with PowerCore technology, enhancing pest resistance.
- June 2022: The Tela GMO maize variety, resistant to pests and drought, is set for trials in South Africa.
- August 2022: The University of the Free State and Grain South Africa partnered to develop nutritious maize products for low-income communities.
In-Depth Maize Industry in South Africa Market Outlook
The South African maize industry is poised for continued growth, driven by technological advancements, increased demand for value-added products, and the potential expansion into biofuels. Strategic investments in research and development, sustainable agricultural practices, and improved infrastructure will be crucial for realizing the industry's full potential. The market is expected to see a steady increase in production and consumption, contributing to food security and economic growth in the country. The focus on developing drought-resistant varieties will also positively influence future production despite climate change challenges.
Maize Industry in South Africa Segmentation
- 1. Production Analysis (Volume)
- 2. Consumption Analysis (Value and Volume)
- 3. Import Analysis (Value and Volume)
- 4. Export Analysis (Value and Volume)
- 5. Price Trend Analysis
- 6. Production Analysis (Volume)
- 7. Consumption Analysis (Value and Volume)
- 8. Import Analysis (Value and Volume)
- 9. Export Analysis (Value and Volume)
- 10. Price Trend Analysis
Maize Industry in South Africa Segmentation By Geography
-
1. North America
- 1.1. United States
- 1.2. Canada
- 1.3. Mexico
-
2. South America
- 2.1. Brazil
- 2.2. Argentina
- 2.3. Rest of South America
-
3. Europe
- 3.1. United Kingdom
- 3.2. Germany
- 3.3. France
- 3.4. Italy
- 3.5. Spain
- 3.6. Russia
- 3.7. Benelux
- 3.8. Nordics
- 3.9. Rest of Europe
-
4. Middle East & Africa
- 4.1. Turkey
- 4.2. Israel
- 4.3. GCC
- 4.4. North Africa
- 4.5. South Africa
- 4.6. Rest of Middle East & Africa
-
5. Asia Pacific
- 5.1. China
- 5.2. India
- 5.3. Japan
- 5.4. South Korea
- 5.5. ASEAN
- 5.6. Oceania
- 5.7. Rest of Asia Pacific
Maize Industry in South Africa Regional Market Share
Geographic Coverage of Maize Industry in South Africa
Maize Industry in South Africa REPORT HIGHLIGHTS
| Aspects | Details |
|---|---|
| Study Period | 2020-2034 |
| Base Year | 2025 |
| Estimated Year | 2026 |
| Forecast Period | 2026-2034 |
| Historical Period | 2020-2025 |
| Growth Rate | CAGR of 4.00% from 2020-2034 |
| Segmentation |
|
Table of Contents
- 1. Introduction
- 1.1. Research Scope
- 1.2. Market Segmentation
- 1.3. Research Objective
- 1.4. Definitions and Assumptions
- 2. Executive Summary
- 2.1. Market Snapshot
- 3. Market Dynamics
- 3.1. Market Drivers
- 3.2. Market Restrains
- 3.3. Market Trends
- 3.4. Market Opportunities
- 4. Market Factor Analysis
- 4.1. Porters Five Forces
- 4.1.1. Bargaining Power of Suppliers
- 4.1.2. Bargaining Power of Buyers
- 4.1.3. Threat of New Entrants
- 4.1.4. Threat of Substitutes
- 4.1.5. Competitive Rivalry
- 4.2. PESTEL analysis
- 4.3. BCG Analysis
- 4.3.1. Stars (High Growth, High Market Share)
- 4.3.2. Cash Cows (Low Growth, High Market Share)
- 4.3.3. Question Mark (High Growth, Low Market Share)
- 4.3.4. Dogs (Low Growth, Low Market Share)
- 4.4. Ansoff Matrix Analysis
- 4.5. Supply Chain Analysis
- 4.6. Regulatory Landscape
- 4.7. Current Market Potential and Opportunity Assessment (TAM–SAM–SOM Framework)
- 4.8. NRP Analyst Note
- 4.1. Porters Five Forces
- 5. Market Analysis, Insights and Forecast 2021-2033
- 5.1. Market Analysis, Insights and Forecast - by Production Analysis (Volume)
- 5.2. Market Analysis, Insights and Forecast - by Consumption Analysis (Value and Volume)
- 5.3. Market Analysis, Insights and Forecast - by Import Analysis (Value and Volume)
- 5.4. Market Analysis, Insights and Forecast - by Export Analysis (Value and Volume)
- 5.5. Market Analysis, Insights and Forecast - by Price Trend Analysis
- 5.6. Market Analysis, Insights and Forecast - by Production Analysis (Volume)
- 5.7. Market Analysis, Insights and Forecast - by Consumption Analysis (Value and Volume)
- 5.8. Market Analysis, Insights and Forecast - by Import Analysis (Value and Volume)
- 5.9. Market Analysis, Insights and Forecast - by Export Analysis (Value and Volume)
- 5.10. Market Analysis, Insights and Forecast - by Price Trend Analysis
- 5.11. Market Analysis, Insights and Forecast - by Region
- 5.11.1. North America
- 5.11.2. South America
- 5.11.3. Europe
- 5.11.4. Middle East & Africa
- 5.11.5. Asia Pacific
- 6. Global Maize Industry in South Africa Analysis, Insights and Forecast, 2021-2033
- 6.1. Market Analysis, Insights and Forecast - by Production Analysis (Volume)
- 6.2. Market Analysis, Insights and Forecast - by Consumption Analysis (Value and Volume)
- 6.3. Market Analysis, Insights and Forecast - by Import Analysis (Value and Volume)
- 6.4. Market Analysis, Insights and Forecast - by Export Analysis (Value and Volume)
- 6.5. Market Analysis, Insights and Forecast - by Price Trend Analysis
- 6.6. Market Analysis, Insights and Forecast - by Production Analysis (Volume)
- 6.7. Market Analysis, Insights and Forecast - by Consumption Analysis (Value and Volume)
- 6.8. Market Analysis, Insights and Forecast - by Import Analysis (Value and Volume)
- 6.9. Market Analysis, Insights and Forecast - by Export Analysis (Value and Volume)
- 6.10. Market Analysis, Insights and Forecast - by Price Trend Analysis
- 7. North America Maize Industry in South Africa Analysis, Insights and Forecast, 2020-2032
- 7.1. Market Analysis, Insights and Forecast - by Production Analysis (Volume)
- 7.2. Market Analysis, Insights and Forecast - by Consumption Analysis (Value and Volume)
- 7.3. Market Analysis, Insights and Forecast - by Import Analysis (Value and Volume)
- 7.4. Market Analysis, Insights and Forecast - by Export Analysis (Value and Volume)
- 7.5. Market Analysis, Insights and Forecast - by Price Trend Analysis
- 7.6. Market Analysis, Insights and Forecast - by Production Analysis (Volume)
- 7.7. Market Analysis, Insights and Forecast - by Consumption Analysis (Value and Volume)
- 7.8. Market Analysis, Insights and Forecast - by Import Analysis (Value and Volume)
- 7.9. Market Analysis, Insights and Forecast - by Export Analysis (Value and Volume)
- 7.10. Market Analysis, Insights and Forecast - by Price Trend Analysis
- 8. South America Maize Industry in South Africa Analysis, Insights and Forecast, 2020-2032
- 8.1. Market Analysis, Insights and Forecast - by Production Analysis (Volume)
- 8.2. Market Analysis, Insights and Forecast - by Consumption Analysis (Value and Volume)
- 8.3. Market Analysis, Insights and Forecast - by Import Analysis (Value and Volume)
- 8.4. Market Analysis, Insights and Forecast - by Export Analysis (Value and Volume)
- 8.5. Market Analysis, Insights and Forecast - by Price Trend Analysis
- 8.6. Market Analysis, Insights and Forecast - by Production Analysis (Volume)
- 8.7. Market Analysis, Insights and Forecast - by Consumption Analysis (Value and Volume)
- 8.8. Market Analysis, Insights and Forecast - by Import Analysis (Value and Volume)
- 8.9. Market Analysis, Insights and Forecast - by Export Analysis (Value and Volume)
- 8.10. Market Analysis, Insights and Forecast - by Price Trend Analysis
- 9. Europe Maize Industry in South Africa Analysis, Insights and Forecast, 2020-2032
- 9.1. Market Analysis, Insights and Forecast - by Production Analysis (Volume)
- 9.2. Market Analysis, Insights and Forecast - by Consumption Analysis (Value and Volume)
- 9.3. Market Analysis, Insights and Forecast - by Import Analysis (Value and Volume)
- 9.4. Market Analysis, Insights and Forecast - by Export Analysis (Value and Volume)
- 9.5. Market Analysis, Insights and Forecast - by Price Trend Analysis
- 9.6. Market Analysis, Insights and Forecast - by Production Analysis (Volume)
- 9.7. Market Analysis, Insights and Forecast - by Consumption Analysis (Value and Volume)
- 9.8. Market Analysis, Insights and Forecast - by Import Analysis (Value and Volume)
- 9.9. Market Analysis, Insights and Forecast - by Export Analysis (Value and Volume)
- 9.10. Market Analysis, Insights and Forecast - by Price Trend Analysis
- 10. Middle East & Africa Maize Industry in South Africa Analysis, Insights and Forecast, 2020-2032
- 10.1. Market Analysis, Insights and Forecast - by Production Analysis (Volume)
- 10.2. Market Analysis, Insights and Forecast - by Consumption Analysis (Value and Volume)
- 10.3. Market Analysis, Insights and Forecast - by Import Analysis (Value and Volume)
- 10.4. Market Analysis, Insights and Forecast - by Export Analysis (Value and Volume)
- 10.5. Market Analysis, Insights and Forecast - by Price Trend Analysis
- 10.6. Market Analysis, Insights and Forecast - by Production Analysis (Volume)
- 10.7. Market Analysis, Insights and Forecast - by Consumption Analysis (Value and Volume)
- 10.8. Market Analysis, Insights and Forecast - by Import Analysis (Value and Volume)
- 10.9. Market Analysis, Insights and Forecast - by Export Analysis (Value and Volume)
- 10.10. Market Analysis, Insights and Forecast - by Price Trend Analysis
- 11. Asia Pacific Maize Industry in South Africa Analysis, Insights and Forecast, 2020-2032
- 11.1. Market Analysis, Insights and Forecast - by Production Analysis (Volume)
- 11.2. Market Analysis, Insights and Forecast - by Consumption Analysis (Value and Volume)
- 11.3. Market Analysis, Insights and Forecast - by Import Analysis (Value and Volume)
- 11.4. Market Analysis, Insights and Forecast - by Export Analysis (Value and Volume)
- 11.5. Market Analysis, Insights and Forecast - by Price Trend Analysis
- 11.6. Market Analysis, Insights and Forecast - by Production Analysis (Volume)
- 11.7. Market Analysis, Insights and Forecast - by Consumption Analysis (Value and Volume)
- 11.8. Market Analysis, Insights and Forecast - by Import Analysis (Value and Volume)
- 11.9. Market Analysis, Insights and Forecast - by Export Analysis (Value and Volume)
- 11.10. Market Analysis, Insights and Forecast - by Price Trend Analysis
- 12. Competitive Analysis
- 12.1. Company Profiles
- 12.1.1 Pioneer Foods
- 12.1.1.1. Company Overview
- 12.1.1.2. Products
- 12.1.1.3. Company Financials
- 12.1.1.4. SWOT Analysis
- 12.1.2 NWK
- 12.1.2.1. Company Overview
- 12.1.2.2. Products
- 12.1.2.3. Company Financials
- 12.1.2.4. SWOT Analysis
- 12.1.3 Tiger Brands
- 12.1.3.1. Company Overview
- 12.1.3.2. Products
- 12.1.3.3. Company Financials
- 12.1.3.4. SWOT Analysis
- 12.1.4 Astral Foods
- 12.1.4.1. Company Overview
- 12.1.4.2. Products
- 12.1.4.3. Company Financials
- 12.1.4.4. SWOT Analysis
- 12.1.5 AfriSam
- 12.1.5.1. Company Overview
- 12.1.5.2. Products
- 12.1.5.3. Company Financials
- 12.1.5.4. SWOT Analysis
- 12.1.1 Pioneer Foods
- 12.2. Market Entropy
- 12.2.1 Company's Key Areas Served
- 12.2.2 Recent Developments
- 12.3. Company Market Share Analysis 2025
- 12.3.1 Top 5 Companies Market Share Analysis
- 12.3.2 Top 3 Companies Market Share Analysis
- 12.4. List of Potential Customers
- 13. Research Methodology
List of Figures
- Figure 1: Global Maize Industry in South Africa Revenue Breakdown (Million, %) by Region 2025 & 2033
- Figure 2: Global Maize Industry in South Africa Volume Breakdown (K Units, %) by Region 2025 & 2033
- Figure 3: North America Maize Industry in South Africa Revenue (Million), by Production Analysis (Volume) 2025 & 2033
- Figure 4: North America Maize Industry in South Africa Volume (K Units), by Production Analysis (Volume) 2025 & 2033
- Figure 5: North America Maize Industry in South Africa Revenue Share (%), by Production Analysis (Volume) 2025 & 2033
- Figure 6: North America Maize Industry in South Africa Volume Share (%), by Production Analysis (Volume) 2025 & 2033
- Figure 7: North America Maize Industry in South Africa Revenue (Million), by Consumption Analysis (Value and Volume) 2025 & 2033
- Figure 8: North America Maize Industry in South Africa Volume (K Units), by Consumption Analysis (Value and Volume) 2025 & 2033
- Figure 9: North America Maize Industry in South Africa Revenue Share (%), by Consumption Analysis (Value and Volume) 2025 & 2033
- Figure 10: North America Maize Industry in South Africa Volume Share (%), by Consumption Analysis (Value and Volume) 2025 & 2033
- Figure 11: North America Maize Industry in South Africa Revenue (Million), by Import Analysis (Value and Volume) 2025 & 2033
- Figure 12: North America Maize Industry in South Africa Volume (K Units), by Import Analysis (Value and Volume) 2025 & 2033
- Figure 13: North America Maize Industry in South Africa Revenue Share (%), by Import Analysis (Value and Volume) 2025 & 2033
- Figure 14: North America Maize Industry in South Africa Volume Share (%), by Import Analysis (Value and Volume) 2025 & 2033
- Figure 15: North America Maize Industry in South Africa Revenue (Million), by Export Analysis (Value and Volume) 2025 & 2033
- Figure 16: North America Maize Industry in South Africa Volume (K Units), by Export Analysis (Value and Volume) 2025 & 2033
- Figure 17: North America Maize Industry in South Africa Revenue Share (%), by Export Analysis (Value and Volume) 2025 & 2033
- Figure 18: North America Maize Industry in South Africa Volume Share (%), by Export Analysis (Value and Volume) 2025 & 2033
- Figure 19: North America Maize Industry in South Africa Revenue (Million), by Price Trend Analysis 2025 & 2033
- Figure 20: North America Maize Industry in South Africa Volume (K Units), by Price Trend Analysis 2025 & 2033
- Figure 21: North America Maize Industry in South Africa Revenue Share (%), by Price Trend Analysis 2025 & 2033
- Figure 22: North America Maize Industry in South Africa Volume Share (%), by Price Trend Analysis 2025 & 2033
- Figure 23: North America Maize Industry in South Africa Revenue (Million), by Production Analysis (Volume) 2025 & 2033
- Figure 24: North America Maize Industry in South Africa Volume (K Units), by Production Analysis (Volume) 2025 & 2033
- Figure 25: North America Maize Industry in South Africa Revenue Share (%), by Production Analysis (Volume) 2025 & 2033
- Figure 26: North America Maize Industry in South Africa Volume Share (%), by Production Analysis (Volume) 2025 & 2033
- Figure 27: North America Maize Industry in South Africa Revenue (Million), by Consumption Analysis (Value and Volume) 2025 & 2033
- Figure 28: North America Maize Industry in South Africa Volume (K Units), by Consumption Analysis (Value and Volume) 2025 & 2033
- Figure 29: North America Maize Industry in South Africa Revenue Share (%), by Consumption Analysis (Value and Volume) 2025 & 2033
- Figure 30: North America Maize Industry in South Africa Volume Share (%), by Consumption Analysis (Value and Volume) 2025 & 2033
- Figure 31: North America Maize Industry in South Africa Revenue (Million), by Import Analysis (Value and Volume) 2025 & 2033
- Figure 32: North America Maize Industry in South Africa Volume (K Units), by Import Analysis (Value and Volume) 2025 & 2033
- Figure 33: North America Maize Industry in South Africa Revenue Share (%), by Import Analysis (Value and Volume) 2025 & 2033
- Figure 34: North America Maize Industry in South Africa Volume Share (%), by Import Analysis (Value and Volume) 2025 & 2033
- Figure 35: North America Maize Industry in South Africa Revenue (Million), by Export Analysis (Value and Volume) 2025 & 2033
- Figure 36: North America Maize Industry in South Africa Volume (K Units), by Export Analysis (Value and Volume) 2025 & 2033
- Figure 37: North America Maize Industry in South Africa Revenue Share (%), by Export Analysis (Value and Volume) 2025 & 2033
- Figure 38: North America Maize Industry in South Africa Volume Share (%), by Export Analysis (Value and Volume) 2025 & 2033
- Figure 39: North America Maize Industry in South Africa Revenue (Million), by Price Trend Analysis 2025 & 2033
- Figure 40: North America Maize Industry in South Africa Volume (K Units), by Price Trend Analysis 2025 & 2033
- Figure 41: North America Maize Industry in South Africa Revenue Share (%), by Price Trend Analysis 2025 & 2033
- Figure 42: North America Maize Industry in South Africa Volume Share (%), by Price Trend Analysis 2025 & 2033
- Figure 43: North America Maize Industry in South Africa Revenue (Million), by Country 2025 & 2033
- Figure 44: North America Maize Industry in South Africa Volume (K Units), by Country 2025 & 2033
- Figure 45: North America Maize Industry in South Africa Revenue Share (%), by Country 2025 & 2033
- Figure 46: North America Maize Industry in South Africa Volume Share (%), by Country 2025 & 2033
- Figure 47: South America Maize Industry in South Africa Revenue (Million), by Production Analysis (Volume) 2025 & 2033
- Figure 48: South America Maize Industry in South Africa Volume (K Units), by Production Analysis (Volume) 2025 & 2033
- Figure 49: South America Maize Industry in South Africa Revenue Share (%), by Production Analysis (Volume) 2025 & 2033
- Figure 50: South America Maize Industry in South Africa Volume Share (%), by Production Analysis (Volume) 2025 & 2033
- Figure 51: South America Maize Industry in South Africa Revenue (Million), by Consumption Analysis (Value and Volume) 2025 & 2033
- Figure 52: South America Maize Industry in South Africa Volume (K Units), by Consumption Analysis (Value and Volume) 2025 & 2033
- Figure 53: South America Maize Industry in South Africa Revenue Share (%), by Consumption Analysis (Value and Volume) 2025 & 2033
- Figure 54: South America Maize Industry in South Africa Volume Share (%), by Consumption Analysis (Value and Volume) 2025 & 2033
- Figure 55: South America Maize Industry in South Africa Revenue (Million), by Import Analysis (Value and Volume) 2025 & 2033
- Figure 56: South America Maize Industry in South Africa Volume (K Units), by Import Analysis (Value and Volume) 2025 & 2033
- Figure 57: South America Maize Industry in South Africa Revenue Share (%), by Import Analysis (Value and Volume) 2025 & 2033
- Figure 58: South America Maize Industry in South Africa Volume Share (%), by Import Analysis (Value and Volume) 2025 & 2033
- Figure 59: South America Maize Industry in South Africa Revenue (Million), by Export Analysis (Value and Volume) 2025 & 2033
- Figure 60: South America Maize Industry in South Africa Volume (K Units), by Export Analysis (Value and Volume) 2025 & 2033
- Figure 61: South America Maize Industry in South Africa Revenue Share (%), by Export Analysis (Value and Volume) 2025 & 2033
- Figure 62: South America Maize Industry in South Africa Volume Share (%), by Export Analysis (Value and Volume) 2025 & 2033
- Figure 63: South America Maize Industry in South Africa Revenue (Million), by Price Trend Analysis 2025 & 2033
- Figure 64: South America Maize Industry in South Africa Volume (K Units), by Price Trend Analysis 2025 & 2033
- Figure 65: South America Maize Industry in South Africa Revenue Share (%), by Price Trend Analysis 2025 & 2033
- Figure 66: South America Maize Industry in South Africa Volume Share (%), by Price Trend Analysis 2025 & 2033
- Figure 67: South America Maize Industry in South Africa Revenue (Million), by Production Analysis (Volume) 2025 & 2033
- Figure 68: South America Maize Industry in South Africa Volume (K Units), by Production Analysis (Volume) 2025 & 2033
- Figure 69: South America Maize Industry in South Africa Revenue Share (%), by Production Analysis (Volume) 2025 & 2033
- Figure 70: South America Maize Industry in South Africa Volume Share (%), by Production Analysis (Volume) 2025 & 2033
- Figure 71: South America Maize Industry in South Africa Revenue (Million), by Consumption Analysis (Value and Volume) 2025 & 2033
- Figure 72: South America Maize Industry in South Africa Volume (K Units), by Consumption Analysis (Value and Volume) 2025 & 2033
- Figure 73: South America Maize Industry in South Africa Revenue Share (%), by Consumption Analysis (Value and Volume) 2025 & 2033
- Figure 74: South America Maize Industry in South Africa Volume Share (%), by Consumption Analysis (Value and Volume) 2025 & 2033
- Figure 75: South America Maize Industry in South Africa Revenue (Million), by Import Analysis (Value and Volume) 2025 & 2033
- Figure 76: South America Maize Industry in South Africa Volume (K Units), by Import Analysis (Value and Volume) 2025 & 2033
- Figure 77: South America Maize Industry in South Africa Revenue Share (%), by Import Analysis (Value and Volume) 2025 & 2033
- Figure 78: South America Maize Industry in South Africa Volume Share (%), by Import Analysis (Value and Volume) 2025 & 2033
- Figure 79: South America Maize Industry in South Africa Revenue (Million), by Export Analysis (Value and Volume) 2025 & 2033
- Figure 80: South America Maize Industry in South Africa Volume (K Units), by Export Analysis (Value and Volume) 2025 & 2033
- Figure 81: South America Maize Industry in South Africa Revenue Share (%), by Export Analysis (Value and Volume) 2025 & 2033
- Figure 82: South America Maize Industry in South Africa Volume Share (%), by Export Analysis (Value and Volume) 2025 & 2033
- Figure 83: South America Maize Industry in South Africa Revenue (Million), by Price Trend Analysis 2025 & 2033
- Figure 84: South America Maize Industry in South Africa Volume (K Units), by Price Trend Analysis 2025 & 2033
- Figure 85: South America Maize Industry in South Africa Revenue Share (%), by Price Trend Analysis 2025 & 2033
- Figure 86: South America Maize Industry in South Africa Volume Share (%), by Price Trend Analysis 2025 & 2033
- Figure 87: South America Maize Industry in South Africa Revenue (Million), by Country 2025 & 2033
- Figure 88: South America Maize Industry in South Africa Volume (K Units), by Country 2025 & 2033
- Figure 89: South America Maize Industry in South Africa Revenue Share (%), by Country 2025 & 2033
- Figure 90: South America Maize Industry in South Africa Volume Share (%), by Country 2025 & 2033
- Figure 91: Europe Maize Industry in South Africa Revenue (Million), by Production Analysis (Volume) 2025 & 2033
- Figure 92: Europe Maize Industry in South Africa Volume (K Units), by Production Analysis (Volume) 2025 & 2033
- Figure 93: Europe Maize Industry in South Africa Revenue Share (%), by Production Analysis (Volume) 2025 & 2033
- Figure 94: Europe Maize Industry in South Africa Volume Share (%), by Production Analysis (Volume) 2025 & 2033
- Figure 95: Europe Maize Industry in South Africa Revenue (Million), by Consumption Analysis (Value and Volume) 2025 & 2033
- Figure 96: Europe Maize Industry in South Africa Volume (K Units), by Consumption Analysis (Value and Volume) 2025 & 2033
- Figure 97: Europe Maize Industry in South Africa Revenue Share (%), by Consumption Analysis (Value and Volume) 2025 & 2033
- Figure 98: Europe Maize Industry in South Africa Volume Share (%), by Consumption Analysis (Value and Volume) 2025 & 2033
- Figure 99: Europe Maize Industry in South Africa Revenue (Million), by Import Analysis (Value and Volume) 2025 & 2033
- Figure 100: Europe Maize Industry in South Africa Volume (K Units), by Import Analysis (Value and Volume) 2025 & 2033
- Figure 101: Europe Maize Industry in South Africa Revenue Share (%), by Import Analysis (Value and Volume) 2025 & 2033
- Figure 102: Europe Maize Industry in South Africa Volume Share (%), by Import Analysis (Value and Volume) 2025 & 2033
- Figure 103: Europe Maize Industry in South Africa Revenue (Million), by Export Analysis (Value and Volume) 2025 & 2033
- Figure 104: Europe Maize Industry in South Africa Volume (K Units), by Export Analysis (Value and Volume) 2025 & 2033
- Figure 105: Europe Maize Industry in South Africa Revenue Share (%), by Export Analysis (Value and Volume) 2025 & 2033
- Figure 106: Europe Maize Industry in South Africa Volume Share (%), by Export Analysis (Value and Volume) 2025 & 2033
- Figure 107: Europe Maize Industry in South Africa Revenue (Million), by Price Trend Analysis 2025 & 2033
- Figure 108: Europe Maize Industry in South Africa Volume (K Units), by Price Trend Analysis 2025 & 2033
- Figure 109: Europe Maize Industry in South Africa Revenue Share (%), by Price Trend Analysis 2025 & 2033
- Figure 110: Europe Maize Industry in South Africa Volume Share (%), by Price Trend Analysis 2025 & 2033
- Figure 111: Europe Maize Industry in South Africa Revenue (Million), by Production Analysis (Volume) 2025 & 2033
- Figure 112: Europe Maize Industry in South Africa Volume (K Units), by Production Analysis (Volume) 2025 & 2033
- Figure 113: Europe Maize Industry in South Africa Revenue Share (%), by Production Analysis (Volume) 2025 & 2033
- Figure 114: Europe Maize Industry in South Africa Volume Share (%), by Production Analysis (Volume) 2025 & 2033
- Figure 115: Europe Maize Industry in South Africa Revenue (Million), by Consumption Analysis (Value and Volume) 2025 & 2033
- Figure 116: Europe Maize Industry in South Africa Volume (K Units), by Consumption Analysis (Value and Volume) 2025 & 2033
- Figure 117: Europe Maize Industry in South Africa Revenue Share (%), by Consumption Analysis (Value and Volume) 2025 & 2033
- Figure 118: Europe Maize Industry in South Africa Volume Share (%), by Consumption Analysis (Value and Volume) 2025 & 2033
- Figure 119: Europe Maize Industry in South Africa Revenue (Million), by Import Analysis (Value and Volume) 2025 & 2033
- Figure 120: Europe Maize Industry in South Africa Volume (K Units), by Import Analysis (Value and Volume) 2025 & 2033
- Figure 121: Europe Maize Industry in South Africa Revenue Share (%), by Import Analysis (Value and Volume) 2025 & 2033
- Figure 122: Europe Maize Industry in South Africa Volume Share (%), by Import Analysis (Value and Volume) 2025 & 2033
- Figure 123: Europe Maize Industry in South Africa Revenue (Million), by Export Analysis (Value and Volume) 2025 & 2033
- Figure 124: Europe Maize Industry in South Africa Volume (K Units), by Export Analysis (Value and Volume) 2025 & 2033
- Figure 125: Europe Maize Industry in South Africa Revenue Share (%), by Export Analysis (Value and Volume) 2025 & 2033
- Figure 126: Europe Maize Industry in South Africa Volume Share (%), by Export Analysis (Value and Volume) 2025 & 2033
- Figure 127: Europe Maize Industry in South Africa Revenue (Million), by Price Trend Analysis 2025 & 2033
- Figure 128: Europe Maize Industry in South Africa Volume (K Units), by Price Trend Analysis 2025 & 2033
- Figure 129: Europe Maize Industry in South Africa Revenue Share (%), by Price Trend Analysis 2025 & 2033
- Figure 130: Europe Maize Industry in South Africa Volume Share (%), by Price Trend Analysis 2025 & 2033
- Figure 131: Europe Maize Industry in South Africa Revenue (Million), by Country 2025 & 2033
- Figure 132: Europe Maize Industry in South Africa Volume (K Units), by Country 2025 & 2033
- Figure 133: Europe Maize Industry in South Africa Revenue Share (%), by Country 2025 & 2033
- Figure 134: Europe Maize Industry in South Africa Volume Share (%), by Country 2025 & 2033
- Figure 135: Middle East & Africa Maize Industry in South Africa Revenue (Million), by Production Analysis (Volume) 2025 & 2033
- Figure 136: Middle East & Africa Maize Industry in South Africa Volume (K Units), by Production Analysis (Volume) 2025 & 2033
- Figure 137: Middle East & Africa Maize Industry in South Africa Revenue Share (%), by Production Analysis (Volume) 2025 & 2033
- Figure 138: Middle East & Africa Maize Industry in South Africa Volume Share (%), by Production Analysis (Volume) 2025 & 2033
- Figure 139: Middle East & Africa Maize Industry in South Africa Revenue (Million), by Consumption Analysis (Value and Volume) 2025 & 2033
- Figure 140: Middle East & Africa Maize Industry in South Africa Volume (K Units), by Consumption Analysis (Value and Volume) 2025 & 2033
- Figure 141: Middle East & Africa Maize Industry in South Africa Revenue Share (%), by Consumption Analysis (Value and Volume) 2025 & 2033
- Figure 142: Middle East & Africa Maize Industry in South Africa Volume Share (%), by Consumption Analysis (Value and Volume) 2025 & 2033
- Figure 143: Middle East & Africa Maize Industry in South Africa Revenue (Million), by Import Analysis (Value and Volume) 2025 & 2033
- Figure 144: Middle East & Africa Maize Industry in South Africa Volume (K Units), by Import Analysis (Value and Volume) 2025 & 2033
- Figure 145: Middle East & Africa Maize Industry in South Africa Revenue Share (%), by Import Analysis (Value and Volume) 2025 & 2033
- Figure 146: Middle East & Africa Maize Industry in South Africa Volume Share (%), by Import Analysis (Value and Volume) 2025 & 2033
- Figure 147: Middle East & Africa Maize Industry in South Africa Revenue (Million), by Export Analysis (Value and Volume) 2025 & 2033
- Figure 148: Middle East & Africa Maize Industry in South Africa Volume (K Units), by Export Analysis (Value and Volume) 2025 & 2033
- Figure 149: Middle East & Africa Maize Industry in South Africa Revenue Share (%), by Export Analysis (Value and Volume) 2025 & 2033
- Figure 150: Middle East & Africa Maize Industry in South Africa Volume Share (%), by Export Analysis (Value and Volume) 2025 & 2033
- Figure 151: Middle East & Africa Maize Industry in South Africa Revenue (Million), by Price Trend Analysis 2025 & 2033
- Figure 152: Middle East & Africa Maize Industry in South Africa Volume (K Units), by Price Trend Analysis 2025 & 2033
- Figure 153: Middle East & Africa Maize Industry in South Africa Revenue Share (%), by Price Trend Analysis 2025 & 2033
- Figure 154: Middle East & Africa Maize Industry in South Africa Volume Share (%), by Price Trend Analysis 2025 & 2033
- Figure 155: Middle East & Africa Maize Industry in South Africa Revenue (Million), by Production Analysis (Volume) 2025 & 2033
- Figure 156: Middle East & Africa Maize Industry in South Africa Volume (K Units), by Production Analysis (Volume) 2025 & 2033
- Figure 157: Middle East & Africa Maize Industry in South Africa Revenue Share (%), by Production Analysis (Volume) 2025 & 2033
- Figure 158: Middle East & Africa Maize Industry in South Africa Volume Share (%), by Production Analysis (Volume) 2025 & 2033
- Figure 159: Middle East & Africa Maize Industry in South Africa Revenue (Million), by Consumption Analysis (Value and Volume) 2025 & 2033
- Figure 160: Middle East & Africa Maize Industry in South Africa Volume (K Units), by Consumption Analysis (Value and Volume) 2025 & 2033
- Figure 161: Middle East & Africa Maize Industry in South Africa Revenue Share (%), by Consumption Analysis (Value and Volume) 2025 & 2033
- Figure 162: Middle East & Africa Maize Industry in South Africa Volume Share (%), by Consumption Analysis (Value and Volume) 2025 & 2033
- Figure 163: Middle East & Africa Maize Industry in South Africa Revenue (Million), by Import Analysis (Value and Volume) 2025 & 2033
- Figure 164: Middle East & Africa Maize Industry in South Africa Volume (K Units), by Import Analysis (Value and Volume) 2025 & 2033
- Figure 165: Middle East & Africa Maize Industry in South Africa Revenue Share (%), by Import Analysis (Value and Volume) 2025 & 2033
- Figure 166: Middle East & Africa Maize Industry in South Africa Volume Share (%), by Import Analysis (Value and Volume) 2025 & 2033
- Figure 167: Middle East & Africa Maize Industry in South Africa Revenue (Million), by Export Analysis (Value and Volume) 2025 & 2033
- Figure 168: Middle East & Africa Maize Industry in South Africa Volume (K Units), by Export Analysis (Value and Volume) 2025 & 2033
- Figure 169: Middle East & Africa Maize Industry in South Africa Revenue Share (%), by Export Analysis (Value and Volume) 2025 & 2033
- Figure 170: Middle East & Africa Maize Industry in South Africa Volume Share (%), by Export Analysis (Value and Volume) 2025 & 2033
- Figure 171: Middle East & Africa Maize Industry in South Africa Revenue (Million), by Price Trend Analysis 2025 & 2033
- Figure 172: Middle East & Africa Maize Industry in South Africa Volume (K Units), by Price Trend Analysis 2025 & 2033
- Figure 173: Middle East & Africa Maize Industry in South Africa Revenue Share (%), by Price Trend Analysis 2025 & 2033
- Figure 174: Middle East & Africa Maize Industry in South Africa Volume Share (%), by Price Trend Analysis 2025 & 2033
- Figure 175: Middle East & Africa Maize Industry in South Africa Revenue (Million), by Country 2025 & 2033
- Figure 176: Middle East & Africa Maize Industry in South Africa Volume (K Units), by Country 2025 & 2033
- Figure 177: Middle East & Africa Maize Industry in South Africa Revenue Share (%), by Country 2025 & 2033
- Figure 178: Middle East & Africa Maize Industry in South Africa Volume Share (%), by Country 2025 & 2033
- Figure 179: Asia Pacific Maize Industry in South Africa Revenue (Million), by Production Analysis (Volume) 2025 & 2033
- Figure 180: Asia Pacific Maize Industry in South Africa Volume (K Units), by Production Analysis (Volume) 2025 & 2033
- Figure 181: Asia Pacific Maize Industry in South Africa Revenue Share (%), by Production Analysis (Volume) 2025 & 2033
- Figure 182: Asia Pacific Maize Industry in South Africa Volume Share (%), by Production Analysis (Volume) 2025 & 2033
- Figure 183: Asia Pacific Maize Industry in South Africa Revenue (Million), by Consumption Analysis (Value and Volume) 2025 & 2033
- Figure 184: Asia Pacific Maize Industry in South Africa Volume (K Units), by Consumption Analysis (Value and Volume) 2025 & 2033
- Figure 185: Asia Pacific Maize Industry in South Africa Revenue Share (%), by Consumption Analysis (Value and Volume) 2025 & 2033
- Figure 186: Asia Pacific Maize Industry in South Africa Volume Share (%), by Consumption Analysis (Value and Volume) 2025 & 2033
- Figure 187: Asia Pacific Maize Industry in South Africa Revenue (Million), by Import Analysis (Value and Volume) 2025 & 2033
- Figure 188: Asia Pacific Maize Industry in South Africa Volume (K Units), by Import Analysis (Value and Volume) 2025 & 2033
- Figure 189: Asia Pacific Maize Industry in South Africa Revenue Share (%), by Import Analysis (Value and Volume) 2025 & 2033
- Figure 190: Asia Pacific Maize Industry in South Africa Volume Share (%), by Import Analysis (Value and Volume) 2025 & 2033
- Figure 191: Asia Pacific Maize Industry in South Africa Revenue (Million), by Export Analysis (Value and Volume) 2025 & 2033
- Figure 192: Asia Pacific Maize Industry in South Africa Volume (K Units), by Export Analysis (Value and Volume) 2025 & 2033
- Figure 193: Asia Pacific Maize Industry in South Africa Revenue Share (%), by Export Analysis (Value and Volume) 2025 & 2033
- Figure 194: Asia Pacific Maize Industry in South Africa Volume Share (%), by Export Analysis (Value and Volume) 2025 & 2033
- Figure 195: Asia Pacific Maize Industry in South Africa Revenue (Million), by Price Trend Analysis 2025 & 2033
- Figure 196: Asia Pacific Maize Industry in South Africa Volume (K Units), by Price Trend Analysis 2025 & 2033
- Figure 197: Asia Pacific Maize Industry in South Africa Revenue Share (%), by Price Trend Analysis 2025 & 2033
- Figure 198: Asia Pacific Maize Industry in South Africa Volume Share (%), by Price Trend Analysis 2025 & 2033
- Figure 199: Asia Pacific Maize Industry in South Africa Revenue (Million), by Production Analysis (Volume) 2025 & 2033
- Figure 200: Asia Pacific Maize Industry in South Africa Volume (K Units), by Production Analysis (Volume) 2025 & 2033
- Figure 201: Asia Pacific Maize Industry in South Africa Revenue Share (%), by Production Analysis (Volume) 2025 & 2033
- Figure 202: Asia Pacific Maize Industry in South Africa Volume Share (%), by Production Analysis (Volume) 2025 & 2033
- Figure 203: Asia Pacific Maize Industry in South Africa Revenue (Million), by Consumption Analysis (Value and Volume) 2025 & 2033
- Figure 204: Asia Pacific Maize Industry in South Africa Volume (K Units), by Consumption Analysis (Value and Volume) 2025 & 2033
- Figure 205: Asia Pacific Maize Industry in South Africa Revenue Share (%), by Consumption Analysis (Value and Volume) 2025 & 2033
- Figure 206: Asia Pacific Maize Industry in South Africa Volume Share (%), by Consumption Analysis (Value and Volume) 2025 & 2033
- Figure 207: Asia Pacific Maize Industry in South Africa Revenue (Million), by Import Analysis (Value and Volume) 2025 & 2033
- Figure 208: Asia Pacific Maize Industry in South Africa Volume (K Units), by Import Analysis (Value and Volume) 2025 & 2033
- Figure 209: Asia Pacific Maize Industry in South Africa Revenue Share (%), by Import Analysis (Value and Volume) 2025 & 2033
- Figure 210: Asia Pacific Maize Industry in South Africa Volume Share (%), by Import Analysis (Value and Volume) 2025 & 2033
- Figure 211: Asia Pacific Maize Industry in South Africa Revenue (Million), by Export Analysis (Value and Volume) 2025 & 2033
- Figure 212: Asia Pacific Maize Industry in South Africa Volume (K Units), by Export Analysis (Value and Volume) 2025 & 2033
- Figure 213: Asia Pacific Maize Industry in South Africa Revenue Share (%), by Export Analysis (Value and Volume) 2025 & 2033
- Figure 214: Asia Pacific Maize Industry in South Africa Volume Share (%), by Export Analysis (Value and Volume) 2025 & 2033
- Figure 215: Asia Pacific Maize Industry in South Africa Revenue (Million), by Price Trend Analysis 2025 & 2033
- Figure 216: Asia Pacific Maize Industry in South Africa Volume (K Units), by Price Trend Analysis 2025 & 2033
- Figure 217: Asia Pacific Maize Industry in South Africa Revenue Share (%), by Price Trend Analysis 2025 & 2033
- Figure 218: Asia Pacific Maize Industry in South Africa Volume Share (%), by Price Trend Analysis 2025 & 2033
- Figure 219: Asia Pacific Maize Industry in South Africa Revenue (Million), by Country 2025 & 2033
- Figure 220: Asia Pacific Maize Industry in South Africa Volume (K Units), by Country 2025 & 2033
- Figure 221: Asia Pacific Maize Industry in South Africa Revenue Share (%), by Country 2025 & 2033
- Figure 222: Asia Pacific Maize Industry in South Africa Volume Share (%), by Country 2025 & 2033
List of Tables
- Table 1: Global Maize Industry in South Africa Revenue Million Forecast, by Production Analysis (Volume) 2020 & 2033
- Table 2: Global Maize Industry in South Africa Volume K Units Forecast, by Production Analysis (Volume) 2020 & 2033
- Table 3: Global Maize Industry in South Africa Revenue Million Forecast, by Consumption Analysis (Value and Volume) 2020 & 2033
- Table 4: Global Maize Industry in South Africa Volume K Units Forecast, by Consumption Analysis (Value and Volume) 2020 & 2033
- Table 5: Global Maize Industry in South Africa Revenue Million Forecast, by Import Analysis (Value and Volume) 2020 & 2033
- Table 6: Global Maize Industry in South Africa Volume K Units Forecast, by Import Analysis (Value and Volume) 2020 & 2033
- Table 7: Global Maize Industry in South Africa Revenue Million Forecast, by Export Analysis (Value and Volume) 2020 & 2033
- Table 8: Global Maize Industry in South Africa Volume K Units Forecast, by Export Analysis (Value and Volume) 2020 & 2033
- Table 9: Global Maize Industry in South Africa Revenue Million Forecast, by Price Trend Analysis 2020 & 2033
- Table 10: Global Maize Industry in South Africa Volume K Units Forecast, by Price Trend Analysis 2020 & 2033
- Table 11: Global Maize Industry in South Africa Revenue Million Forecast, by Production Analysis (Volume) 2020 & 2033
- Table 12: Global Maize Industry in South Africa Volume K Units Forecast, by Production Analysis (Volume) 2020 & 2033
- Table 13: Global Maize Industry in South Africa Revenue Million Forecast, by Consumption Analysis (Value and Volume) 2020 & 2033
- Table 14: Global Maize Industry in South Africa Volume K Units Forecast, by Consumption Analysis (Value and Volume) 2020 & 2033
- Table 15: Global Maize Industry in South Africa Revenue Million Forecast, by Import Analysis (Value and Volume) 2020 & 2033
- Table 16: Global Maize Industry in South Africa Volume K Units Forecast, by Import Analysis (Value and Volume) 2020 & 2033
- Table 17: Global Maize Industry in South Africa Revenue Million Forecast, by Export Analysis (Value and Volume) 2020 & 2033
- Table 18: Global Maize Industry in South Africa Volume K Units Forecast, by Export Analysis (Value and Volume) 2020 & 2033
- Table 19: Global Maize Industry in South Africa Revenue Million Forecast, by Price Trend Analysis 2020 & 2033
- Table 20: Global Maize Industry in South Africa Volume K Units Forecast, by Price Trend Analysis 2020 & 2033
- Table 21: Global Maize Industry in South Africa Revenue Million Forecast, by Region 2020 & 2033
- Table 22: Global Maize Industry in South Africa Volume K Units Forecast, by Region 2020 & 2033
- Table 23: Global Maize Industry in South Africa Revenue Million Forecast, by Production Analysis (Volume) 2020 & 2033
- Table 24: Global Maize Industry in South Africa Volume K Units Forecast, by Production Analysis (Volume) 2020 & 2033
- Table 25: Global Maize Industry in South Africa Revenue Million Forecast, by Consumption Analysis (Value and Volume) 2020 & 2033
- Table 26: Global Maize Industry in South Africa Volume K Units Forecast, by Consumption Analysis (Value and Volume) 2020 & 2033
- Table 27: Global Maize Industry in South Africa Revenue Million Forecast, by Import Analysis (Value and Volume) 2020 & 2033
- Table 28: Global Maize Industry in South Africa Volume K Units Forecast, by Import Analysis (Value and Volume) 2020 & 2033
- Table 29: Global Maize Industry in South Africa Revenue Million Forecast, by Export Analysis (Value and Volume) 2020 & 2033
- Table 30: Global Maize Industry in South Africa Volume K Units Forecast, by Export Analysis (Value and Volume) 2020 & 2033
- Table 31: Global Maize Industry in South Africa Revenue Million Forecast, by Price Trend Analysis 2020 & 2033
- Table 32: Global Maize Industry in South Africa Volume K Units Forecast, by Price Trend Analysis 2020 & 2033
- Table 33: Global Maize Industry in South Africa Revenue Million Forecast, by Production Analysis (Volume) 2020 & 2033
- Table 34: Global Maize Industry in South Africa Volume K Units Forecast, by Production Analysis (Volume) 2020 & 2033
- Table 35: Global Maize Industry in South Africa Revenue Million Forecast, by Consumption Analysis (Value and Volume) 2020 & 2033
- Table 36: Global Maize Industry in South Africa Volume K Units Forecast, by Consumption Analysis (Value and Volume) 2020 & 2033
- Table 37: Global Maize Industry in South Africa Revenue Million Forecast, by Import Analysis (Value and Volume) 2020 & 2033
- Table 38: Global Maize Industry in South Africa Volume K Units Forecast, by Import Analysis (Value and Volume) 2020 & 2033
- Table 39: Global Maize Industry in South Africa Revenue Million Forecast, by Export Analysis (Value and Volume) 2020 & 2033
- Table 40: Global Maize Industry in South Africa Volume K Units Forecast, by Export Analysis (Value and Volume) 2020 & 2033
- Table 41: Global Maize Industry in South Africa Revenue Million Forecast, by Price Trend Analysis 2020 & 2033
- Table 42: Global Maize Industry in South Africa Volume K Units Forecast, by Price Trend Analysis 2020 & 2033
- Table 43: Global Maize Industry in South Africa Revenue Million Forecast, by Country 2020 & 2033
- Table 44: Global Maize Industry in South Africa Volume K Units Forecast, by Country 2020 & 2033
- Table 45: United States Maize Industry in South Africa Revenue (Million) Forecast, by Application 2020 & 2033
- Table 46: United States Maize Industry in South Africa Volume (K Units) Forecast, by Application 2020 & 2033
- Table 47: Canada Maize Industry in South Africa Revenue (Million) Forecast, by Application 2020 & 2033
- Table 48: Canada Maize Industry in South Africa Volume (K Units) Forecast, by Application 2020 & 2033
- Table 49: Mexico Maize Industry in South Africa Revenue (Million) Forecast, by Application 2020 & 2033
- Table 50: Mexico Maize Industry in South Africa Volume (K Units) Forecast, by Application 2020 & 2033
- Table 51: Global Maize Industry in South Africa Revenue Million Forecast, by Production Analysis (Volume) 2020 & 2033
- Table 52: Global Maize Industry in South Africa Volume K Units Forecast, by Production Analysis (Volume) 2020 & 2033
- Table 53: Global Maize Industry in South Africa Revenue Million Forecast, by Consumption Analysis (Value and Volume) 2020 & 2033
- Table 54: Global Maize Industry in South Africa Volume K Units Forecast, by Consumption Analysis (Value and Volume) 2020 & 2033
- Table 55: Global Maize Industry in South Africa Revenue Million Forecast, by Import Analysis (Value and Volume) 2020 & 2033
- Table 56: Global Maize Industry in South Africa Volume K Units Forecast, by Import Analysis (Value and Volume) 2020 & 2033
- Table 57: Global Maize Industry in South Africa Revenue Million Forecast, by Export Analysis (Value and Volume) 2020 & 2033
- Table 58: Global Maize Industry in South Africa Volume K Units Forecast, by Export Analysis (Value and Volume) 2020 & 2033
- Table 59: Global Maize Industry in South Africa Revenue Million Forecast, by Price Trend Analysis 2020 & 2033
- Table 60: Global Maize Industry in South Africa Volume K Units Forecast, by Price Trend Analysis 2020 & 2033
- Table 61: Global Maize Industry in South Africa Revenue Million Forecast, by Production Analysis (Volume) 2020 & 2033
- Table 62: Global Maize Industry in South Africa Volume K Units Forecast, by Production Analysis (Volume) 2020 & 2033
- Table 63: Global Maize Industry in South Africa Revenue Million Forecast, by Consumption Analysis (Value and Volume) 2020 & 2033
- Table 64: Global Maize Industry in South Africa Volume K Units Forecast, by Consumption Analysis (Value and Volume) 2020 & 2033
- Table 65: Global Maize Industry in South Africa Revenue Million Forecast, by Import Analysis (Value and Volume) 2020 & 2033
- Table 66: Global Maize Industry in South Africa Volume K Units Forecast, by Import Analysis (Value and Volume) 2020 & 2033
- Table 67: Global Maize Industry in South Africa Revenue Million Forecast, by Export Analysis (Value and Volume) 2020 & 2033
- Table 68: Global Maize Industry in South Africa Volume K Units Forecast, by Export Analysis (Value and Volume) 2020 & 2033
- Table 69: Global Maize Industry in South Africa Revenue Million Forecast, by Price Trend Analysis 2020 & 2033
- Table 70: Global Maize Industry in South Africa Volume K Units Forecast, by Price Trend Analysis 2020 & 2033
- Table 71: Global Maize Industry in South Africa Revenue Million Forecast, by Country 2020 & 2033
- Table 72: Global Maize Industry in South Africa Volume K Units Forecast, by Country 2020 & 2033
- Table 73: Brazil Maize Industry in South Africa Revenue (Million) Forecast, by Application 2020 & 2033
- Table 74: Brazil Maize Industry in South Africa Volume (K Units) Forecast, by Application 2020 & 2033
- Table 75: Argentina Maize Industry in South Africa Revenue (Million) Forecast, by Application 2020 & 2033
- Table 76: Argentina Maize Industry in South Africa Volume (K Units) Forecast, by Application 2020 & 2033
- Table 77: Rest of South America Maize Industry in South Africa Revenue (Million) Forecast, by Application 2020 & 2033
- Table 78: Rest of South America Maize Industry in South Africa Volume (K Units) Forecast, by Application 2020 & 2033
- Table 79: Global Maize Industry in South Africa Revenue Million Forecast, by Production Analysis (Volume) 2020 & 2033
- Table 80: Global Maize Industry in South Africa Volume K Units Forecast, by Production Analysis (Volume) 2020 & 2033
- Table 81: Global Maize Industry in South Africa Revenue Million Forecast, by Consumption Analysis (Value and Volume) 2020 & 2033
- Table 82: Global Maize Industry in South Africa Volume K Units Forecast, by Consumption Analysis (Value and Volume) 2020 & 2033
- Table 83: Global Maize Industry in South Africa Revenue Million Forecast, by Import Analysis (Value and Volume) 2020 & 2033
- Table 84: Global Maize Industry in South Africa Volume K Units Forecast, by Import Analysis (Value and Volume) 2020 & 2033
- Table 85: Global Maize Industry in South Africa Revenue Million Forecast, by Export Analysis (Value and Volume) 2020 & 2033
- Table 86: Global Maize Industry in South Africa Volume K Units Forecast, by Export Analysis (Value and Volume) 2020 & 2033
- Table 87: Global Maize Industry in South Africa Revenue Million Forecast, by Price Trend Analysis 2020 & 2033
- Table 88: Global Maize Industry in South Africa Volume K Units Forecast, by Price Trend Analysis 2020 & 2033
- Table 89: Global Maize Industry in South Africa Revenue Million Forecast, by Production Analysis (Volume) 2020 & 2033
- Table 90: Global Maize Industry in South Africa Volume K Units Forecast, by Production Analysis (Volume) 2020 & 2033
- Table 91: Global Maize Industry in South Africa Revenue Million Forecast, by Consumption Analysis (Value and Volume) 2020 & 2033
- Table 92: Global Maize Industry in South Africa Volume K Units Forecast, by Consumption Analysis (Value and Volume) 2020 & 2033
- Table 93: Global Maize Industry in South Africa Revenue Million Forecast, by Import Analysis (Value and Volume) 2020 & 2033
- Table 94: Global Maize Industry in South Africa Volume K Units Forecast, by Import Analysis (Value and Volume) 2020 & 2033
- Table 95: Global Maize Industry in South Africa Revenue Million Forecast, by Export Analysis (Value and Volume) 2020 & 2033
- Table 96: Global Maize Industry in South Africa Volume K Units Forecast, by Export Analysis (Value and Volume) 2020 & 2033
- Table 97: Global Maize Industry in South Africa Revenue Million Forecast, by Price Trend Analysis 2020 & 2033
- Table 98: Global Maize Industry in South Africa Volume K Units Forecast, by Price Trend Analysis 2020 & 2033
- Table 99: Global Maize Industry in South Africa Revenue Million Forecast, by Country 2020 & 2033
- Table 100: Global Maize Industry in South Africa Volume K Units Forecast, by Country 2020 & 2033
- Table 101: United Kingdom Maize Industry in South Africa Revenue (Million) Forecast, by Application 2020 & 2033
- Table 102: United Kingdom Maize Industry in South Africa Volume (K Units) Forecast, by Application 2020 & 2033
- Table 103: Germany Maize Industry in South Africa Revenue (Million) Forecast, by Application 2020 & 2033
- Table 104: Germany Maize Industry in South Africa Volume (K Units) Forecast, by Application 2020 & 2033
- Table 105: France Maize Industry in South Africa Revenue (Million) Forecast, by Application 2020 & 2033
- Table 106: France Maize Industry in South Africa Volume (K Units) Forecast, by Application 2020 & 2033
- Table 107: Italy Maize Industry in South Africa Revenue (Million) Forecast, by Application 2020 & 2033
- Table 108: Italy Maize Industry in South Africa Volume (K Units) Forecast, by Application 2020 & 2033
- Table 109: Spain Maize Industry in South Africa Revenue (Million) Forecast, by Application 2020 & 2033
- Table 110: Spain Maize Industry in South Africa Volume (K Units) Forecast, by Application 2020 & 2033
- Table 111: Russia Maize Industry in South Africa Revenue (Million) Forecast, by Application 2020 & 2033
- Table 112: Russia Maize Industry in South Africa Volume (K Units) Forecast, by Application 2020 & 2033
- Table 113: Benelux Maize Industry in South Africa Revenue (Million) Forecast, by Application 2020 & 2033
- Table 114: Benelux Maize Industry in South Africa Volume (K Units) Forecast, by Application 2020 & 2033
- Table 115: Nordics Maize Industry in South Africa Revenue (Million) Forecast, by Application 2020 & 2033
- Table 116: Nordics Maize Industry in South Africa Volume (K Units) Forecast, by Application 2020 & 2033
- Table 117: Rest of Europe Maize Industry in South Africa Revenue (Million) Forecast, by Application 2020 & 2033
- Table 118: Rest of Europe Maize Industry in South Africa Volume (K Units) Forecast, by Application 2020 & 2033
- Table 119: Global Maize Industry in South Africa Revenue Million Forecast, by Production Analysis (Volume) 2020 & 2033
- Table 120: Global Maize Industry in South Africa Volume K Units Forecast, by Production Analysis (Volume) 2020 & 2033
- Table 121: Global Maize Industry in South Africa Revenue Million Forecast, by Consumption Analysis (Value and Volume) 2020 & 2033
- Table 122: Global Maize Industry in South Africa Volume K Units Forecast, by Consumption Analysis (Value and Volume) 2020 & 2033
- Table 123: Global Maize Industry in South Africa Revenue Million Forecast, by Import Analysis (Value and Volume) 2020 & 2033
- Table 124: Global Maize Industry in South Africa Volume K Units Forecast, by Import Analysis (Value and Volume) 2020 & 2033
- Table 125: Global Maize Industry in South Africa Revenue Million Forecast, by Export Analysis (Value and Volume) 2020 & 2033
- Table 126: Global Maize Industry in South Africa Volume K Units Forecast, by Export Analysis (Value and Volume) 2020 & 2033
- Table 127: Global Maize Industry in South Africa Revenue Million Forecast, by Price Trend Analysis 2020 & 2033
- Table 128: Global Maize Industry in South Africa Volume K Units Forecast, by Price Trend Analysis 2020 & 2033
- Table 129: Global Maize Industry in South Africa Revenue Million Forecast, by Production Analysis (Volume) 2020 & 2033
- Table 130: Global Maize Industry in South Africa Volume K Units Forecast, by Production Analysis (Volume) 2020 & 2033
- Table 131: Global Maize Industry in South Africa Revenue Million Forecast, by Consumption Analysis (Value and Volume) 2020 & 2033
- Table 132: Global Maize Industry in South Africa Volume K Units Forecast, by Consumption Analysis (Value and Volume) 2020 & 2033
- Table 133: Global Maize Industry in South Africa Revenue Million Forecast, by Import Analysis (Value and Volume) 2020 & 2033
- Table 134: Global Maize Industry in South Africa Volume K Units Forecast, by Import Analysis (Value and Volume) 2020 & 2033
- Table 135: Global Maize Industry in South Africa Revenue Million Forecast, by Export Analysis (Value and Volume) 2020 & 2033
- Table 136: Global Maize Industry in South Africa Volume K Units Forecast, by Export Analysis (Value and Volume) 2020 & 2033
- Table 137: Global Maize Industry in South Africa Revenue Million Forecast, by Price Trend Analysis 2020 & 2033
- Table 138: Global Maize Industry in South Africa Volume K Units Forecast, by Price Trend Analysis 2020 & 2033
- Table 139: Global Maize Industry in South Africa Revenue Million Forecast, by Country 2020 & 2033
- Table 140: Global Maize Industry in South Africa Volume K Units Forecast, by Country 2020 & 2033
- Table 141: Turkey Maize Industry in South Africa Revenue (Million) Forecast, by Application 2020 & 2033
- Table 142: Turkey Maize Industry in South Africa Volume (K Units) Forecast, by Application 2020 & 2033
- Table 143: Israel Maize Industry in South Africa Revenue (Million) Forecast, by Application 2020 & 2033
- Table 144: Israel Maize Industry in South Africa Volume (K Units) Forecast, by Application 2020 & 2033
- Table 145: GCC Maize Industry in South Africa Revenue (Million) Forecast, by Application 2020 & 2033
- Table 146: GCC Maize Industry in South Africa Volume (K Units) Forecast, by Application 2020 & 2033
- Table 147: North Africa Maize Industry in South Africa Revenue (Million) Forecast, by Application 2020 & 2033
- Table 148: North Africa Maize Industry in South Africa Volume (K Units) Forecast, by Application 2020 & 2033
- Table 149: South Africa Maize Industry in South Africa Revenue (Million) Forecast, by Application 2020 & 2033
- Table 150: South Africa Maize Industry in South Africa Volume (K Units) Forecast, by Application 2020 & 2033
- Table 151: Rest of Middle East & Africa Maize Industry in South Africa Revenue (Million) Forecast, by Application 2020 & 2033
- Table 152: Rest of Middle East & Africa Maize Industry in South Africa Volume (K Units) Forecast, by Application 2020 & 2033
- Table 153: Global Maize Industry in South Africa Revenue Million Forecast, by Production Analysis (Volume) 2020 & 2033
- Table 154: Global Maize Industry in South Africa Volume K Units Forecast, by Production Analysis (Volume) 2020 & 2033
- Table 155: Global Maize Industry in South Africa Revenue Million Forecast, by Consumption Analysis (Value and Volume) 2020 & 2033
- Table 156: Global Maize Industry in South Africa Volume K Units Forecast, by Consumption Analysis (Value and Volume) 2020 & 2033
- Table 157: Global Maize Industry in South Africa Revenue Million Forecast, by Import Analysis (Value and Volume) 2020 & 2033
- Table 158: Global Maize Industry in South Africa Volume K Units Forecast, by Import Analysis (Value and Volume) 2020 & 2033
- Table 159: Global Maize Industry in South Africa Revenue Million Forecast, by Export Analysis (Value and Volume) 2020 & 2033
- Table 160: Global Maize Industry in South Africa Volume K Units Forecast, by Export Analysis (Value and Volume) 2020 & 2033
- Table 161: Global Maize Industry in South Africa Revenue Million Forecast, by Price Trend Analysis 2020 & 2033
- Table 162: Global Maize Industry in South Africa Volume K Units Forecast, by Price Trend Analysis 2020 & 2033
- Table 163: Global Maize Industry in South Africa Revenue Million Forecast, by Production Analysis (Volume) 2020 & 2033
- Table 164: Global Maize Industry in South Africa Volume K Units Forecast, by Production Analysis (Volume) 2020 & 2033
- Table 165: Global Maize Industry in South Africa Revenue Million Forecast, by Consumption Analysis (Value and Volume) 2020 & 2033
- Table 166: Global Maize Industry in South Africa Volume K Units Forecast, by Consumption Analysis (Value and Volume) 2020 & 2033
- Table 167: Global Maize Industry in South Africa Revenue Million Forecast, by Import Analysis (Value and Volume) 2020 & 2033
- Table 168: Global Maize Industry in South Africa Volume K Units Forecast, by Import Analysis (Value and Volume) 2020 & 2033
- Table 169: Global Maize Industry in South Africa Revenue Million Forecast, by Export Analysis (Value and Volume) 2020 & 2033
- Table 170: Global Maize Industry in South Africa Volume K Units Forecast, by Export Analysis (Value and Volume) 2020 & 2033
- Table 171: Global Maize Industry in South Africa Revenue Million Forecast, by Price Trend Analysis 2020 & 2033
- Table 172: Global Maize Industry in South Africa Volume K Units Forecast, by Price Trend Analysis 2020 & 2033
- Table 173: Global Maize Industry in South Africa Revenue Million Forecast, by Country 2020 & 2033
- Table 174: Global Maize Industry in South Africa Volume K Units Forecast, by Country 2020 & 2033
- Table 175: China Maize Industry in South Africa Revenue (Million) Forecast, by Application 2020 & 2033
- Table 176: China Maize Industry in South Africa Volume (K Units) Forecast, by Application 2020 & 2033
- Table 177: India Maize Industry in South Africa Revenue (Million) Forecast, by Application 2020 & 2033
- Table 178: India Maize Industry in South Africa Volume (K Units) Forecast, by Application 2020 & 2033
- Table 179: Japan Maize Industry in South Africa Revenue (Million) Forecast, by Application 2020 & 2033
- Table 180: Japan Maize Industry in South Africa Volume (K Units) Forecast, by Application 2020 & 2033
- Table 181: South Korea Maize Industry in South Africa Revenue (Million) Forecast, by Application 2020 & 2033
- Table 182: South Korea Maize Industry in South Africa Volume (K Units) Forecast, by Application 2020 & 2033
- Table 183: ASEAN Maize Industry in South Africa Revenue (Million) Forecast, by Application 2020 & 2033
- Table 184: ASEAN Maize Industry in South Africa Volume (K Units) Forecast, by Application 2020 & 2033
- Table 185: Oceania Maize Industry in South Africa Revenue (Million) Forecast, by Application 2020 & 2033
- Table 186: Oceania Maize Industry in South Africa Volume (K Units) Forecast, by Application 2020 & 2033
- Table 187: Rest of Asia Pacific Maize Industry in South Africa Revenue (Million) Forecast, by Application 2020 & 2033
- Table 188: Rest of Asia Pacific Maize Industry in South Africa Volume (K Units) Forecast, by Application 2020 & 2033
Frequently Asked Questions
1. What is the projected Compound Annual Growth Rate (CAGR) of the Maize Industry in South Africa?
The projected CAGR is approximately 4.00%.
2. Which companies are prominent players in the Maize Industry in South Africa?
Key companies in the market include Pioneer Foods , NWK, Tiger Brands , Astral Foods , AfriSam .
3. What are the main segments of the Maize Industry in South Africa?
The market segments include Production Analysis (Volume), Consumption Analysis (Value and Volume), Import Analysis (Value and Volume), Export Analysis (Value and Volume), Price Trend Analysis, Production Analysis (Volume), Consumption Analysis (Value and Volume), Import Analysis (Value and Volume), Export Analysis (Value and Volume), Price Trend Analysis.
4. Can you provide details about the market size?
The market size is estimated to be USD 2.52 Million as of 2022.
5. What are some drivers contributing to market growth?
N/A
6. What are the notable trends driving market growth?
Increasing Use of Maize in Animal Feed.
7. Are there any restraints impacting market growth?
N/A
8. Can you provide examples of recent developments in the market?
August 2022: The University of the Free State and Grain South Africa entered into a joint venture for developing innovative new food maize products that could boost the nutritional intake of people in South Africa with lower incomes.
9. What pricing options are available for accessing the report?
Pricing options include single-user, multi-user, and enterprise licenses priced at USD 3800, USD 4500, and USD 5800 respectively.
10. Is the market size provided in terms of value or volume?
The market size is provided in terms of value, measured in Million and volume, measured in K Units.
11. Are there any specific market keywords associated with the report?
Yes, the market keyword associated with the report is "Maize Industry in South Africa," which aids in identifying and referencing the specific market segment covered.
12. How do I determine which pricing option suits my needs best?
The pricing options vary based on user requirements and access needs. Individual users may opt for single-user licenses, while businesses requiring broader access may choose multi-user or enterprise licenses for cost-effective access to the report.
13. Are there any additional resources or data provided in the Maize Industry in South Africa report?
While the report offers comprehensive insights, it's advisable to review the specific contents or supplementary materials provided to ascertain if additional resources or data are available.
14. How can I stay updated on further developments or reports in the Maize Industry in South Africa?
To stay informed about further developments, trends, and reports in the Maize Industry in South Africa, consider subscribing to industry newsletters, following relevant companies and organizations, or regularly checking reputable industry news sources and publications.
Methodology
Step 1 - Identification of Relevant Samples Size from Population Database


Step 2 - Approaches for Defining Global Market Size (Value, Volume* & Price*)

Note*: In applicable scenarios
Step 3 - Data Sources
Primary Research
- Web Analytics
- Survey Reports
- Research Institute
- Latest Research Reports
- Opinion Leaders
Secondary Research
- Annual Reports
- White Paper
- Latest Press Release
- Industry Association
- Paid Database
- Investor Presentations

Step 4 - Data Triangulation
Involves using different sources of information in order to increase the validity of a study
These sources are likely to be stakeholders in a program - participants, other researchers, program staff, other community members, and so on.
Then we put all data in single framework & apply various statistical tools to find out the dynamic on the market.
During the analysis stage, feedback from the stakeholder groups would be compared to determine areas of agreement as well as areas of divergence