

Key Insights
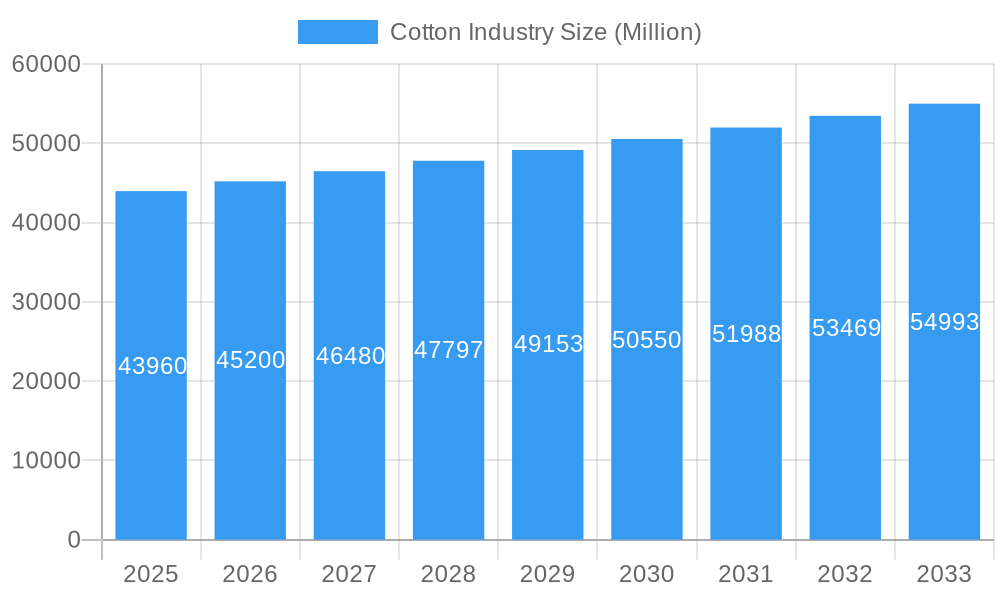
The global cotton industry, valued at $43.96 billion in 2025, is projected to experience a Compound Annual Growth Rate (CAGR) of 2.70% from 2025 to 2033. This growth is driven by several key factors. Increased demand for apparel and home textiles in developing economies, particularly in Asia-Pacific, fuels significant consumption. Sustainable and ethically sourced cotton is gaining traction, pushing innovation in farming practices and supply chain transparency. Technological advancements in seed breeding and farming techniques contribute to higher yields and improved fiber quality, enhancing profitability for producers. However, challenges persist. Fluctuations in cotton prices due to global trade policies and weather patterns remain a significant restraint. Competition from synthetic fibers also presents an ongoing challenge, necessitating continuous innovation and value-added product development within the cotton industry. The market segmentation reveals a diverse landscape, with short-staple cotton dominating in price-sensitive applications while long-staple varieties command premium prices due to superior quality. Similarly, the apparel sector leads consumption, followed by home textiles and industrial applications. Major players such as Monsanto, Syngenta, and Bayer CropScience play crucial roles in seed development and agricultural technology, shaping the industry's future. Regional variations are expected, with Asia-Pacific maintaining its dominant position, driven by strong domestic demand and manufacturing capabilities. North America and Europe, while mature markets, will continue to contribute significantly, albeit at a slower growth rate compared to the Asia-Pacific region.
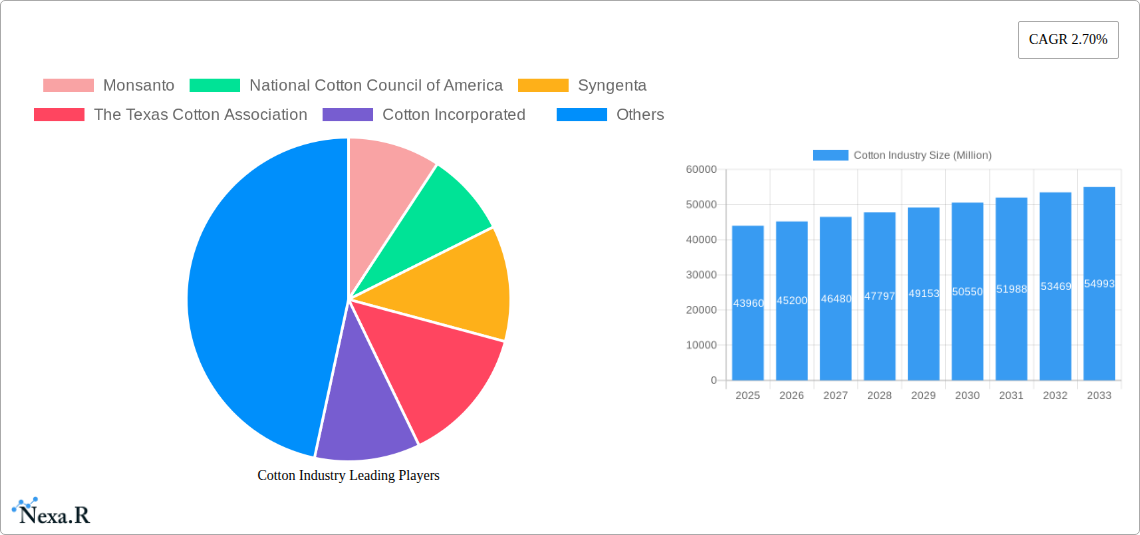
Cotton Industry Market Size (In Billion)
The industry's future success hinges on addressing sustainability concerns, embracing technological advancements, and adapting to evolving consumer preferences. Meeting the increasing demand for high-quality, sustainably produced cotton requires collaboration across the value chain, from farmers and producers to brands and retailers. The focus will shift towards traceable, transparent supply chains, enabling consumers to make informed purchasing decisions. Innovation in fiber processing and textile manufacturing will be crucial in enhancing the competitiveness of cotton against synthetic alternatives, creating higher-value applications and unlocking new market opportunities. Ultimately, a balanced approach integrating technological innovation, sustainable practices, and efficient supply chain management will be critical for the sustained growth and prosperity of the global cotton industry throughout the forecast period.
Cotton Industry Company Market Share
Cotton Industry Market Report: 2019-2033
This comprehensive report provides an in-depth analysis of the global cotton industry, encompassing market dynamics, growth trends, key players, and future outlook. The study period covers 2019-2033, with a base year of 2025 and a forecast period of 2025-2033. The report is designed for industry professionals, investors, and researchers seeking actionable insights into this vital agricultural and textile sector. The market is segmented by fiber length (short-staple, medium-staple, long-staple), grade (Strict Low Middling (SLM), Middling (M), Strict Middling (SM)), color (white, colored), and end-use (apparel, home textiles, industrial applications). This detailed segmentation allows for a granular understanding of market performance across various sub-segments. The report values are presented in Million units.
Cotton Industry Market Dynamics & Structure
The global cotton industry, valued at xx Million units in 2024, is characterized by moderate market concentration with a few dominant players and numerous smaller entities. Technological innovation, particularly in seed genetics and farming practices, plays a crucial role in driving productivity and quality. Stringent regulatory frameworks governing pesticide use and sustainable farming practices significantly influence the industry's operational landscape. Competitive pressures arise from synthetic fiber substitutes like polyester, impacting cotton’s market share in certain end-use segments. End-user demographics, particularly shifts in fashion trends and consumer preferences for sustainable textiles, shape demand patterns. M&A activity in the industry is moderate; however, consolidating the sector could potentially enhance efficiency and innovation.
- Market Concentration: Moderately concentrated, with top players holding xx% market share in 2024.
- Technological Innovation: Key drivers include improved seed varieties (e.g., Bt cotton), precision agriculture, and water-efficient irrigation techniques.
- Regulatory Framework: Stringent environmental regulations impact pesticide use and farming practices, driving adoption of sustainable cotton production methods.
- Competitive Substitutes: Synthetic fibers such as polyester pose a significant challenge to cotton's market share, especially in price-sensitive segments.
- End-User Demographics: Growing demand for sustainable and ethically sourced cotton influences industry trends. Millennials and Gen Z are key consumer segments.
- M&A Activity: xx M&A deals in the period 2019-2024, averaging xx deals annually.
Cotton Industry Growth Trends & Insights
The global cotton market exhibited a CAGR of xx% during the historical period (2019-2024), reaching xx Million units in 2024. This growth was primarily driven by increasing global apparel consumption, rising demand for home textiles, and the expansion of industrial applications for cotton. Technological advancements, such as improved seed varieties offering higher yields and enhanced fiber quality, have significantly boosted productivity. Furthermore, consumer preference shifts towards sustainable and organic cotton are reshaping the industry landscape. Market penetration of organic cotton is expected to increase from xx% in 2024 to xx% by 2033. Technological disruptions, including advancements in textile processing and the rise of smart farming technologies, are influencing market dynamics. Adoption rates of these technologies vary widely across regions, with developed economies leading the way. Consumer behavior shifts towards premium cotton products and a preference for transparency in the supply chain are creating opportunities for brands emphasizing sustainability and ethical sourcing. The forecast period (2025-2033) projects a CAGR of xx%, driven by continued demand growth and technological improvements. Expected market size in 2033 is projected at xx Million units.
Dominant Regions, Countries, or Segments in Cotton Industry
India and the United States remain dominant cotton-producing countries, holding significant shares of global production. However, other regions, such as China and Brazil, are also actively expanding cotton production through technological advancements and policy support. Within the segment breakdown, short-staple cotton holds the largest market share due to its affordability and widespread use in apparel manufacturing. The 'Middling (M)' grade dominates the quality spectrum due to its balance of price and quality. White cotton retains the largest color share, driven primarily by the apparel industry’s preference. Apparel remains the largest end-use segment, followed by home textiles.
- Key Drivers: Favorable climatic conditions, government support policies, technological advancements in seed genetics and farming practices, and robust textile industries in key regions.
- Dominance Factors: India and the US benefit from large-scale cotton production, established infrastructure, and favorable government policies. Short-staple cotton's affordability drives its dominance, while the 'Middling (M)' grade caters to the majority of apparel manufacturing needs. The dominance of the white color reflects the extensive use of white cotton in garments and other applications. The Apparel industry's global scale contributes to its market share leadership.
Cotton Industry Product Landscape
The cotton industry's product landscape is characterized by continuous innovation in seed genetics, producing varieties with improved yield, fiber quality, and pest resistance. Technological advancements in ginning and processing have enhanced fiber extraction efficiency and minimized waste. Unique selling propositions focus on enhanced fiber properties, such as strength, length, and color consistency, to cater to specific end-use requirements. The industry is increasingly focusing on sustainable practices, including reduced water usage, and the development of organic and bio-based cotton varieties.
Key Drivers, Barriers & Challenges in Cotton Industry
Key Drivers: Growing global population and rising apparel consumption, increasing demand for home textiles, innovation in seed genetics and farming technologies, government support for cotton production in major producing countries, and growing demand for sustainable and organic cotton.
Challenges: Fluctuations in cotton prices due to weather patterns and global supply chain disruptions, pest infestations and diseases impacting yield, competition from synthetic fibers, increasing water scarcity in major cotton-producing regions, and stringent environmental regulations driving increased production costs. The impact of these challenges can be quantified as a potential reduction in projected market growth by xx% if mitigation strategies are not implemented effectively.
Emerging Opportunities in Cotton Industry
Emerging opportunities lie in the growing demand for sustainable and organic cotton, increasing consumer preference for high-quality and ethically sourced products, and the expanding application of cotton in high-value niche markets like medical textiles and advanced composites. The development of new high-yield and pest-resistant cotton varieties through genetic modification and other advanced techniques are key areas of exploration. Furthermore, innovations in textile processing and finishing technologies are expected to open new opportunities in terms of product development and application areas.
Growth Accelerators in the Cotton Industry Industry
Strategic partnerships between seed companies, textile manufacturers, and retailers are expected to drive vertical integration and create efficiency gains. Investments in sustainable agricultural practices, advanced farming technologies, and research and development for new cotton varieties, combined with policy support from governments for cotton farmers, are other key accelerators. Expansion into new markets and the development of innovative applications for cotton will further fuel industry growth.
Key Players Shaping the Cotton Industry Market
- Monsanto
- National Cotton Council of America
- Syngenta
- The Texas Cotton Association
- Cotton Incorporated
- International Cotton Association
- Bayer CropScience
Notable Milestones in Cotton Industry Sector
- September 2022: Launch of two new organic cotton varieties in India, boosting sustainable cotton production.
- August 2022: Several major apparel brands joined the Organic Cotton Accelerator (OCA), signifying increased industry commitment to sustainable practices.
- March 2022: Armor seed company released two new cotton varieties (ARMOR 9512 B3XF and ARMOR 9442 XF), enhancing fiber quality and yield.
In-Depth Cotton Industry Market Outlook
The cotton industry's future growth hinges on several factors: continued global demand for textiles, technological advancements in seed genetics and farming practices, adoption of sustainable production methods, and strategic collaborations across the value chain. The industry presents attractive opportunities for players willing to invest in innovation, sustainability, and value-chain integration. The projected market size suggests significant growth potential, and strategic players who proactively adapt to changing consumer preferences and regulatory requirements are poised to capture considerable market share.
Cotton Industry Segmentation
- 1. Production Analysis
- 2. Consumption Analysis
- 3. Import Market Analysis (Value & Volume)
- 4. Export Market Analysis (Value & Volume)
- 5. Price Trend Analysis
Cotton Industry Segmentation By Geography
-
1. North America
- 1.1. United States
- 1.2. Canada
- 1.3. Mexico
-
2. Europe
- 2.1. Germany
- 2.2. France
- 2.3. Russia
- 2.4. Greece
- 2.5. Italy
-
3. Asia Pacific
- 3.1. China
- 3.2. India
- 3.3. Australia
- 3.4. Pakistan
- 3.5. Bangladesh
-
4. South America
- 4.1. Brazil
- 4.2. Argentina
- 5. Middle East
-
6. South Africa
- 6.1. Turkey
- 6.2. Egypt
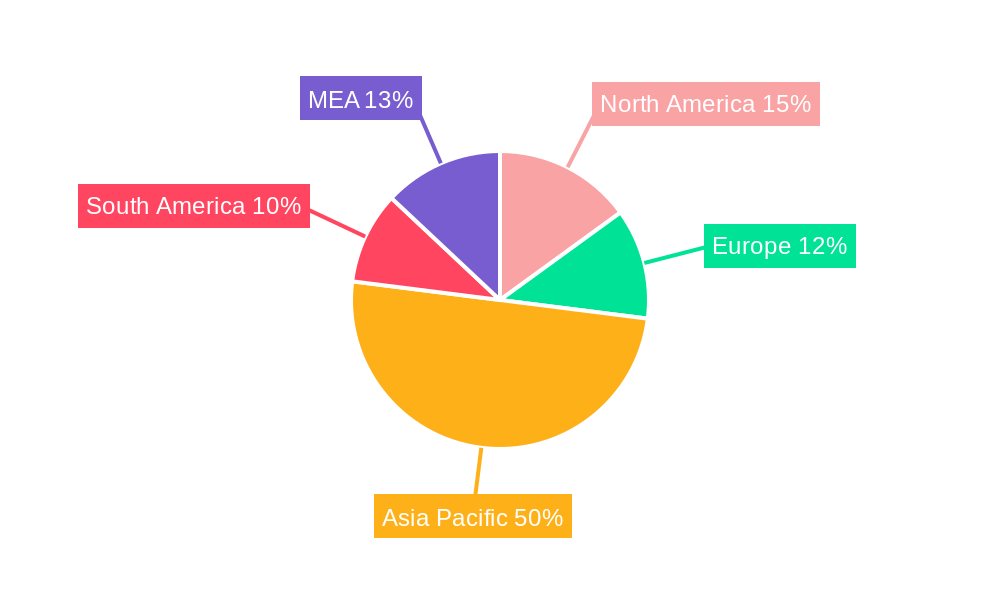
Cotton Industry Regional Market Share
Geographic Coverage of Cotton Industry
Cotton Industry REPORT HIGHLIGHTS
| Aspects | Details |
|---|---|
| Study Period | 2020-2034 |
| Base Year | 2025 |
| Estimated Year | 2026 |
| Forecast Period | 2026-2034 |
| Historical Period | 2020-2025 |
| Growth Rate | CAGR of 2.70% from 2020-2034 |
| Segmentation |
|
Table of Contents
- 1. Introduction
- 1.1. Research Scope
- 1.2. Market Segmentation
- 1.3. Research Objective
- 1.4. Definitions and Assumptions
- 2. Executive Summary
- 2.1. Market Snapshot
- 3. Market Dynamics
- 3.1. Market Drivers
- 3.2. Market Restrains
- 3.3. Market Trends
- 3.4. Market Opportunities
- 4. Market Factor Analysis
- 4.1. Porters Five Forces
- 4.1.1. Bargaining Power of Suppliers
- 4.1.2. Bargaining Power of Buyers
- 4.1.3. Threat of New Entrants
- 4.1.4. Threat of Substitutes
- 4.1.5. Competitive Rivalry
- 4.2. PESTEL analysis
- 4.3. BCG Analysis
- 4.3.1. Stars (High Growth, High Market Share)
- 4.3.2. Cash Cows (Low Growth, High Market Share)
- 4.3.3. Question Mark (High Growth, Low Market Share)
- 4.3.4. Dogs (Low Growth, Low Market Share)
- 4.4. Ansoff Matrix Analysis
- 4.5. Supply Chain Analysis
- 4.6. Regulatory Landscape
- 4.7. Current Market Potential and Opportunity Assessment (TAM–SAM–SOM Framework)
- 4.8. NRP Analyst Note
- 4.1. Porters Five Forces
- 5. Market Analysis, Insights and Forecast 2021-2033
- 5.1. Market Analysis, Insights and Forecast - by Production Analysis
- 5.2. Market Analysis, Insights and Forecast - by Consumption Analysis
- 5.3. Market Analysis, Insights and Forecast - by Import Market Analysis (Value & Volume)
- 5.4. Market Analysis, Insights and Forecast - by Export Market Analysis (Value & Volume)
- 5.5. Market Analysis, Insights and Forecast - by Price Trend Analysis
- 5.6. Market Analysis, Insights and Forecast - by Region
- 5.6.1. North America
- 5.6.2. Europe
- 5.6.3. Asia Pacific
- 5.6.4. South America
- 5.6.5. Middle East
- 5.6.6. South Africa
- 6. Global Cotton Industry Analysis, Insights and Forecast, 2021-2033
- 6.1. Market Analysis, Insights and Forecast - by Production Analysis
- 6.2. Market Analysis, Insights and Forecast - by Consumption Analysis
- 6.3. Market Analysis, Insights and Forecast - by Import Market Analysis (Value & Volume)
- 6.4. Market Analysis, Insights and Forecast - by Export Market Analysis (Value & Volume)
- 6.5. Market Analysis, Insights and Forecast - by Price Trend Analysis
- 7. North America Cotton Industry Analysis, Insights and Forecast, 2020-2032
- 7.1. Market Analysis, Insights and Forecast - by Production Analysis
- 7.2. Market Analysis, Insights and Forecast - by Consumption Analysis
- 7.3. Market Analysis, Insights and Forecast - by Import Market Analysis (Value & Volume)
- 7.4. Market Analysis, Insights and Forecast - by Export Market Analysis (Value & Volume)
- 7.5. Market Analysis, Insights and Forecast - by Price Trend Analysis
- 8. Europe Cotton Industry Analysis, Insights and Forecast, 2020-2032
- 8.1. Market Analysis, Insights and Forecast - by Production Analysis
- 8.2. Market Analysis, Insights and Forecast - by Consumption Analysis
- 8.3. Market Analysis, Insights and Forecast - by Import Market Analysis (Value & Volume)
- 8.4. Market Analysis, Insights and Forecast - by Export Market Analysis (Value & Volume)
- 8.5. Market Analysis, Insights and Forecast - by Price Trend Analysis
- 9. Asia Pacific Cotton Industry Analysis, Insights and Forecast, 2020-2032
- 9.1. Market Analysis, Insights and Forecast - by Production Analysis
- 9.2. Market Analysis, Insights and Forecast - by Consumption Analysis
- 9.3. Market Analysis, Insights and Forecast - by Import Market Analysis (Value & Volume)
- 9.4. Market Analysis, Insights and Forecast - by Export Market Analysis (Value & Volume)
- 9.5. Market Analysis, Insights and Forecast - by Price Trend Analysis
- 10. South America Cotton Industry Analysis, Insights and Forecast, 2020-2032
- 10.1. Market Analysis, Insights and Forecast - by Production Analysis
- 10.2. Market Analysis, Insights and Forecast - by Consumption Analysis
- 10.3. Market Analysis, Insights and Forecast - by Import Market Analysis (Value & Volume)
- 10.4. Market Analysis, Insights and Forecast - by Export Market Analysis (Value & Volume)
- 10.5. Market Analysis, Insights and Forecast - by Price Trend Analysis
- 11. Middle East Cotton Industry Analysis, Insights and Forecast, 2020-2032
- 11.1. Market Analysis, Insights and Forecast - by Production Analysis
- 11.2. Market Analysis, Insights and Forecast - by Consumption Analysis
- 11.3. Market Analysis, Insights and Forecast - by Import Market Analysis (Value & Volume)
- 11.4. Market Analysis, Insights and Forecast - by Export Market Analysis (Value & Volume)
- 11.5. Market Analysis, Insights and Forecast - by Price Trend Analysis
- 12. South Africa Cotton Industry Analysis, Insights and Forecast, 2020-2032
- 12.1. Market Analysis, Insights and Forecast - by Production Analysis
- 12.2. Market Analysis, Insights and Forecast - by Consumption Analysis
- 12.3. Market Analysis, Insights and Forecast - by Import Market Analysis (Value & Volume)
- 12.4. Market Analysis, Insights and Forecast - by Export Market Analysis (Value & Volume)
- 12.5. Market Analysis, Insights and Forecast - by Price Trend Analysis
- 13. Competitive Analysis
- 13.1. Company Profiles
- 13.1.1 Monsanto
- 13.1.1.1. Company Overview
- 13.1.1.2. Products
- 13.1.1.3. Company Financials
- 13.1.1.4. SWOT Analysis
- 13.1.2 National Cotton Council of America
- 13.1.2.1. Company Overview
- 13.1.2.2. Products
- 13.1.2.3. Company Financials
- 13.1.2.4. SWOT Analysis
- 13.1.3 Syngenta
- 13.1.3.1. Company Overview
- 13.1.3.2. Products
- 13.1.3.3. Company Financials
- 13.1.3.4. SWOT Analysis
- 13.1.4 The Texas Cotton Association
- 13.1.4.1. Company Overview
- 13.1.4.2. Products
- 13.1.4.3. Company Financials
- 13.1.4.4. SWOT Analysis
- 13.1.5 Cotton Incorporated
- 13.1.5.1. Company Overview
- 13.1.5.2. Products
- 13.1.5.3. Company Financials
- 13.1.5.4. SWOT Analysis
- 13.1.6 International Cotton Association
- 13.1.6.1. Company Overview
- 13.1.6.2. Products
- 13.1.6.3. Company Financials
- 13.1.6.4. SWOT Analysis
- 13.1.7 Bayer CropScience
- 13.1.7.1. Company Overview
- 13.1.7.2. Products
- 13.1.7.3. Company Financials
- 13.1.7.4. SWOT Analysis
- 13.1.1 Monsanto
- 13.2. Market Entropy
- 13.2.1 Company's Key Areas Served
- 13.2.2 Recent Developments
- 13.3. Company Market Share Analysis 2025
- 13.3.1 Top 5 Companies Market Share Analysis
- 13.3.2 Top 3 Companies Market Share Analysis
- 13.4. List of Potential Customers
- 14. Research Methodology
List of Figures
- Figure 1: Global Cotton Industry Revenue Breakdown (Million, %) by Region 2025 & 2033
- Figure 2: Global Cotton Industry Volume Breakdown (Kiloton, %) by Region 2025 & 2033
- Figure 3: North America Cotton Industry Revenue (Million), by Production Analysis 2025 & 2033
- Figure 4: North America Cotton Industry Volume (Kiloton), by Production Analysis 2025 & 2033
- Figure 5: North America Cotton Industry Revenue Share (%), by Production Analysis 2025 & 2033
- Figure 6: North America Cotton Industry Volume Share (%), by Production Analysis 2025 & 2033
- Figure 7: North America Cotton Industry Revenue (Million), by Consumption Analysis 2025 & 2033
- Figure 8: North America Cotton Industry Volume (Kiloton), by Consumption Analysis 2025 & 2033
- Figure 9: North America Cotton Industry Revenue Share (%), by Consumption Analysis 2025 & 2033
- Figure 10: North America Cotton Industry Volume Share (%), by Consumption Analysis 2025 & 2033
- Figure 11: North America Cotton Industry Revenue (Million), by Import Market Analysis (Value & Volume) 2025 & 2033
- Figure 12: North America Cotton Industry Volume (Kiloton), by Import Market Analysis (Value & Volume) 2025 & 2033
- Figure 13: North America Cotton Industry Revenue Share (%), by Import Market Analysis (Value & Volume) 2025 & 2033
- Figure 14: North America Cotton Industry Volume Share (%), by Import Market Analysis (Value & Volume) 2025 & 2033
- Figure 15: North America Cotton Industry Revenue (Million), by Export Market Analysis (Value & Volume) 2025 & 2033
- Figure 16: North America Cotton Industry Volume (Kiloton), by Export Market Analysis (Value & Volume) 2025 & 2033
- Figure 17: North America Cotton Industry Revenue Share (%), by Export Market Analysis (Value & Volume) 2025 & 2033
- Figure 18: North America Cotton Industry Volume Share (%), by Export Market Analysis (Value & Volume) 2025 & 2033
- Figure 19: North America Cotton Industry Revenue (Million), by Price Trend Analysis 2025 & 2033
- Figure 20: North America Cotton Industry Volume (Kiloton), by Price Trend Analysis 2025 & 2033
- Figure 21: North America Cotton Industry Revenue Share (%), by Price Trend Analysis 2025 & 2033
- Figure 22: North America Cotton Industry Volume Share (%), by Price Trend Analysis 2025 & 2033
- Figure 23: North America Cotton Industry Revenue (Million), by Country 2025 & 2033
- Figure 24: North America Cotton Industry Volume (Kiloton), by Country 2025 & 2033
- Figure 25: North America Cotton Industry Revenue Share (%), by Country 2025 & 2033
- Figure 26: North America Cotton Industry Volume Share (%), by Country 2025 & 2033
- Figure 27: Europe Cotton Industry Revenue (Million), by Production Analysis 2025 & 2033
- Figure 28: Europe Cotton Industry Volume (Kiloton), by Production Analysis 2025 & 2033
- Figure 29: Europe Cotton Industry Revenue Share (%), by Production Analysis 2025 & 2033
- Figure 30: Europe Cotton Industry Volume Share (%), by Production Analysis 2025 & 2033
- Figure 31: Europe Cotton Industry Revenue (Million), by Consumption Analysis 2025 & 2033
- Figure 32: Europe Cotton Industry Volume (Kiloton), by Consumption Analysis 2025 & 2033
- Figure 33: Europe Cotton Industry Revenue Share (%), by Consumption Analysis 2025 & 2033
- Figure 34: Europe Cotton Industry Volume Share (%), by Consumption Analysis 2025 & 2033
- Figure 35: Europe Cotton Industry Revenue (Million), by Import Market Analysis (Value & Volume) 2025 & 2033
- Figure 36: Europe Cotton Industry Volume (Kiloton), by Import Market Analysis (Value & Volume) 2025 & 2033
- Figure 37: Europe Cotton Industry Revenue Share (%), by Import Market Analysis (Value & Volume) 2025 & 2033
- Figure 38: Europe Cotton Industry Volume Share (%), by Import Market Analysis (Value & Volume) 2025 & 2033
- Figure 39: Europe Cotton Industry Revenue (Million), by Export Market Analysis (Value & Volume) 2025 & 2033
- Figure 40: Europe Cotton Industry Volume (Kiloton), by Export Market Analysis (Value & Volume) 2025 & 2033
- Figure 41: Europe Cotton Industry Revenue Share (%), by Export Market Analysis (Value & Volume) 2025 & 2033
- Figure 42: Europe Cotton Industry Volume Share (%), by Export Market Analysis (Value & Volume) 2025 & 2033
- Figure 43: Europe Cotton Industry Revenue (Million), by Price Trend Analysis 2025 & 2033
- Figure 44: Europe Cotton Industry Volume (Kiloton), by Price Trend Analysis 2025 & 2033
- Figure 45: Europe Cotton Industry Revenue Share (%), by Price Trend Analysis 2025 & 2033
- Figure 46: Europe Cotton Industry Volume Share (%), by Price Trend Analysis 2025 & 2033
- Figure 47: Europe Cotton Industry Revenue (Million), by Country 2025 & 2033
- Figure 48: Europe Cotton Industry Volume (Kiloton), by Country 2025 & 2033
- Figure 49: Europe Cotton Industry Revenue Share (%), by Country 2025 & 2033
- Figure 50: Europe Cotton Industry Volume Share (%), by Country 2025 & 2033
- Figure 51: Asia Pacific Cotton Industry Revenue (Million), by Production Analysis 2025 & 2033
- Figure 52: Asia Pacific Cotton Industry Volume (Kiloton), by Production Analysis 2025 & 2033
- Figure 53: Asia Pacific Cotton Industry Revenue Share (%), by Production Analysis 2025 & 2033
- Figure 54: Asia Pacific Cotton Industry Volume Share (%), by Production Analysis 2025 & 2033
- Figure 55: Asia Pacific Cotton Industry Revenue (Million), by Consumption Analysis 2025 & 2033
- Figure 56: Asia Pacific Cotton Industry Volume (Kiloton), by Consumption Analysis 2025 & 2033
- Figure 57: Asia Pacific Cotton Industry Revenue Share (%), by Consumption Analysis 2025 & 2033
- Figure 58: Asia Pacific Cotton Industry Volume Share (%), by Consumption Analysis 2025 & 2033
- Figure 59: Asia Pacific Cotton Industry Revenue (Million), by Import Market Analysis (Value & Volume) 2025 & 2033
- Figure 60: Asia Pacific Cotton Industry Volume (Kiloton), by Import Market Analysis (Value & Volume) 2025 & 2033
- Figure 61: Asia Pacific Cotton Industry Revenue Share (%), by Import Market Analysis (Value & Volume) 2025 & 2033
- Figure 62: Asia Pacific Cotton Industry Volume Share (%), by Import Market Analysis (Value & Volume) 2025 & 2033
- Figure 63: Asia Pacific Cotton Industry Revenue (Million), by Export Market Analysis (Value & Volume) 2025 & 2033
- Figure 64: Asia Pacific Cotton Industry Volume (Kiloton), by Export Market Analysis (Value & Volume) 2025 & 2033
- Figure 65: Asia Pacific Cotton Industry Revenue Share (%), by Export Market Analysis (Value & Volume) 2025 & 2033
- Figure 66: Asia Pacific Cotton Industry Volume Share (%), by Export Market Analysis (Value & Volume) 2025 & 2033
- Figure 67: Asia Pacific Cotton Industry Revenue (Million), by Price Trend Analysis 2025 & 2033
- Figure 68: Asia Pacific Cotton Industry Volume (Kiloton), by Price Trend Analysis 2025 & 2033
- Figure 69: Asia Pacific Cotton Industry Revenue Share (%), by Price Trend Analysis 2025 & 2033
- Figure 70: Asia Pacific Cotton Industry Volume Share (%), by Price Trend Analysis 2025 & 2033
- Figure 71: Asia Pacific Cotton Industry Revenue (Million), by Country 2025 & 2033
- Figure 72: Asia Pacific Cotton Industry Volume (Kiloton), by Country 2025 & 2033
- Figure 73: Asia Pacific Cotton Industry Revenue Share (%), by Country 2025 & 2033
- Figure 74: Asia Pacific Cotton Industry Volume Share (%), by Country 2025 & 2033
- Figure 75: South America Cotton Industry Revenue (Million), by Production Analysis 2025 & 2033
- Figure 76: South America Cotton Industry Volume (Kiloton), by Production Analysis 2025 & 2033
- Figure 77: South America Cotton Industry Revenue Share (%), by Production Analysis 2025 & 2033
- Figure 78: South America Cotton Industry Volume Share (%), by Production Analysis 2025 & 2033
- Figure 79: South America Cotton Industry Revenue (Million), by Consumption Analysis 2025 & 2033
- Figure 80: South America Cotton Industry Volume (Kiloton), by Consumption Analysis 2025 & 2033
- Figure 81: South America Cotton Industry Revenue Share (%), by Consumption Analysis 2025 & 2033
- Figure 82: South America Cotton Industry Volume Share (%), by Consumption Analysis 2025 & 2033
- Figure 83: South America Cotton Industry Revenue (Million), by Import Market Analysis (Value & Volume) 2025 & 2033
- Figure 84: South America Cotton Industry Volume (Kiloton), by Import Market Analysis (Value & Volume) 2025 & 2033
- Figure 85: South America Cotton Industry Revenue Share (%), by Import Market Analysis (Value & Volume) 2025 & 2033
- Figure 86: South America Cotton Industry Volume Share (%), by Import Market Analysis (Value & Volume) 2025 & 2033
- Figure 87: South America Cotton Industry Revenue (Million), by Export Market Analysis (Value & Volume) 2025 & 2033
- Figure 88: South America Cotton Industry Volume (Kiloton), by Export Market Analysis (Value & Volume) 2025 & 2033
- Figure 89: South America Cotton Industry Revenue Share (%), by Export Market Analysis (Value & Volume) 2025 & 2033
- Figure 90: South America Cotton Industry Volume Share (%), by Export Market Analysis (Value & Volume) 2025 & 2033
- Figure 91: South America Cotton Industry Revenue (Million), by Price Trend Analysis 2025 & 2033
- Figure 92: South America Cotton Industry Volume (Kiloton), by Price Trend Analysis 2025 & 2033
- Figure 93: South America Cotton Industry Revenue Share (%), by Price Trend Analysis 2025 & 2033
- Figure 94: South America Cotton Industry Volume Share (%), by Price Trend Analysis 2025 & 2033
- Figure 95: South America Cotton Industry Revenue (Million), by Country 2025 & 2033
- Figure 96: South America Cotton Industry Volume (Kiloton), by Country 2025 & 2033
- Figure 97: South America Cotton Industry Revenue Share (%), by Country 2025 & 2033
- Figure 98: South America Cotton Industry Volume Share (%), by Country 2025 & 2033
- Figure 99: Middle East Cotton Industry Revenue (Million), by Production Analysis 2025 & 2033
- Figure 100: Middle East Cotton Industry Volume (Kiloton), by Production Analysis 2025 & 2033
- Figure 101: Middle East Cotton Industry Revenue Share (%), by Production Analysis 2025 & 2033
- Figure 102: Middle East Cotton Industry Volume Share (%), by Production Analysis 2025 & 2033
- Figure 103: Middle East Cotton Industry Revenue (Million), by Consumption Analysis 2025 & 2033
- Figure 104: Middle East Cotton Industry Volume (Kiloton), by Consumption Analysis 2025 & 2033
- Figure 105: Middle East Cotton Industry Revenue Share (%), by Consumption Analysis 2025 & 2033
- Figure 106: Middle East Cotton Industry Volume Share (%), by Consumption Analysis 2025 & 2033
- Figure 107: Middle East Cotton Industry Revenue (Million), by Import Market Analysis (Value & Volume) 2025 & 2033
- Figure 108: Middle East Cotton Industry Volume (Kiloton), by Import Market Analysis (Value & Volume) 2025 & 2033
- Figure 109: Middle East Cotton Industry Revenue Share (%), by Import Market Analysis (Value & Volume) 2025 & 2033
- Figure 110: Middle East Cotton Industry Volume Share (%), by Import Market Analysis (Value & Volume) 2025 & 2033
- Figure 111: Middle East Cotton Industry Revenue (Million), by Export Market Analysis (Value & Volume) 2025 & 2033
- Figure 112: Middle East Cotton Industry Volume (Kiloton), by Export Market Analysis (Value & Volume) 2025 & 2033
- Figure 113: Middle East Cotton Industry Revenue Share (%), by Export Market Analysis (Value & Volume) 2025 & 2033
- Figure 114: Middle East Cotton Industry Volume Share (%), by Export Market Analysis (Value & Volume) 2025 & 2033
- Figure 115: Middle East Cotton Industry Revenue (Million), by Price Trend Analysis 2025 & 2033
- Figure 116: Middle East Cotton Industry Volume (Kiloton), by Price Trend Analysis 2025 & 2033
- Figure 117: Middle East Cotton Industry Revenue Share (%), by Price Trend Analysis 2025 & 2033
- Figure 118: Middle East Cotton Industry Volume Share (%), by Price Trend Analysis 2025 & 2033
- Figure 119: Middle East Cotton Industry Revenue (Million), by Country 2025 & 2033
- Figure 120: Middle East Cotton Industry Volume (Kiloton), by Country 2025 & 2033
- Figure 121: Middle East Cotton Industry Revenue Share (%), by Country 2025 & 2033
- Figure 122: Middle East Cotton Industry Volume Share (%), by Country 2025 & 2033
- Figure 123: South Africa Cotton Industry Revenue (Million), by Production Analysis 2025 & 2033
- Figure 124: South Africa Cotton Industry Volume (Kiloton), by Production Analysis 2025 & 2033
- Figure 125: South Africa Cotton Industry Revenue Share (%), by Production Analysis 2025 & 2033
- Figure 126: South Africa Cotton Industry Volume Share (%), by Production Analysis 2025 & 2033
- Figure 127: South Africa Cotton Industry Revenue (Million), by Consumption Analysis 2025 & 2033
- Figure 128: South Africa Cotton Industry Volume (Kiloton), by Consumption Analysis 2025 & 2033
- Figure 129: South Africa Cotton Industry Revenue Share (%), by Consumption Analysis 2025 & 2033
- Figure 130: South Africa Cotton Industry Volume Share (%), by Consumption Analysis 2025 & 2033
- Figure 131: South Africa Cotton Industry Revenue (Million), by Import Market Analysis (Value & Volume) 2025 & 2033
- Figure 132: South Africa Cotton Industry Volume (Kiloton), by Import Market Analysis (Value & Volume) 2025 & 2033
- Figure 133: South Africa Cotton Industry Revenue Share (%), by Import Market Analysis (Value & Volume) 2025 & 2033
- Figure 134: South Africa Cotton Industry Volume Share (%), by Import Market Analysis (Value & Volume) 2025 & 2033
- Figure 135: South Africa Cotton Industry Revenue (Million), by Export Market Analysis (Value & Volume) 2025 & 2033
- Figure 136: South Africa Cotton Industry Volume (Kiloton), by Export Market Analysis (Value & Volume) 2025 & 2033
- Figure 137: South Africa Cotton Industry Revenue Share (%), by Export Market Analysis (Value & Volume) 2025 & 2033
- Figure 138: South Africa Cotton Industry Volume Share (%), by Export Market Analysis (Value & Volume) 2025 & 2033
- Figure 139: South Africa Cotton Industry Revenue (Million), by Price Trend Analysis 2025 & 2033
- Figure 140: South Africa Cotton Industry Volume (Kiloton), by Price Trend Analysis 2025 & 2033
- Figure 141: South Africa Cotton Industry Revenue Share (%), by Price Trend Analysis 2025 & 2033
- Figure 142: South Africa Cotton Industry Volume Share (%), by Price Trend Analysis 2025 & 2033
- Figure 143: South Africa Cotton Industry Revenue (Million), by Country 2025 & 2033
- Figure 144: South Africa Cotton Industry Volume (Kiloton), by Country 2025 & 2033
- Figure 145: South Africa Cotton Industry Revenue Share (%), by Country 2025 & 2033
- Figure 146: South Africa Cotton Industry Volume Share (%), by Country 2025 & 2033
List of Tables
- Table 1: Global Cotton Industry Revenue Million Forecast, by Production Analysis 2020 & 2033
- Table 2: Global Cotton Industry Volume Kiloton Forecast, by Production Analysis 2020 & 2033
- Table 3: Global Cotton Industry Revenue Million Forecast, by Consumption Analysis 2020 & 2033
- Table 4: Global Cotton Industry Volume Kiloton Forecast, by Consumption Analysis 2020 & 2033
- Table 5: Global Cotton Industry Revenue Million Forecast, by Import Market Analysis (Value & Volume) 2020 & 2033
- Table 6: Global Cotton Industry Volume Kiloton Forecast, by Import Market Analysis (Value & Volume) 2020 & 2033
- Table 7: Global Cotton Industry Revenue Million Forecast, by Export Market Analysis (Value & Volume) 2020 & 2033
- Table 8: Global Cotton Industry Volume Kiloton Forecast, by Export Market Analysis (Value & Volume) 2020 & 2033
- Table 9: Global Cotton Industry Revenue Million Forecast, by Price Trend Analysis 2020 & 2033
- Table 10: Global Cotton Industry Volume Kiloton Forecast, by Price Trend Analysis 2020 & 2033
- Table 11: Global Cotton Industry Revenue Million Forecast, by Region 2020 & 2033
- Table 12: Global Cotton Industry Volume Kiloton Forecast, by Region 2020 & 2033
- Table 13: Global Cotton Industry Revenue Million Forecast, by Production Analysis 2020 & 2033
- Table 14: Global Cotton Industry Volume Kiloton Forecast, by Production Analysis 2020 & 2033
- Table 15: Global Cotton Industry Revenue Million Forecast, by Consumption Analysis 2020 & 2033
- Table 16: Global Cotton Industry Volume Kiloton Forecast, by Consumption Analysis 2020 & 2033
- Table 17: Global Cotton Industry Revenue Million Forecast, by Import Market Analysis (Value & Volume) 2020 & 2033
- Table 18: Global Cotton Industry Volume Kiloton Forecast, by Import Market Analysis (Value & Volume) 2020 & 2033
- Table 19: Global Cotton Industry Revenue Million Forecast, by Export Market Analysis (Value & Volume) 2020 & 2033
- Table 20: Global Cotton Industry Volume Kiloton Forecast, by Export Market Analysis (Value & Volume) 2020 & 2033
- Table 21: Global Cotton Industry Revenue Million Forecast, by Price Trend Analysis 2020 & 2033
- Table 22: Global Cotton Industry Volume Kiloton Forecast, by Price Trend Analysis 2020 & 2033
- Table 23: Global Cotton Industry Revenue Million Forecast, by Country 2020 & 2033
- Table 24: Global Cotton Industry Volume Kiloton Forecast, by Country 2020 & 2033
- Table 25: United States Cotton Industry Revenue (Million) Forecast, by Application 2020 & 2033
- Table 26: United States Cotton Industry Volume (Kiloton) Forecast, by Application 2020 & 2033
- Table 27: Canada Cotton Industry Revenue (Million) Forecast, by Application 2020 & 2033
- Table 28: Canada Cotton Industry Volume (Kiloton) Forecast, by Application 2020 & 2033
- Table 29: Mexico Cotton Industry Revenue (Million) Forecast, by Application 2020 & 2033
- Table 30: Mexico Cotton Industry Volume (Kiloton) Forecast, by Application 2020 & 2033
- Table 31: Global Cotton Industry Revenue Million Forecast, by Production Analysis 2020 & 2033
- Table 32: Global Cotton Industry Volume Kiloton Forecast, by Production Analysis 2020 & 2033
- Table 33: Global Cotton Industry Revenue Million Forecast, by Consumption Analysis 2020 & 2033
- Table 34: Global Cotton Industry Volume Kiloton Forecast, by Consumption Analysis 2020 & 2033
- Table 35: Global Cotton Industry Revenue Million Forecast, by Import Market Analysis (Value & Volume) 2020 & 2033
- Table 36: Global Cotton Industry Volume Kiloton Forecast, by Import Market Analysis (Value & Volume) 2020 & 2033
- Table 37: Global Cotton Industry Revenue Million Forecast, by Export Market Analysis (Value & Volume) 2020 & 2033
- Table 38: Global Cotton Industry Volume Kiloton Forecast, by Export Market Analysis (Value & Volume) 2020 & 2033
- Table 39: Global Cotton Industry Revenue Million Forecast, by Price Trend Analysis 2020 & 2033
- Table 40: Global Cotton Industry Volume Kiloton Forecast, by Price Trend Analysis 2020 & 2033
- Table 41: Global Cotton Industry Revenue Million Forecast, by Country 2020 & 2033
- Table 42: Global Cotton Industry Volume Kiloton Forecast, by Country 2020 & 2033
- Table 43: Germany Cotton Industry Revenue (Million) Forecast, by Application 2020 & 2033
- Table 44: Germany Cotton Industry Volume (Kiloton) Forecast, by Application 2020 & 2033
- Table 45: France Cotton Industry Revenue (Million) Forecast, by Application 2020 & 2033
- Table 46: France Cotton Industry Volume (Kiloton) Forecast, by Application 2020 & 2033
- Table 47: Russia Cotton Industry Revenue (Million) Forecast, by Application 2020 & 2033
- Table 48: Russia Cotton Industry Volume (Kiloton) Forecast, by Application 2020 & 2033
- Table 49: Greece Cotton Industry Revenue (Million) Forecast, by Application 2020 & 2033
- Table 50: Greece Cotton Industry Volume (Kiloton) Forecast, by Application 2020 & 2033
- Table 51: Italy Cotton Industry Revenue (Million) Forecast, by Application 2020 & 2033
- Table 52: Italy Cotton Industry Volume (Kiloton) Forecast, by Application 2020 & 2033
- Table 53: Global Cotton Industry Revenue Million Forecast, by Production Analysis 2020 & 2033
- Table 54: Global Cotton Industry Volume Kiloton Forecast, by Production Analysis 2020 & 2033
- Table 55: Global Cotton Industry Revenue Million Forecast, by Consumption Analysis 2020 & 2033
- Table 56: Global Cotton Industry Volume Kiloton Forecast, by Consumption Analysis 2020 & 2033
- Table 57: Global Cotton Industry Revenue Million Forecast, by Import Market Analysis (Value & Volume) 2020 & 2033
- Table 58: Global Cotton Industry Volume Kiloton Forecast, by Import Market Analysis (Value & Volume) 2020 & 2033
- Table 59: Global Cotton Industry Revenue Million Forecast, by Export Market Analysis (Value & Volume) 2020 & 2033
- Table 60: Global Cotton Industry Volume Kiloton Forecast, by Export Market Analysis (Value & Volume) 2020 & 2033
- Table 61: Global Cotton Industry Revenue Million Forecast, by Price Trend Analysis 2020 & 2033
- Table 62: Global Cotton Industry Volume Kiloton Forecast, by Price Trend Analysis 2020 & 2033
- Table 63: Global Cotton Industry Revenue Million Forecast, by Country 2020 & 2033
- Table 64: Global Cotton Industry Volume Kiloton Forecast, by Country 2020 & 2033
- Table 65: China Cotton Industry Revenue (Million) Forecast, by Application 2020 & 2033
- Table 66: China Cotton Industry Volume (Kiloton) Forecast, by Application 2020 & 2033
- Table 67: India Cotton Industry Revenue (Million) Forecast, by Application 2020 & 2033
- Table 68: India Cotton Industry Volume (Kiloton) Forecast, by Application 2020 & 2033
- Table 69: Australia Cotton Industry Revenue (Million) Forecast, by Application 2020 & 2033
- Table 70: Australia Cotton Industry Volume (Kiloton) Forecast, by Application 2020 & 2033
- Table 71: Pakistan Cotton Industry Revenue (Million) Forecast, by Application 2020 & 2033
- Table 72: Pakistan Cotton Industry Volume (Kiloton) Forecast, by Application 2020 & 2033
- Table 73: Bangladesh Cotton Industry Revenue (Million) Forecast, by Application 2020 & 2033
- Table 74: Bangladesh Cotton Industry Volume (Kiloton) Forecast, by Application 2020 & 2033
- Table 75: Global Cotton Industry Revenue Million Forecast, by Production Analysis 2020 & 2033
- Table 76: Global Cotton Industry Volume Kiloton Forecast, by Production Analysis 2020 & 2033
- Table 77: Global Cotton Industry Revenue Million Forecast, by Consumption Analysis 2020 & 2033
- Table 78: Global Cotton Industry Volume Kiloton Forecast, by Consumption Analysis 2020 & 2033
- Table 79: Global Cotton Industry Revenue Million Forecast, by Import Market Analysis (Value & Volume) 2020 & 2033
- Table 80: Global Cotton Industry Volume Kiloton Forecast, by Import Market Analysis (Value & Volume) 2020 & 2033
- Table 81: Global Cotton Industry Revenue Million Forecast, by Export Market Analysis (Value & Volume) 2020 & 2033
- Table 82: Global Cotton Industry Volume Kiloton Forecast, by Export Market Analysis (Value & Volume) 2020 & 2033
- Table 83: Global Cotton Industry Revenue Million Forecast, by Price Trend Analysis 2020 & 2033
- Table 84: Global Cotton Industry Volume Kiloton Forecast, by Price Trend Analysis 2020 & 2033
- Table 85: Global Cotton Industry Revenue Million Forecast, by Country 2020 & 2033
- Table 86: Global Cotton Industry Volume Kiloton Forecast, by Country 2020 & 2033
- Table 87: Brazil Cotton Industry Revenue (Million) Forecast, by Application 2020 & 2033
- Table 88: Brazil Cotton Industry Volume (Kiloton) Forecast, by Application 2020 & 2033
- Table 89: Argentina Cotton Industry Revenue (Million) Forecast, by Application 2020 & 2033
- Table 90: Argentina Cotton Industry Volume (Kiloton) Forecast, by Application 2020 & 2033
- Table 91: Global Cotton Industry Revenue Million Forecast, by Production Analysis 2020 & 2033
- Table 92: Global Cotton Industry Volume Kiloton Forecast, by Production Analysis 2020 & 2033
- Table 93: Global Cotton Industry Revenue Million Forecast, by Consumption Analysis 2020 & 2033
- Table 94: Global Cotton Industry Volume Kiloton Forecast, by Consumption Analysis 2020 & 2033
- Table 95: Global Cotton Industry Revenue Million Forecast, by Import Market Analysis (Value & Volume) 2020 & 2033
- Table 96: Global Cotton Industry Volume Kiloton Forecast, by Import Market Analysis (Value & Volume) 2020 & 2033
- Table 97: Global Cotton Industry Revenue Million Forecast, by Export Market Analysis (Value & Volume) 2020 & 2033
- Table 98: Global Cotton Industry Volume Kiloton Forecast, by Export Market Analysis (Value & Volume) 2020 & 2033
- Table 99: Global Cotton Industry Revenue Million Forecast, by Price Trend Analysis 2020 & 2033
- Table 100: Global Cotton Industry Volume Kiloton Forecast, by Price Trend Analysis 2020 & 2033
- Table 101: Global Cotton Industry Revenue Million Forecast, by Country 2020 & 2033
- Table 102: Global Cotton Industry Volume Kiloton Forecast, by Country 2020 & 2033
- Table 103: Global Cotton Industry Revenue Million Forecast, by Production Analysis 2020 & 2033
- Table 104: Global Cotton Industry Volume Kiloton Forecast, by Production Analysis 2020 & 2033
- Table 105: Global Cotton Industry Revenue Million Forecast, by Consumption Analysis 2020 & 2033
- Table 106: Global Cotton Industry Volume Kiloton Forecast, by Consumption Analysis 2020 & 2033
- Table 107: Global Cotton Industry Revenue Million Forecast, by Import Market Analysis (Value & Volume) 2020 & 2033
- Table 108: Global Cotton Industry Volume Kiloton Forecast, by Import Market Analysis (Value & Volume) 2020 & 2033
- Table 109: Global Cotton Industry Revenue Million Forecast, by Export Market Analysis (Value & Volume) 2020 & 2033
- Table 110: Global Cotton Industry Volume Kiloton Forecast, by Export Market Analysis (Value & Volume) 2020 & 2033
- Table 111: Global Cotton Industry Revenue Million Forecast, by Price Trend Analysis 2020 & 2033
- Table 112: Global Cotton Industry Volume Kiloton Forecast, by Price Trend Analysis 2020 & 2033
- Table 113: Global Cotton Industry Revenue Million Forecast, by Country 2020 & 2033
- Table 114: Global Cotton Industry Volume Kiloton Forecast, by Country 2020 & 2033
- Table 115: Turkey Cotton Industry Revenue (Million) Forecast, by Application 2020 & 2033
- Table 116: Turkey Cotton Industry Volume (Kiloton) Forecast, by Application 2020 & 2033
- Table 117: Egypt Cotton Industry Revenue (Million) Forecast, by Application 2020 & 2033
- Table 118: Egypt Cotton Industry Volume (Kiloton) Forecast, by Application 2020 & 2033
Frequently Asked Questions
1. What is the projected Compound Annual Growth Rate (CAGR) of the Cotton Industry?
The projected CAGR is approximately 2.70%.
2. Which companies are prominent players in the Cotton Industry?
Key companies in the market include Monsanto, National Cotton Council of America, Syngenta , The Texas Cotton Association, Cotton Incorporated , International Cotton Association , Bayer CropScience .
3. What are the main segments of the Cotton Industry?
The market segments include Production Analysis, Consumption Analysis, Import Market Analysis (Value & Volume), Export Market Analysis (Value & Volume), Price Trend Analysis.
4. Can you provide details about the market size?
The market size is estimated to be USD 43.96 Million as of 2022.
5. What are some drivers contributing to market growth?
Rising Demand for Milled and Broken Rice; Growing Preference for Speciality Rice Variety; Government Initiatives Supports Rice Production.
6. What are the notable trends driving market growth?
Increasing demand for the cotton exports.
7. Are there any restraints impacting market growth?
Lack of Supply Chain for Rice; Growing Agricultural Labor Crisis.
8. Can you provide examples of recent developments in the market?
September 2022: The two first-ever new organic cotton varieties have been made available to farmers in India. These varieties were developed through a decentralized organic participatory breeding program of FiBL Switzerland and their partners.
9. What pricing options are available for accessing the report?
Pricing options include single-user, multi-user, and enterprise licenses priced at USD 4750, USD 5250, and USD 8750 respectively.
10. Is the market size provided in terms of value or volume?
The market size is provided in terms of value, measured in Million and volume, measured in Kiloton.
11. Are there any specific market keywords associated with the report?
Yes, the market keyword associated with the report is "Cotton Industry," which aids in identifying and referencing the specific market segment covered.
12. How do I determine which pricing option suits my needs best?
The pricing options vary based on user requirements and access needs. Individual users may opt for single-user licenses, while businesses requiring broader access may choose multi-user or enterprise licenses for cost-effective access to the report.
13. Are there any additional resources or data provided in the Cotton Industry report?
While the report offers comprehensive insights, it's advisable to review the specific contents or supplementary materials provided to ascertain if additional resources or data are available.
14. How can I stay updated on further developments or reports in the Cotton Industry?
To stay informed about further developments, trends, and reports in the Cotton Industry, consider subscribing to industry newsletters, following relevant companies and organizations, or regularly checking reputable industry news sources and publications.
Methodology
Step 1 - Identification of Relevant Samples Size from Population Database


Step 2 - Approaches for Defining Global Market Size (Value, Volume* & Price*)

Note*: In applicable scenarios
Step 3 - Data Sources
Primary Research
- Web Analytics
- Survey Reports
- Research Institute
- Latest Research Reports
- Opinion Leaders
Secondary Research
- Annual Reports
- White Paper
- Latest Press Release
- Industry Association
- Paid Database
- Investor Presentations

Step 4 - Data Triangulation
Involves using different sources of information in order to increase the validity of a study
These sources are likely to be stakeholders in a program - participants, other researchers, program staff, other community members, and so on.
Then we put all data in single framework & apply various statistical tools to find out the dynamic on the market.
During the analysis stage, feedback from the stakeholder groups would be compared to determine areas of agreement as well as areas of divergence