

Key Insights
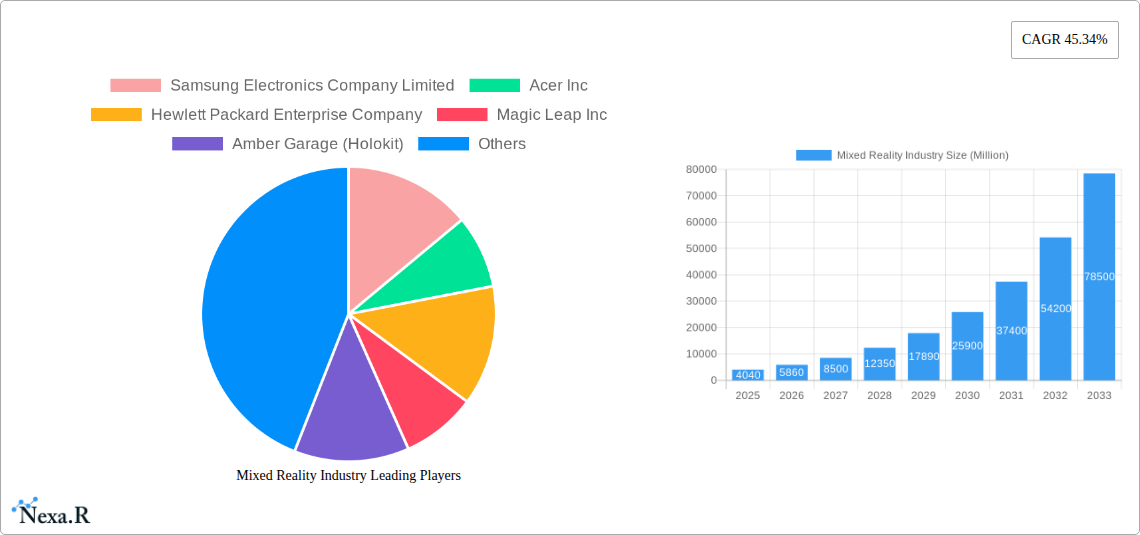
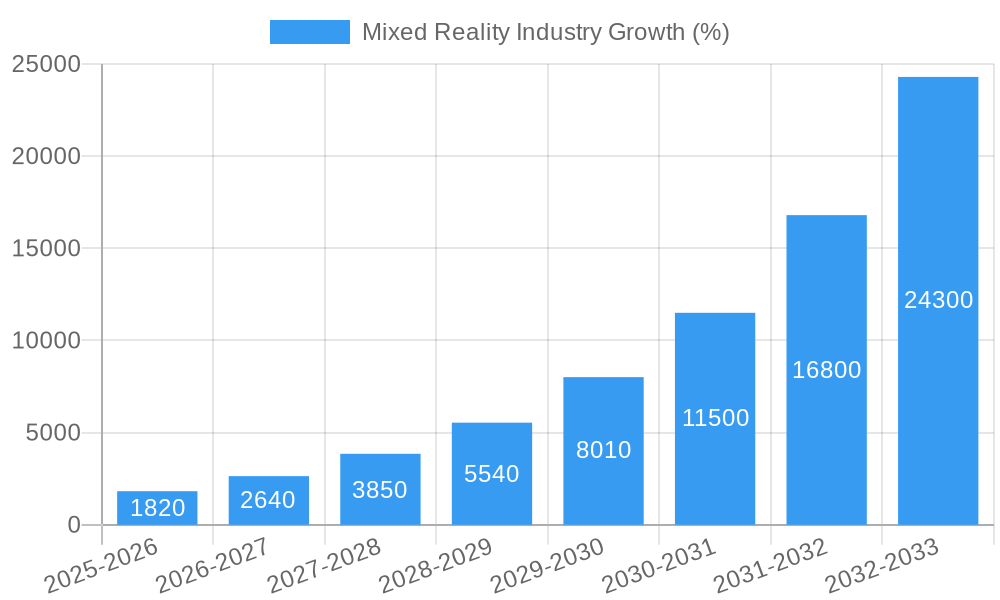
The mixed reality (MR) market is experiencing explosive growth, projected to reach $4.04 billion in 2025 and exhibiting a remarkable compound annual growth rate (CAGR) of 45.34%. This surge is driven by several key factors. The increasing adoption of MR technology across diverse end-user verticals, including education (interactive learning experiences), engineering (design and prototyping), entertainment (immersive gaming and virtual events), and healthcare (surgical simulations and remote patient monitoring), fuels this expansion. Furthermore, continuous technological advancements leading to more affordable and user-friendly MR devices, coupled with the rising demand for immersive and interactive experiences, contribute significantly to market growth. The development of sophisticated software and content ecosystems further enhances the overall user experience, driving wider adoption. However, challenges like the relatively high cost of MR headsets, the need for robust infrastructure, and the potential for motion sickness remain as restraints.
Despite these restraints, the future outlook for the MR market remains incredibly positive. The ongoing miniaturization and improved processing power of MR headsets, combined with the development of more engaging and interactive content, are poised to overcome these hurdles. The expansion into new applications, such as remote collaboration and training, will further fuel market growth. Key players like Samsung, Microsoft, and Meta are heavily investing in research and development, fostering innovation and competition. Geographic expansion, particularly in rapidly developing economies of Asia-Pacific, will also contribute significantly to the overall market size in the coming years. By 2033, we can expect the market to be significantly larger, driven by continued technological innovation and widespread adoption across various sectors. The competitive landscape is dynamic, with established tech giants and innovative startups vying for market share. This creates an exciting and rapidly evolving ecosystem within the mixed reality space.
This comprehensive report provides an in-depth analysis of the Mixed Reality (MR) industry, encompassing market dynamics, growth trends, regional dominance, product landscape, challenges, opportunities, and key players. The study period covers 2019-2033, with a base year of 2025 and a forecast period of 2025-2033. This report is essential for industry professionals, investors, and strategists seeking to navigate the dynamic MR landscape. The parent market is the broader augmented and virtual reality market, while the child market focuses specifically on the blending of real and virtual worlds offered by mixed reality technologies. The report projects a xx Million units market size by 2033.
Mixed Reality Industry Market Dynamics & Structure
The Mixed Reality market is characterized by a moderately concentrated landscape with key players like Microsoft, Meta, and Samsung holding significant shares, but with a large number of smaller players driving innovation. Technological innovation, particularly in areas like spatial computing and haptic feedback, are key growth drivers. Regulatory frameworks, while still evolving, are gradually shaping the industry’s trajectory. Competitive substitutes, such as advanced AR and VR technologies, present ongoing challenges. The end-user demographic is expanding beyond early adopters to include diverse segments like professionals and consumers. M&A activity remains robust, with an estimated xx deals in the historical period (2019-2024), indicating consolidation and expansion strategies among key players.
- Market Concentration: Moderately concentrated, with top 5 players holding approximately xx% market share in 2025.
- Technological Innovation Drivers: Advancements in display technology, processing power, and sensor integration.
- Regulatory Frameworks: Evolving data privacy and safety regulations impacting development and deployment.
- Competitive Product Substitutes: AR and VR technologies offering overlapping functionalities.
- End-User Demographics: Expanding across various age groups, professions, and consumer segments.
- M&A Trends: Significant activity observed, with xx major mergers and acquisitions recorded between 2019 and 2024.
Mixed Reality Industry Growth Trends & Insights
The global Mixed Reality market experienced significant growth during the historical period (2019-2024), driven by increasing adoption across various end-user verticals. This growth is expected to continue throughout the forecast period (2025-2033), albeit at a potentially moderating rate compared to the initial years of the market's expansion. Technological advancements in display technologies, processing power, and more compact and affordable devices are fueling wider adoption. Consumer behavior is shifting towards experiences that offer immersive and interactive interactions and blurring the lines between physical and digital. The market is projected to reach xx Million units by 2033, with a compound annual growth rate (CAGR) of xx% during the forecast period. Market penetration in key segments, especially in enterprise applications, is steadily increasing.
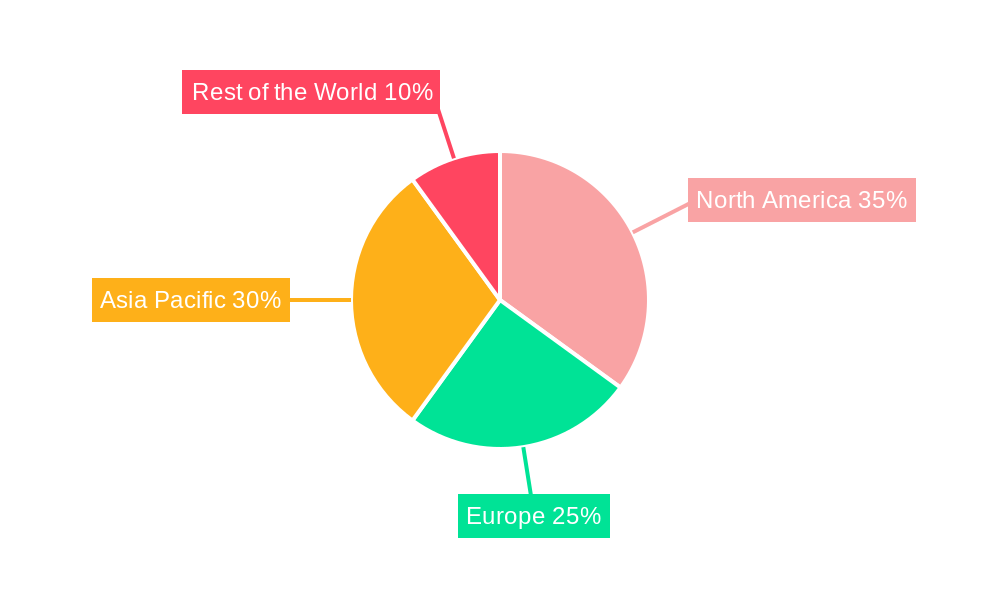
Dominant Regions, Countries, or Segments in Mixed Reality Industry
North America currently dominates the Mixed Reality market, driven by strong technological innovation, early adoption of MR technologies, and a robust ecosystem of developers and investors. However, Asia-Pacific is experiencing rapid growth, particularly in countries like China and Japan, fueled by rising consumer demand and increasing government support for technology development. Within end-user verticals, the Healthcare segment displays exceptional growth potential, followed by Engineering and Education.
- North America: Strong technological base, high adoption rates, and substantial investment in MR technology.
- Asia-Pacific: Rapid growth, driven by increasing consumer demand and government support.
- Healthcare Segment: High growth potential due to applications in surgical planning, medical training, and patient care.
- Engineering Segment: Growing adoption for design visualization, collaboration, and training.
- Education Segment: Increasing use in interactive learning experiences and simulations.
Mixed Reality Industry Product Landscape
The Mixed Reality product landscape is diverse, ranging from standalone headsets to tethered devices, each offering varying levels of immersion, performance, and user experience. Key product innovations include improvements in field of view, resolution, processing power, and haptic feedback. Applications span various sectors, from entertainment and gaming to industrial applications, healthcare, and education. Unique selling propositions often focus on enhanced realism, intuitive interfaces, and seamless integration with existing workflows.
Key Drivers, Barriers & Challenges in Mixed Reality Industry
Key Drivers:
- Technological advancements in display, processing, and sensor technologies.
- Increasing demand for immersive and interactive experiences across various sectors.
- Government initiatives and funding for MR technology development.
Challenges:
- High cost of MR devices limiting wider adoption.
- Technical limitations such as motion sickness and latency issues.
- Concerns around data privacy and cybersecurity.
- Supply chain disruptions impacting the availability of components.
Emerging Opportunities in Mixed Reality Industry
The emerging opportunities in Mixed Reality are vast, extending into previously untapped markets and applications. The integration of MR technology with other emerging technologies such as AI and IoT is opening new avenues for innovation. The expansion into new markets like retail, tourism, and real estate, coupled with the development of specialized applications, is creating significant growth potential. Furthermore, the shift towards more affordable and accessible MR devices is expanding the overall market reach.
Growth Accelerators in the Mixed Reality Industry
Technological breakthroughs in areas such as improved display technologies, more powerful processing units, and advanced sensor integration are vital drivers of long-term growth. Strategic partnerships between hardware and software companies are further strengthening the ecosystem and fostering innovation. Aggressive market expansion strategies, targeting new industry verticals and geographical regions, are also crucial in propelling the market forward.
Key Players Shaping the Mixed Reality Industry Market
- Samsung Electronics Company Limited
- Acer Inc
- Hewlett Packard Enterprise Company
- Magic Leap Inc
- Amber Garage (Holokit)
- Microsoft Corporation
- AsusTek Computer Inc
- Meta Platform Inc
- Dell Technologies Inc
- Occipital Inc
- List Not Exhaustive
Notable Milestones in Mixed Reality Industry Sector
- 2020: Microsoft launches HoloLens 2, enhancing mixed reality capabilities.
- 2021: Meta unveils its vision for the metaverse, driving increased interest in MR technologies.
- 2022: Several significant partnerships formed between MR hardware and software companies.
- 2023: Increased investment in MR startups and development of new applications in various sectors.
- 2024: Release of several new MR headsets with improved performance and features.
In-Depth Mixed Reality Industry Market Outlook
The future of the Mixed Reality market appears promising, with continued growth driven by technological advancements, increasing adoption across various sectors, and the emergence of new applications. Strategic opportunities lie in developing innovative solutions for specific industry verticals, expanding into new geographical markets, and fostering collaborations to strengthen the ecosystem. The market is poised for significant expansion, with substantial potential for value creation and market disruption in the years to come.
Mixed Reality Industry Segmentation
-
1. End-user Verticals
- 1.1. Education
- 1.2. Engineering
- 1.3. Entertainment
- 1.4. Healthcare
- 1.5. Other End-user Verticals
Mixed Reality Industry Segmentation By Geography
-
1. North America
- 1.1. United States
- 1.2. Canada
-
2. Europe
- 2.1. United Kingdom
- 2.2. France
- 2.3. Rest of Europe
-
3. Asia Pacific
- 3.1. China
- 3.2. India
- 3.3. Japan
- 3.4. Rest of Asia Pacific
- 4. Rest of the World
Mixed Reality Industry REPORT HIGHLIGHTS
| Aspects | Details |
|---|---|
| Study Period | 2019-2033 |
| Base Year | 2024 |
| Estimated Year | 2025 |
| Forecast Period | 2025-2033 |
| Historical Period | 2019-2024 |
| Growth Rate | CAGR of 45.34% from 2019-2033 |
| Segmentation |
|
Table of Contents
- 1. Introduction
- 1.1. Research Scope
- 1.2. Market Segmentation
- 1.3. Research Methodology
- 1.4. Definitions and Assumptions
- 2. Executive Summary
- 2.1. Introduction
- 3. Market Dynamics
- 3.1. Introduction
- 3.2. Market Drivers
- 3.2.1 High End-Electronic Consumer Market; Growing Adoption in Various Industries; Growing Awarness of Technology
- 3.2.2 along with Content Availability
- 3.3. Market Restrains
- 3.3.1. Lack of Standardization for Security of Digital Content
- 3.4. Market Trends
- 3.4.1. Education Sector will Hold a Significant Market Share
- 4. Market Factor Analysis
- 4.1. Porters Five Forces
- 4.2. Supply/Value Chain
- 4.3. PESTEL analysis
- 4.4. Market Entropy
- 4.5. Patent/Trademark Analysis
- 5. Global Mixed Reality Industry Analysis, Insights and Forecast, 2019-2031
- 5.1. Market Analysis, Insights and Forecast - by End-user Verticals
- 5.1.1. Education
- 5.1.2. Engineering
- 5.1.3. Entertainment
- 5.1.4. Healthcare
- 5.1.5. Other End-user Verticals
- 5.2. Market Analysis, Insights and Forecast - by Region
- 5.2.1. North America
- 5.2.2. Europe
- 5.2.3. Asia Pacific
- 5.2.4. Rest of the World
- 5.1. Market Analysis, Insights and Forecast - by End-user Verticals
- 6. North America Mixed Reality Industry Analysis, Insights and Forecast, 2019-2031
- 6.1. Market Analysis, Insights and Forecast - by End-user Verticals
- 6.1.1. Education
- 6.1.2. Engineering
- 6.1.3. Entertainment
- 6.1.4. Healthcare
- 6.1.5. Other End-user Verticals
- 6.1. Market Analysis, Insights and Forecast - by End-user Verticals
- 7. Europe Mixed Reality Industry Analysis, Insights and Forecast, 2019-2031
- 7.1. Market Analysis, Insights and Forecast - by End-user Verticals
- 7.1.1. Education
- 7.1.2. Engineering
- 7.1.3. Entertainment
- 7.1.4. Healthcare
- 7.1.5. Other End-user Verticals
- 7.1. Market Analysis, Insights and Forecast - by End-user Verticals
- 8. Asia Pacific Mixed Reality Industry Analysis, Insights and Forecast, 2019-2031
- 8.1. Market Analysis, Insights and Forecast - by End-user Verticals
- 8.1.1. Education
- 8.1.2. Engineering
- 8.1.3. Entertainment
- 8.1.4. Healthcare
- 8.1.5. Other End-user Verticals
- 8.1. Market Analysis, Insights and Forecast - by End-user Verticals
- 9. Rest of the World Mixed Reality Industry Analysis, Insights and Forecast, 2019-2031
- 9.1. Market Analysis, Insights and Forecast - by End-user Verticals
- 9.1.1. Education
- 9.1.2. Engineering
- 9.1.3. Entertainment
- 9.1.4. Healthcare
- 9.1.5. Other End-user Verticals
- 9.1. Market Analysis, Insights and Forecast - by End-user Verticals
- 10. North America Mixed Reality Industry Analysis, Insights and Forecast, 2019-2031
- 10.1. Market Analysis, Insights and Forecast - By Country/Sub-region
- 10.1.1 United States
- 10.1.2 Canada
- 11. Europe Mixed Reality Industry Analysis, Insights and Forecast, 2019-2031
- 11.1. Market Analysis, Insights and Forecast - By Country/Sub-region
- 11.1.1 United Kingdom
- 11.1.2 France
- 11.1.3 Rest of Europe
- 12. Asia Pacific Mixed Reality Industry Analysis, Insights and Forecast, 2019-2031
- 12.1. Market Analysis, Insights and Forecast - By Country/Sub-region
- 12.1.1 China
- 12.1.2 India
- 12.1.3 Japan
- 12.1.4 Rest of Asia Pacific
- 13. Rest of the World Mixed Reality Industry Analysis, Insights and Forecast, 2019-2031
- 13.1. Market Analysis, Insights and Forecast - By Country/Sub-region
- 13.1.1.
- 14. Competitive Analysis
- 14.1. Global Market Share Analysis 2024
- 14.2. Company Profiles
- 14.2.1 Samsung Electronics Company Limited
- 14.2.1.1. Overview
- 14.2.1.2. Products
- 14.2.1.3. SWOT Analysis
- 14.2.1.4. Recent Developments
- 14.2.1.5. Financials (Based on Availability)
- 14.2.2 Acer Inc
- 14.2.2.1. Overview
- 14.2.2.2. Products
- 14.2.2.3. SWOT Analysis
- 14.2.2.4. Recent Developments
- 14.2.2.5. Financials (Based on Availability)
- 14.2.3 Hewlett Packard Enterprise Company
- 14.2.3.1. Overview
- 14.2.3.2. Products
- 14.2.3.3. SWOT Analysis
- 14.2.3.4. Recent Developments
- 14.2.3.5. Financials (Based on Availability)
- 14.2.4 Magic Leap Inc
- 14.2.4.1. Overview
- 14.2.4.2. Products
- 14.2.4.3. SWOT Analysis
- 14.2.4.4. Recent Developments
- 14.2.4.5. Financials (Based on Availability)
- 14.2.5 Amber Garage (Holokit)
- 14.2.5.1. Overview
- 14.2.5.2. Products
- 14.2.5.3. SWOT Analysis
- 14.2.5.4. Recent Developments
- 14.2.5.5. Financials (Based on Availability)
- 14.2.6 Microsoft Corporation
- 14.2.6.1. Overview
- 14.2.6.2. Products
- 14.2.6.3. SWOT Analysis
- 14.2.6.4. Recent Developments
- 14.2.6.5. Financials (Based on Availability)
- 14.2.7 AsusTek Computer Inc
- 14.2.7.1. Overview
- 14.2.7.2. Products
- 14.2.7.3. SWOT Analysis
- 14.2.7.4. Recent Developments
- 14.2.7.5. Financials (Based on Availability)
- 14.2.8 Meta Platform Inc
- 14.2.8.1. Overview
- 14.2.8.2. Products
- 14.2.8.3. SWOT Analysis
- 14.2.8.4. Recent Developments
- 14.2.8.5. Financials (Based on Availability)
- 14.2.9 Dell Technologies Inc
- 14.2.9.1. Overview
- 14.2.9.2. Products
- 14.2.9.3. SWOT Analysis
- 14.2.9.4. Recent Developments
- 14.2.9.5. Financials (Based on Availability)
- 14.2.10 Occipital Inc *List Not Exhaustive
- 14.2.10.1. Overview
- 14.2.10.2. Products
- 14.2.10.3. SWOT Analysis
- 14.2.10.4. Recent Developments
- 14.2.10.5. Financials (Based on Availability)
- 14.2.1 Samsung Electronics Company Limited
List of Figures
- Figure 1: Global Mixed Reality Industry Revenue Breakdown (Million, %) by Region 2024 & 2032
- Figure 2: North America Mixed Reality Industry Revenue (Million), by Country 2024 & 2032
- Figure 3: North America Mixed Reality Industry Revenue Share (%), by Country 2024 & 2032
- Figure 4: Europe Mixed Reality Industry Revenue (Million), by Country 2024 & 2032
- Figure 5: Europe Mixed Reality Industry Revenue Share (%), by Country 2024 & 2032
- Figure 6: Asia Pacific Mixed Reality Industry Revenue (Million), by Country 2024 & 2032
- Figure 7: Asia Pacific Mixed Reality Industry Revenue Share (%), by Country 2024 & 2032
- Figure 8: Rest of the World Mixed Reality Industry Revenue (Million), by Country 2024 & 2032
- Figure 9: Rest of the World Mixed Reality Industry Revenue Share (%), by Country 2024 & 2032
- Figure 10: North America Mixed Reality Industry Revenue (Million), by End-user Verticals 2024 & 2032
- Figure 11: North America Mixed Reality Industry Revenue Share (%), by End-user Verticals 2024 & 2032
- Figure 12: North America Mixed Reality Industry Revenue (Million), by Country 2024 & 2032
- Figure 13: North America Mixed Reality Industry Revenue Share (%), by Country 2024 & 2032
- Figure 14: Europe Mixed Reality Industry Revenue (Million), by End-user Verticals 2024 & 2032
- Figure 15: Europe Mixed Reality Industry Revenue Share (%), by End-user Verticals 2024 & 2032
- Figure 16: Europe Mixed Reality Industry Revenue (Million), by Country 2024 & 2032
- Figure 17: Europe Mixed Reality Industry Revenue Share (%), by Country 2024 & 2032
- Figure 18: Asia Pacific Mixed Reality Industry Revenue (Million), by End-user Verticals 2024 & 2032
- Figure 19: Asia Pacific Mixed Reality Industry Revenue Share (%), by End-user Verticals 2024 & 2032
- Figure 20: Asia Pacific Mixed Reality Industry Revenue (Million), by Country 2024 & 2032
- Figure 21: Asia Pacific Mixed Reality Industry Revenue Share (%), by Country 2024 & 2032
- Figure 22: Rest of the World Mixed Reality Industry Revenue (Million), by End-user Verticals 2024 & 2032
- Figure 23: Rest of the World Mixed Reality Industry Revenue Share (%), by End-user Verticals 2024 & 2032
- Figure 24: Rest of the World Mixed Reality Industry Revenue (Million), by Country 2024 & 2032
- Figure 25: Rest of the World Mixed Reality Industry Revenue Share (%), by Country 2024 & 2032
List of Tables
- Table 1: Global Mixed Reality Industry Revenue Million Forecast, by Region 2019 & 2032
- Table 2: Global Mixed Reality Industry Revenue Million Forecast, by End-user Verticals 2019 & 2032
- Table 3: Global Mixed Reality Industry Revenue Million Forecast, by Region 2019 & 2032
- Table 4: Global Mixed Reality Industry Revenue Million Forecast, by Country 2019 & 2032
- Table 5: United States Mixed Reality Industry Revenue (Million) Forecast, by Application 2019 & 2032
- Table 6: Canada Mixed Reality Industry Revenue (Million) Forecast, by Application 2019 & 2032
- Table 7: Global Mixed Reality Industry Revenue Million Forecast, by Country 2019 & 2032
- Table 8: United Kingdom Mixed Reality Industry Revenue (Million) Forecast, by Application 2019 & 2032
- Table 9: France Mixed Reality Industry Revenue (Million) Forecast, by Application 2019 & 2032
- Table 10: Rest of Europe Mixed Reality Industry Revenue (Million) Forecast, by Application 2019 & 2032
- Table 11: Global Mixed Reality Industry Revenue Million Forecast, by Country 2019 & 2032
- Table 12: China Mixed Reality Industry Revenue (Million) Forecast, by Application 2019 & 2032
- Table 13: India Mixed Reality Industry Revenue (Million) Forecast, by Application 2019 & 2032
- Table 14: Japan Mixed Reality Industry Revenue (Million) Forecast, by Application 2019 & 2032
- Table 15: Rest of Asia Pacific Mixed Reality Industry Revenue (Million) Forecast, by Application 2019 & 2032
- Table 16: Global Mixed Reality Industry Revenue Million Forecast, by Country 2019 & 2032
- Table 17: Mixed Reality Industry Revenue (Million) Forecast, by Application 2019 & 2032
- Table 18: Global Mixed Reality Industry Revenue Million Forecast, by End-user Verticals 2019 & 2032
- Table 19: Global Mixed Reality Industry Revenue Million Forecast, by Country 2019 & 2032
- Table 20: United States Mixed Reality Industry Revenue (Million) Forecast, by Application 2019 & 2032
- Table 21: Canada Mixed Reality Industry Revenue (Million) Forecast, by Application 2019 & 2032
- Table 22: Global Mixed Reality Industry Revenue Million Forecast, by End-user Verticals 2019 & 2032
- Table 23: Global Mixed Reality Industry Revenue Million Forecast, by Country 2019 & 2032
- Table 24: United Kingdom Mixed Reality Industry Revenue (Million) Forecast, by Application 2019 & 2032
- Table 25: France Mixed Reality Industry Revenue (Million) Forecast, by Application 2019 & 2032
- Table 26: Rest of Europe Mixed Reality Industry Revenue (Million) Forecast, by Application 2019 & 2032
- Table 27: Global Mixed Reality Industry Revenue Million Forecast, by End-user Verticals 2019 & 2032
- Table 28: Global Mixed Reality Industry Revenue Million Forecast, by Country 2019 & 2032
- Table 29: China Mixed Reality Industry Revenue (Million) Forecast, by Application 2019 & 2032
- Table 30: India Mixed Reality Industry Revenue (Million) Forecast, by Application 2019 & 2032
- Table 31: Japan Mixed Reality Industry Revenue (Million) Forecast, by Application 2019 & 2032
- Table 32: Rest of Asia Pacific Mixed Reality Industry Revenue (Million) Forecast, by Application 2019 & 2032
- Table 33: Global Mixed Reality Industry Revenue Million Forecast, by End-user Verticals 2019 & 2032
- Table 34: Global Mixed Reality Industry Revenue Million Forecast, by Country 2019 & 2032
Frequently Asked Questions
1. What is the projected Compound Annual Growth Rate (CAGR) of the Mixed Reality Industry?
The projected CAGR is approximately 45.34%.
2. Which companies are prominent players in the Mixed Reality Industry?
Key companies in the market include Samsung Electronics Company Limited, Acer Inc, Hewlett Packard Enterprise Company, Magic Leap Inc, Amber Garage (Holokit), Microsoft Corporation, AsusTek Computer Inc, Meta Platform Inc, Dell Technologies Inc, Occipital Inc *List Not Exhaustive.
3. What are the main segments of the Mixed Reality Industry?
The market segments include End-user Verticals.
4. Can you provide details about the market size?
The market size is estimated to be USD 4.04 Million as of 2022.
5. What are some drivers contributing to market growth?
High End-Electronic Consumer Market; Growing Adoption in Various Industries; Growing Awarness of Technology. along with Content Availability.
6. What are the notable trends driving market growth?
Education Sector will Hold a Significant Market Share.
7. Are there any restraints impacting market growth?
Lack of Standardization for Security of Digital Content.
8. Can you provide examples of recent developments in the market?
N/A
9. What pricing options are available for accessing the report?
Pricing options include single-user, multi-user, and enterprise licenses priced at USD 4750, USD 5250, and USD 8750 respectively.
10. Is the market size provided in terms of value or volume?
The market size is provided in terms of value, measured in Million.
11. Are there any specific market keywords associated with the report?
Yes, the market keyword associated with the report is "Mixed Reality Industry," which aids in identifying and referencing the specific market segment covered.
12. How do I determine which pricing option suits my needs best?
The pricing options vary based on user requirements and access needs. Individual users may opt for single-user licenses, while businesses requiring broader access may choose multi-user or enterprise licenses for cost-effective access to the report.
13. Are there any additional resources or data provided in the Mixed Reality Industry report?
While the report offers comprehensive insights, it's advisable to review the specific contents or supplementary materials provided to ascertain if additional resources or data are available.
14. How can I stay updated on further developments or reports in the Mixed Reality Industry?
To stay informed about further developments, trends, and reports in the Mixed Reality Industry, consider subscribing to industry newsletters, following relevant companies and organizations, or regularly checking reputable industry news sources and publications.
Methodology
Step 1 - Identification of Relevant Samples Size from Population Database


Step 2 - Approaches for Defining Global Market Size (Value, Volume* & Price*)

Note*: In applicable scenarios
Step 3 - Data Sources
Primary Research
- Web Analytics
- Survey Reports
- Research Institute
- Latest Research Reports
- Opinion Leaders
Secondary Research
- Annual Reports
- White Paper
- Latest Press Release
- Industry Association
- Paid Database
- Investor Presentations

Step 4 - Data Triangulation
Involves using different sources of information in order to increase the validity of a study
These sources are likely to be stakeholders in a program - participants, other researchers, program staff, other community members, and so on.
Then we put all data in single framework & apply various statistical tools to find out the dynamic on the market.
During the analysis stage, feedback from the stakeholder groups would be compared to determine areas of agreement as well as areas of divergence
