

Key Insights
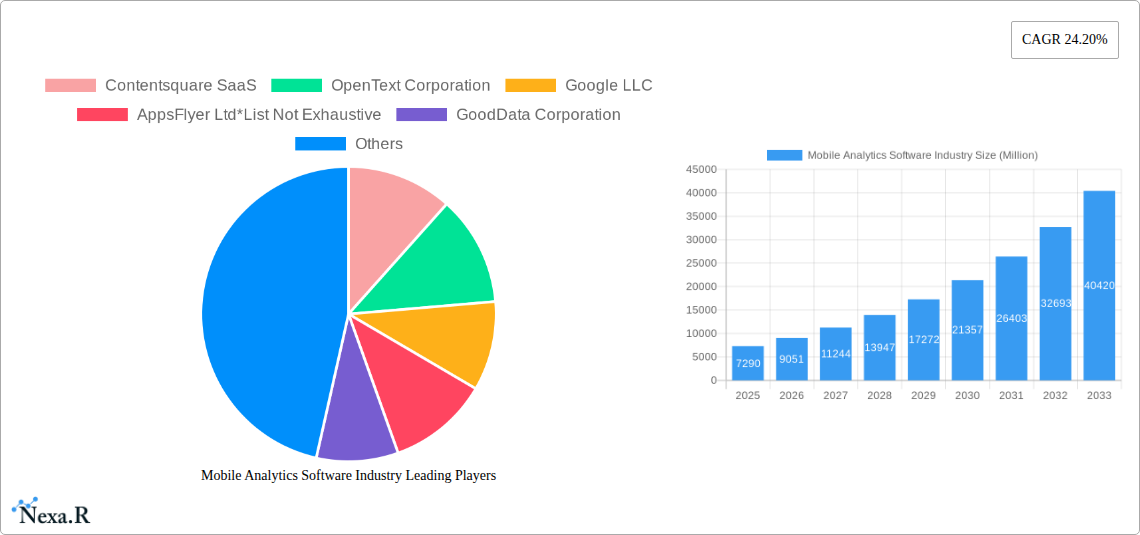
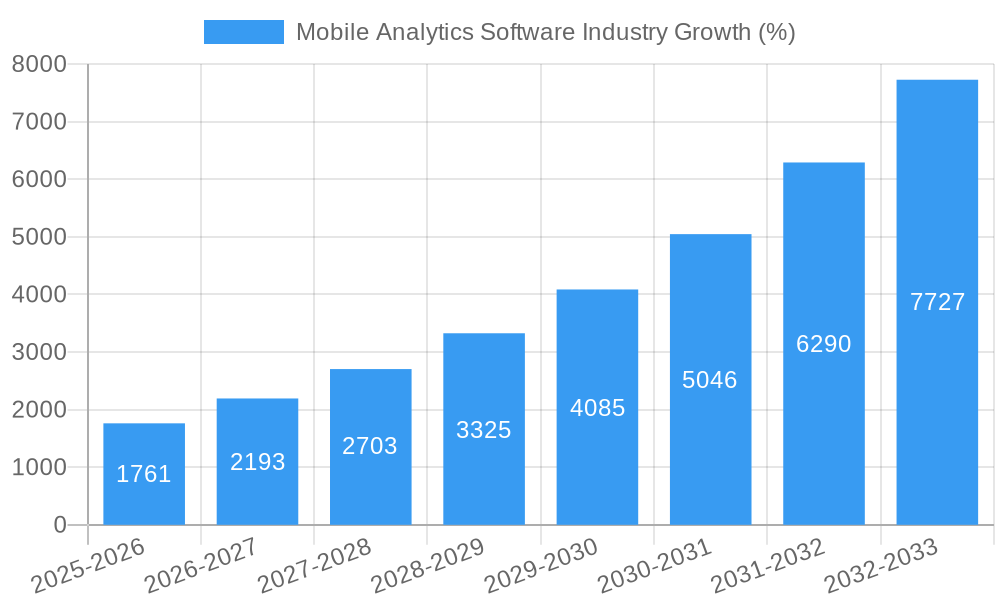
The mobile analytics software market, valued at $7.29 billion in 2025, is experiencing robust growth, projected to expand at a compound annual growth rate (CAGR) of 24.20% from 2025 to 2033. This significant expansion is driven by several key factors. The increasing adoption of mobile devices across various sectors, coupled with the rising need for businesses to understand user behavior and optimize their mobile applications, fuels demand for sophisticated analytics solutions. Furthermore, advancements in data analytics technologies, including artificial intelligence (AI) and machine learning (ML), are enabling more insightful and actionable data analysis, further bolstering market growth. The ability to personalize user experiences, enhance app performance, and measure marketing campaign effectiveness are significant drivers for businesses investing in these solutions. Segmentation within the market reveals strong growth across various sectors, including retail, BFSI (Banking, Financial Services, and Insurance), and IT and Telecom, each leveraging mobile analytics to improve customer engagement and operational efficiency. Competition is fierce, with major players like Google, Salesforce, Adobe, and others vying for market share through continuous innovation and the development of comprehensive analytics platforms.
The market’s trajectory indicates continued expansion throughout the forecast period. While challenges exist, including data privacy concerns and the complexity of implementing and integrating analytics solutions, the overall market outlook remains positive. The increasing sophistication of mobile applications and the growing reliance on data-driven decision-making will continue to drive the demand for advanced mobile analytics software. This trend is expected to lead to further market consolidation and the emergence of new, specialized solutions addressing niche market needs. The growth in emerging markets, particularly in Asia-Pacific, will also contribute significantly to the overall market expansion. The sustained focus on user experience optimization, coupled with the imperative to maximize return on investment in mobile applications, will ensure robust growth for the mobile analytics software market in the coming years.
Mobile Analytics Software Market Report: 2019-2033
This comprehensive report offers a deep dive into the dynamic Mobile Analytics Software industry, providing invaluable insights for businesses, investors, and industry professionals. With a focus on market trends, competitive landscapes, and future growth projections, this report covers the period from 2019 to 2033, with 2025 as the base and estimated year.
Mobile Analytics Software Industry Market Dynamics & Structure
The mobile analytics software market is characterized by intense competition, rapid technological innovation, and evolving regulatory landscapes. Market concentration is moderate, with several large players holding significant shares, while numerous smaller players compete in niche segments. The market is witnessing a wave of mergers and acquisitions (M&A) activity, driven by companies seeking to expand their product portfolios and market reach. Technological advancements, such as AI-powered analytics and real-time data processing, are key innovation drivers, while the increasing complexity of privacy regulations presents a significant challenge. Substitutes for mobile analytics software exist, including in-house analytics solutions, but dedicated software offers superior capabilities and scalability. The end-user demographics are broad, encompassing various industries, with a notable shift towards mobile-first strategies driving increased adoption.
- Market Concentration: Moderately concentrated, with top 5 players holding approximately xx% market share in 2024.
- M&A Activity: xx deals recorded between 2019-2024, with an average deal value of xx Million.
- Innovation Barriers: High initial investment costs, data privacy concerns, and talent acquisition.
- Regulatory Frameworks: Evolving data privacy regulations (e.g., GDPR, CCPA) impacting data collection and usage.
- End-User Demographics: Significant growth driven by Retail, BFSI, and IT & Telecom sectors.
Mobile Analytics Software Industry Growth Trends & Insights
The mobile analytics software market experienced substantial growth during the historical period (2019-2024), driven by the increasing adoption of mobile devices and the rising demand for data-driven decision-making across industries. The market size expanded from xx Million in 2019 to xx Million in 2024, exhibiting a CAGR of xx%. This growth is attributed to several factors, including the proliferation of mobile apps, the growing importance of user engagement metrics, and the increasing sophistication of analytics tools. Technological advancements, such as artificial intelligence (AI) and machine learning (ML), are further accelerating market growth. Consumer behavior shifts towards mobile-first experiences are fueling demand for sophisticated analytics solutions. The forecast period (2025-2033) anticipates continued expansion, with a projected CAGR of xx%, driven by factors like the expansion of 5G technology and the growing importance of personalized user experiences. Market penetration is expected to reach xx% by 2033.
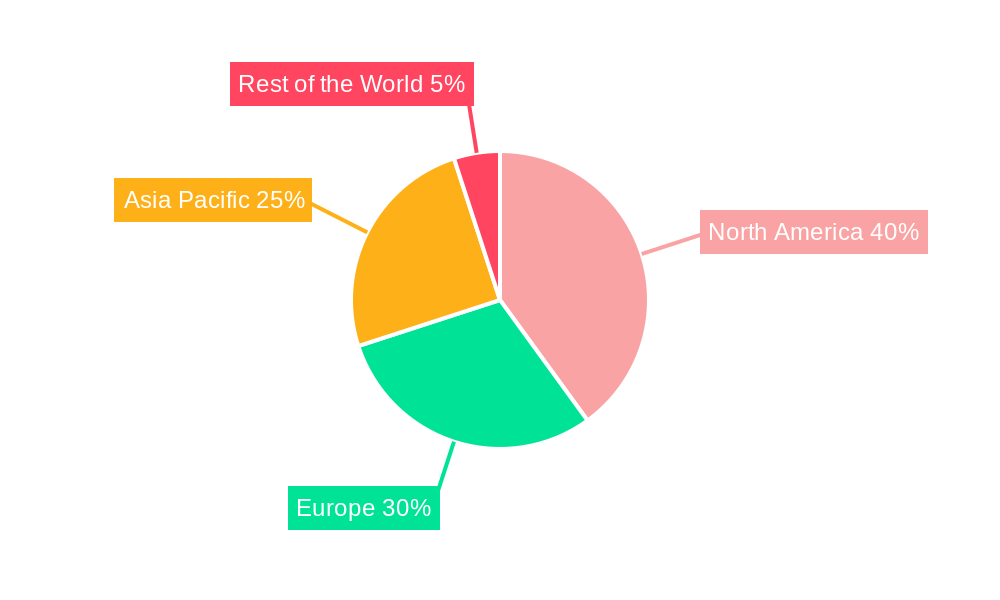
Dominant Regions, Countries, or Segments in Mobile Analytics Software Industry
North America currently dominates the mobile analytics software market, driven by high technology adoption, a robust startup ecosystem, and the presence of major technology companies. However, the Asia-Pacific region is anticipated to witness the highest growth rate during the forecast period, fueled by the rapid expansion of the mobile user base and increasing digitalization across various sectors.
By Type:
- Application Analytics: Holds the largest market share, owing to the rising demand for app performance monitoring and user engagement analysis.
- Campaign Analytics: Experiencing rapid growth due to the increased focus on mobile marketing and ROI measurement.
By End-User Vertical:
- Retail: A major driver of market growth due to the increasing adoption of mobile commerce and the need for personalized customer experiences.
- BFSI (Banking, Financial Services, and Insurance): Significant growth driven by the increasing adoption of mobile banking and fintech solutions.
Key Drivers:
- Strong mobile infrastructure and high internet penetration in North America.
- Rapid growth of the mobile user base in the Asia-Pacific region.
- Increased government investments in digital infrastructure.
- Growing adoption of cloud-based analytics solutions.
Mobile Analytics Software Industry Product Landscape
The mobile analytics software market showcases a wide range of products, from basic analytics dashboards to sophisticated AI-powered platforms. Many solutions offer real-time data visualization, customizable dashboards, user segmentation, and in-depth performance metrics, including key performance indicators (KPIs) such as user acquisition cost (CAC), customer lifetime value (CLTV), and retention rates. Unique selling propositions often revolve around ease of use, data integration capabilities, advanced analytics features, and specific industry-focused applications. Technological advancements, like advanced machine learning algorithms, predictive analytics, and improved data visualization techniques, are continuously enhancing product functionalities.
Key Drivers, Barriers & Challenges in Mobile Analytics Software Industry
Key Drivers:
- The rising adoption of smartphones and mobile apps.
- The growing need for data-driven decision-making in businesses.
- The increasing complexity of mobile marketing campaigns.
Challenges and Restraints:
- Data privacy concerns and regulatory compliance.
- High implementation and maintenance costs.
- Competition from free or open-source alternatives.
- Data security threats and potential breaches.
Emerging Opportunities in Mobile Analytics Software Industry
Emerging opportunities lie in areas such as predictive analytics, personalization, cross-platform analytics, and the integration of mobile analytics with other data sources. The expansion into untapped markets, especially in developing economies, presents significant growth potential. The integration of mobile analytics with emerging technologies such as IoT (Internet of Things) and Blockchain offers new avenues for innovation.
Growth Accelerators in the Mobile Analytics Software Industry
Technological breakthroughs in AI and ML, strategic partnerships between analytics providers and mobile app developers, and expansion into new geographic markets are key growth accelerators. The increasing focus on data security and compliance will also drive market growth, as businesses seek secure and reliable analytics solutions.
Key Players Shaping the Mobile Analytics Software Industry Market
- Contentsquare SaaS
- OpenText Corporation
- Google LLC
- AppsFlyer Ltd
- GoodData Corporation
- Salesforce com Inc
- Microsoft Corporation
- Adobe Inc
- Oracle Corp
- Facebook Inc
Notable Milestones in Mobile Analytics Software Industry Sector
- April 2022: Adjust launched Adjust Datascape, enhancing real-time KPI access for app developers.
- August 2022: Pinterest introduced real-time mobile access to Pin Analytics.
- February 2022: IronSource unveiled its new app analytics tool, offering a comprehensive solution for app monetization, user recruitment, and analytics.
In-Depth Mobile Analytics Software Industry Market Outlook
The future of the mobile analytics software market is promising, with continued growth driven by technological advancements, increasing mobile adoption, and the rising demand for data-driven insights. Strategic partnerships, expansion into new markets, and innovative product offerings will shape the market landscape in the coming years. The market presents substantial opportunities for both established players and new entrants who can effectively leverage technological advancements and adapt to the evolving regulatory environment.
Mobile Analytics Software Industry Segmentation
-
1. Type
- 1.1. Application Analytics
- 1.2. Campaign Analytics
- 1.3. Service Analytics
- 1.4. Other Applications
-
2. End-User Vertical
- 2.1. Retail
- 2.2. BFSI
- 2.3. Government
- 2.4. IT and Telecom
- 2.5. Media and Entertainment
- 2.6. Other End-User Verticals
Mobile Analytics Software Industry Segmentation By Geography
- 1. North America
- 2. Europe
- 3. Asia Pacific
- 4. Rest of the World
Mobile Analytics Software Industry REPORT HIGHLIGHTS
| Aspects | Details |
|---|---|
| Study Period | 2019-2033 |
| Base Year | 2024 |
| Estimated Year | 2025 |
| Forecast Period | 2025-2033 |
| Historical Period | 2019-2024 |
| Growth Rate | CAGR of 24.20% from 2019-2033 |
| Segmentation |
|
Table of Contents
- 1. Introduction
- 1.1. Research Scope
- 1.2. Market Segmentation
- 1.3. Research Methodology
- 1.4. Definitions and Assumptions
- 2. Executive Summary
- 2.1. Introduction
- 3. Market Dynamics
- 3.1. Introduction
- 3.2. Market Drivers
- 3.2.1. Smartphone Revolution to Generate Enormous Data; Data Explosion from E- commerce Likely to Propel the Market
- 3.3. Market Restrains
- 3.3.1. Failure of the Widespread Adoption of 4G Services Due to Insufficient Users; Lack of Internet Penetration in Certain Areas
- 3.4. Market Trends
- 3.4.1. Retail Industry Holds Significant Market Share
- 4. Market Factor Analysis
- 4.1. Porters Five Forces
- 4.2. Supply/Value Chain
- 4.3. PESTEL analysis
- 4.4. Market Entropy
- 4.5. Patent/Trademark Analysis
- 5. Global Mobile Analytics Software Industry Analysis, Insights and Forecast, 2019-2031
- 5.1. Market Analysis, Insights and Forecast - by Type
- 5.1.1. Application Analytics
- 5.1.2. Campaign Analytics
- 5.1.3. Service Analytics
- 5.1.4. Other Applications
- 5.2. Market Analysis, Insights and Forecast - by End-User Vertical
- 5.2.1. Retail
- 5.2.2. BFSI
- 5.2.3. Government
- 5.2.4. IT and Telecom
- 5.2.5. Media and Entertainment
- 5.2.6. Other End-User Verticals
- 5.3. Market Analysis, Insights and Forecast - by Region
- 5.3.1. North America
- 5.3.2. Europe
- 5.3.3. Asia Pacific
- 5.3.4. Rest of the World
- 5.1. Market Analysis, Insights and Forecast - by Type
- 6. North America Mobile Analytics Software Industry Analysis, Insights and Forecast, 2019-2031
- 6.1. Market Analysis, Insights and Forecast - by Type
- 6.1.1. Application Analytics
- 6.1.2. Campaign Analytics
- 6.1.3. Service Analytics
- 6.1.4. Other Applications
- 6.2. Market Analysis, Insights and Forecast - by End-User Vertical
- 6.2.1. Retail
- 6.2.2. BFSI
- 6.2.3. Government
- 6.2.4. IT and Telecom
- 6.2.5. Media and Entertainment
- 6.2.6. Other End-User Verticals
- 6.1. Market Analysis, Insights and Forecast - by Type
- 7. Europe Mobile Analytics Software Industry Analysis, Insights and Forecast, 2019-2031
- 7.1. Market Analysis, Insights and Forecast - by Type
- 7.1.1. Application Analytics
- 7.1.2. Campaign Analytics
- 7.1.3. Service Analytics
- 7.1.4. Other Applications
- 7.2. Market Analysis, Insights and Forecast - by End-User Vertical
- 7.2.1. Retail
- 7.2.2. BFSI
- 7.2.3. Government
- 7.2.4. IT and Telecom
- 7.2.5. Media and Entertainment
- 7.2.6. Other End-User Verticals
- 7.1. Market Analysis, Insights and Forecast - by Type
- 8. Asia Pacific Mobile Analytics Software Industry Analysis, Insights and Forecast, 2019-2031
- 8.1. Market Analysis, Insights and Forecast - by Type
- 8.1.1. Application Analytics
- 8.1.2. Campaign Analytics
- 8.1.3. Service Analytics
- 8.1.4. Other Applications
- 8.2. Market Analysis, Insights and Forecast - by End-User Vertical
- 8.2.1. Retail
- 8.2.2. BFSI
- 8.2.3. Government
- 8.2.4. IT and Telecom
- 8.2.5. Media and Entertainment
- 8.2.6. Other End-User Verticals
- 8.1. Market Analysis, Insights and Forecast - by Type
- 9. Rest of the World Mobile Analytics Software Industry Analysis, Insights and Forecast, 2019-2031
- 9.1. Market Analysis, Insights and Forecast - by Type
- 9.1.1. Application Analytics
- 9.1.2. Campaign Analytics
- 9.1.3. Service Analytics
- 9.1.4. Other Applications
- 9.2. Market Analysis, Insights and Forecast - by End-User Vertical
- 9.2.1. Retail
- 9.2.2. BFSI
- 9.2.3. Government
- 9.2.4. IT and Telecom
- 9.2.5. Media and Entertainment
- 9.2.6. Other End-User Verticals
- 9.1. Market Analysis, Insights and Forecast - by Type
- 10. North America Mobile Analytics Software Industry Analysis, Insights and Forecast, 2019-2031
- 10.1. Market Analysis, Insights and Forecast - By Country/Sub-region
- 10.1.1.
- 11. Europe Mobile Analytics Software Industry Analysis, Insights and Forecast, 2019-2031
- 11.1. Market Analysis, Insights and Forecast - By Country/Sub-region
- 11.1.1.
- 12. Asia Pacific Mobile Analytics Software Industry Analysis, Insights and Forecast, 2019-2031
- 12.1. Market Analysis, Insights and Forecast - By Country/Sub-region
- 12.1.1.
- 13. Rest of the World Mobile Analytics Software Industry Analysis, Insights and Forecast, 2019-2031
- 13.1. Market Analysis, Insights and Forecast - By Country/Sub-region
- 13.1.1.
- 14. Competitive Analysis
- 14.1. Global Market Share Analysis 2024
- 14.2. Company Profiles
- 14.2.1 Contentsquare SaaS
- 14.2.1.1. Overview
- 14.2.1.2. Products
- 14.2.1.3. SWOT Analysis
- 14.2.1.4. Recent Developments
- 14.2.1.5. Financials (Based on Availability)
- 14.2.2 OpenText Corporation
- 14.2.2.1. Overview
- 14.2.2.2. Products
- 14.2.2.3. SWOT Analysis
- 14.2.2.4. Recent Developments
- 14.2.2.5. Financials (Based on Availability)
- 14.2.3 Google LLC
- 14.2.3.1. Overview
- 14.2.3.2. Products
- 14.2.3.3. SWOT Analysis
- 14.2.3.4. Recent Developments
- 14.2.3.5. Financials (Based on Availability)
- 14.2.4 AppsFlyer Ltd*List Not Exhaustive
- 14.2.4.1. Overview
- 14.2.4.2. Products
- 14.2.4.3. SWOT Analysis
- 14.2.4.4. Recent Developments
- 14.2.4.5. Financials (Based on Availability)
- 14.2.5 GoodData Corporation
- 14.2.5.1. Overview
- 14.2.5.2. Products
- 14.2.5.3. SWOT Analysis
- 14.2.5.4. Recent Developments
- 14.2.5.5. Financials (Based on Availability)
- 14.2.6 Salesforce com Inc
- 14.2.6.1. Overview
- 14.2.6.2. Products
- 14.2.6.3. SWOT Analysis
- 14.2.6.4. Recent Developments
- 14.2.6.5. Financials (Based on Availability)
- 14.2.7 Microsoft Corporation
- 14.2.7.1. Overview
- 14.2.7.2. Products
- 14.2.7.3. SWOT Analysis
- 14.2.7.4. Recent Developments
- 14.2.7.5. Financials (Based on Availability)
- 14.2.8 Adobe Inc
- 14.2.8.1. Overview
- 14.2.8.2. Products
- 14.2.8.3. SWOT Analysis
- 14.2.8.4. Recent Developments
- 14.2.8.5. Financials (Based on Availability)
- 14.2.9 Oracle Corp
- 14.2.9.1. Overview
- 14.2.9.2. Products
- 14.2.9.3. SWOT Analysis
- 14.2.9.4. Recent Developments
- 14.2.9.5. Financials (Based on Availability)
- 14.2.10 Facebook Inc
- 14.2.10.1. Overview
- 14.2.10.2. Products
- 14.2.10.3. SWOT Analysis
- 14.2.10.4. Recent Developments
- 14.2.10.5. Financials (Based on Availability)
- 14.2.1 Contentsquare SaaS
List of Figures
- Figure 1: Global Mobile Analytics Software Industry Revenue Breakdown (Million, %) by Region 2024 & 2032
- Figure 2: North America Mobile Analytics Software Industry Revenue (Million), by Country 2024 & 2032
- Figure 3: North America Mobile Analytics Software Industry Revenue Share (%), by Country 2024 & 2032
- Figure 4: Europe Mobile Analytics Software Industry Revenue (Million), by Country 2024 & 2032
- Figure 5: Europe Mobile Analytics Software Industry Revenue Share (%), by Country 2024 & 2032
- Figure 6: Asia Pacific Mobile Analytics Software Industry Revenue (Million), by Country 2024 & 2032
- Figure 7: Asia Pacific Mobile Analytics Software Industry Revenue Share (%), by Country 2024 & 2032
- Figure 8: Rest of the World Mobile Analytics Software Industry Revenue (Million), by Country 2024 & 2032
- Figure 9: Rest of the World Mobile Analytics Software Industry Revenue Share (%), by Country 2024 & 2032
- Figure 10: North America Mobile Analytics Software Industry Revenue (Million), by Type 2024 & 2032
- Figure 11: North America Mobile Analytics Software Industry Revenue Share (%), by Type 2024 & 2032
- Figure 12: North America Mobile Analytics Software Industry Revenue (Million), by End-User Vertical 2024 & 2032
- Figure 13: North America Mobile Analytics Software Industry Revenue Share (%), by End-User Vertical 2024 & 2032
- Figure 14: North America Mobile Analytics Software Industry Revenue (Million), by Country 2024 & 2032
- Figure 15: North America Mobile Analytics Software Industry Revenue Share (%), by Country 2024 & 2032
- Figure 16: Europe Mobile Analytics Software Industry Revenue (Million), by Type 2024 & 2032
- Figure 17: Europe Mobile Analytics Software Industry Revenue Share (%), by Type 2024 & 2032
- Figure 18: Europe Mobile Analytics Software Industry Revenue (Million), by End-User Vertical 2024 & 2032
- Figure 19: Europe Mobile Analytics Software Industry Revenue Share (%), by End-User Vertical 2024 & 2032
- Figure 20: Europe Mobile Analytics Software Industry Revenue (Million), by Country 2024 & 2032
- Figure 21: Europe Mobile Analytics Software Industry Revenue Share (%), by Country 2024 & 2032
- Figure 22: Asia Pacific Mobile Analytics Software Industry Revenue (Million), by Type 2024 & 2032
- Figure 23: Asia Pacific Mobile Analytics Software Industry Revenue Share (%), by Type 2024 & 2032
- Figure 24: Asia Pacific Mobile Analytics Software Industry Revenue (Million), by End-User Vertical 2024 & 2032
- Figure 25: Asia Pacific Mobile Analytics Software Industry Revenue Share (%), by End-User Vertical 2024 & 2032
- Figure 26: Asia Pacific Mobile Analytics Software Industry Revenue (Million), by Country 2024 & 2032
- Figure 27: Asia Pacific Mobile Analytics Software Industry Revenue Share (%), by Country 2024 & 2032
- Figure 28: Rest of the World Mobile Analytics Software Industry Revenue (Million), by Type 2024 & 2032
- Figure 29: Rest of the World Mobile Analytics Software Industry Revenue Share (%), by Type 2024 & 2032
- Figure 30: Rest of the World Mobile Analytics Software Industry Revenue (Million), by End-User Vertical 2024 & 2032
- Figure 31: Rest of the World Mobile Analytics Software Industry Revenue Share (%), by End-User Vertical 2024 & 2032
- Figure 32: Rest of the World Mobile Analytics Software Industry Revenue (Million), by Country 2024 & 2032
- Figure 33: Rest of the World Mobile Analytics Software Industry Revenue Share (%), by Country 2024 & 2032
List of Tables
- Table 1: Global Mobile Analytics Software Industry Revenue Million Forecast, by Region 2019 & 2032
- Table 2: Global Mobile Analytics Software Industry Revenue Million Forecast, by Type 2019 & 2032
- Table 3: Global Mobile Analytics Software Industry Revenue Million Forecast, by End-User Vertical 2019 & 2032
- Table 4: Global Mobile Analytics Software Industry Revenue Million Forecast, by Region 2019 & 2032
- Table 5: Global Mobile Analytics Software Industry Revenue Million Forecast, by Country 2019 & 2032
- Table 6: Mobile Analytics Software Industry Revenue (Million) Forecast, by Application 2019 & 2032
- Table 7: Global Mobile Analytics Software Industry Revenue Million Forecast, by Country 2019 & 2032
- Table 8: Mobile Analytics Software Industry Revenue (Million) Forecast, by Application 2019 & 2032
- Table 9: Global Mobile Analytics Software Industry Revenue Million Forecast, by Country 2019 & 2032
- Table 10: Mobile Analytics Software Industry Revenue (Million) Forecast, by Application 2019 & 2032
- Table 11: Global Mobile Analytics Software Industry Revenue Million Forecast, by Country 2019 & 2032
- Table 12: Mobile Analytics Software Industry Revenue (Million) Forecast, by Application 2019 & 2032
- Table 13: Global Mobile Analytics Software Industry Revenue Million Forecast, by Type 2019 & 2032
- Table 14: Global Mobile Analytics Software Industry Revenue Million Forecast, by End-User Vertical 2019 & 2032
- Table 15: Global Mobile Analytics Software Industry Revenue Million Forecast, by Country 2019 & 2032
- Table 16: Global Mobile Analytics Software Industry Revenue Million Forecast, by Type 2019 & 2032
- Table 17: Global Mobile Analytics Software Industry Revenue Million Forecast, by End-User Vertical 2019 & 2032
- Table 18: Global Mobile Analytics Software Industry Revenue Million Forecast, by Country 2019 & 2032
- Table 19: Global Mobile Analytics Software Industry Revenue Million Forecast, by Type 2019 & 2032
- Table 20: Global Mobile Analytics Software Industry Revenue Million Forecast, by End-User Vertical 2019 & 2032
- Table 21: Global Mobile Analytics Software Industry Revenue Million Forecast, by Country 2019 & 2032
- Table 22: Global Mobile Analytics Software Industry Revenue Million Forecast, by Type 2019 & 2032
- Table 23: Global Mobile Analytics Software Industry Revenue Million Forecast, by End-User Vertical 2019 & 2032
- Table 24: Global Mobile Analytics Software Industry Revenue Million Forecast, by Country 2019 & 2032
Frequently Asked Questions
1. What is the projected Compound Annual Growth Rate (CAGR) of the Mobile Analytics Software Industry?
The projected CAGR is approximately 24.20%.
2. Which companies are prominent players in the Mobile Analytics Software Industry?
Key companies in the market include Contentsquare SaaS, OpenText Corporation, Google LLC, AppsFlyer Ltd*List Not Exhaustive, GoodData Corporation, Salesforce com Inc, Microsoft Corporation, Adobe Inc, Oracle Corp, Facebook Inc.
3. What are the main segments of the Mobile Analytics Software Industry?
The market segments include Type, End-User Vertical.
4. Can you provide details about the market size?
The market size is estimated to be USD 7.29 Million as of 2022.
5. What are some drivers contributing to market growth?
Smartphone Revolution to Generate Enormous Data; Data Explosion from E- commerce Likely to Propel the Market.
6. What are the notable trends driving market growth?
Retail Industry Holds Significant Market Share.
7. Are there any restraints impacting market growth?
Failure of the Widespread Adoption of 4G Services Due to Insufficient Users; Lack of Internet Penetration in Certain Areas.
8. Can you provide examples of recent developments in the market?
February 2022 - IronSource has announced a new app analytics tool to help app and game creators increase revenue, customer retention, and growth. IronSource is offering a one-stop solution for app monetization, user recruitment, and analytics with the beta edition of App Analytics. Analytics has grown in popularity, as have platforms and techniques for success in mobile apps and games. IronSource claims that the app analytics platform's usability (UX) is far superior to most other alternatives.
9. What pricing options are available for accessing the report?
Pricing options include single-user, multi-user, and enterprise licenses priced at USD 4750, USD 5250, and USD 8750 respectively.
10. Is the market size provided in terms of value or volume?
The market size is provided in terms of value, measured in Million.
11. Are there any specific market keywords associated with the report?
Yes, the market keyword associated with the report is "Mobile Analytics Software Industry," which aids in identifying and referencing the specific market segment covered.
12. How do I determine which pricing option suits my needs best?
The pricing options vary based on user requirements and access needs. Individual users may opt for single-user licenses, while businesses requiring broader access may choose multi-user or enterprise licenses for cost-effective access to the report.
13. Are there any additional resources or data provided in the Mobile Analytics Software Industry report?
While the report offers comprehensive insights, it's advisable to review the specific contents or supplementary materials provided to ascertain if additional resources or data are available.
14. How can I stay updated on further developments or reports in the Mobile Analytics Software Industry?
To stay informed about further developments, trends, and reports in the Mobile Analytics Software Industry, consider subscribing to industry newsletters, following relevant companies and organizations, or regularly checking reputable industry news sources and publications.
Methodology
Step 1 - Identification of Relevant Samples Size from Population Database


Step 2 - Approaches for Defining Global Market Size (Value, Volume* & Price*)

Note*: In applicable scenarios
Step 3 - Data Sources
Primary Research
- Web Analytics
- Survey Reports
- Research Institute
- Latest Research Reports
- Opinion Leaders
Secondary Research
- Annual Reports
- White Paper
- Latest Press Release
- Industry Association
- Paid Database
- Investor Presentations

Step 4 - Data Triangulation
Involves using different sources of information in order to increase the validity of a study
These sources are likely to be stakeholders in a program - participants, other researchers, program staff, other community members, and so on.
Then we put all data in single framework & apply various statistical tools to find out the dynamic on the market.
During the analysis stage, feedback from the stakeholder groups would be compared to determine areas of agreement as well as areas of divergence
