

Key Insights
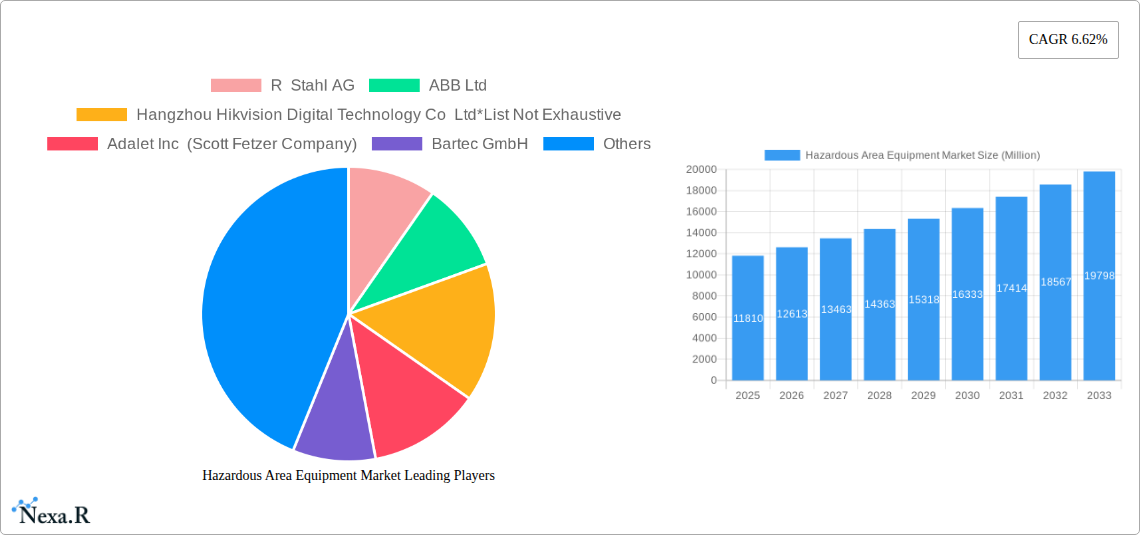
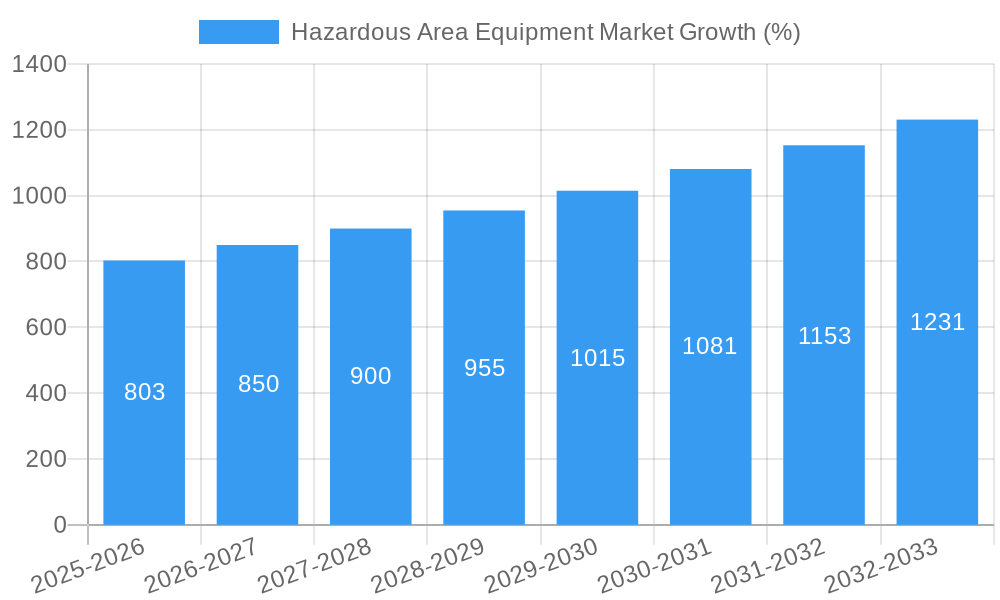
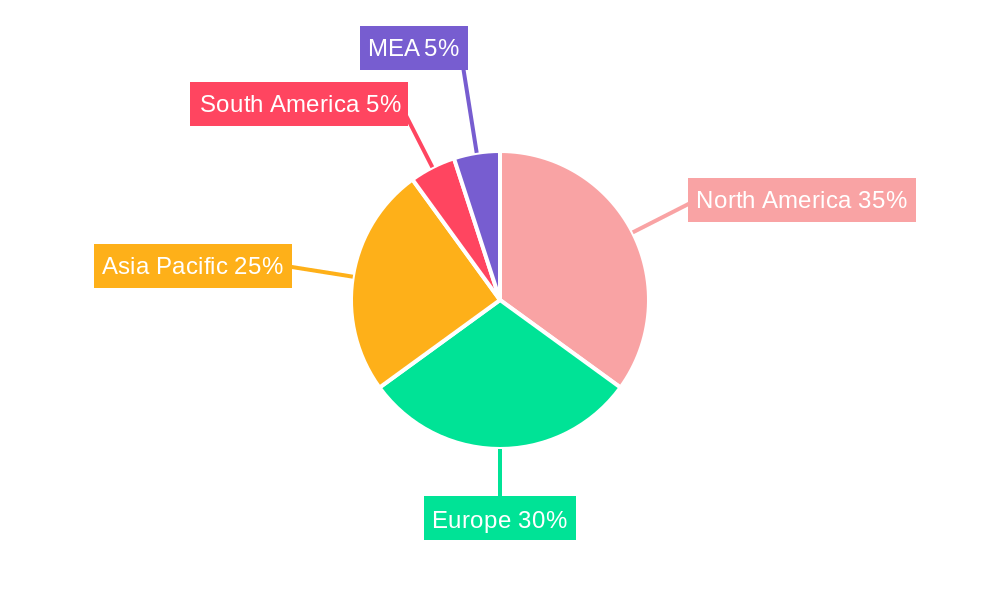
The Hazardous Area Equipment market, valued at $11.81 billion in 2025, is projected to experience robust growth, driven by increasing investments in oil & gas exploration, renewable energy infrastructure development, and stringent safety regulations in hazardous environments. The market's Compound Annual Growth Rate (CAGR) of 6.62% from 2025 to 2033 indicates a significant expansion, primarily fueled by the rising demand for intrinsically safe equipment across diverse end-user industries such as chemical processing, pharmaceuticals, and food & beverage manufacturing. Technological advancements, particularly in areas like automation and the Internet of Things (IoT), are further accelerating market growth by enhancing safety, efficiency, and remote monitoring capabilities within hazardous locations. Growth is geographically diversified, with North America and Europe currently holding substantial market share, while the Asia-Pacific region is anticipated to witness significant growth driven by rapid industrialization and infrastructure development. However, the market faces challenges, including high initial investment costs for equipment and the complexities associated with compliance and certification requirements across different geographical regions.
The segmentation analysis reveals that Power Supply Systems, Electric Motors, and Surveillance Systems are major components driving market growth within the equipment segment. Similarly, Oil and Gas, Energy and Power Generation, and Chemical industries are the key end-user sectors contributing substantially to market revenue. Leading companies like ABB Ltd, Siemens AG, and Eaton Corporation PLC are leveraging their strong technological capabilities and established market presence to capitalize on the growth opportunities, while smaller players are focusing on niche applications and regional expansions. The competitive landscape is marked by both collaboration and competition, with continuous innovations in product design, performance, and safety features shaping the overall market dynamics. Future market growth will be shaped by government policies promoting safety standards, technological advancements in explosion-proof equipment, and the increasing adoption of digitalization and smart technologies within hazardous environments.
Hazardous Area Equipment Market: A Comprehensive Report (2019-2033)
This comprehensive report provides an in-depth analysis of the Hazardous Area Equipment market, encompassing market dynamics, growth trends, regional dominance, product landscape, key players, and future outlook. The study period spans from 2019 to 2033, with 2025 serving as the base and estimated year. The report offers valuable insights for industry professionals, investors, and strategic decision-makers seeking to understand and capitalize on opportunities within this crucial sector. The market is segmented by equipment type (Power Supply Systems, Electric Motors, Surveillance Systems, Cable Glands and Connectors, Automation and Control Products, Enclosures, Lighting Products, Push Buttons and Signaling Devices) and end-user industry (Oil and Gas, Energy and Power Generation, Chemical, Food and Beverage, Pharmaceuticals, Other End-user Industries). The total market size is projected to reach xx Million units by 2033.
Hazardous Area Equipment Market Dynamics & Structure
The Hazardous Area Equipment market is characterized by a moderately concentrated landscape, with key players such as R Stahl AG, ABB Ltd, and Honeywell HBT holding significant market share. Technological innovation, particularly in areas like intrinsically safe systems and wireless communication, is a primary driver of growth. Stringent safety regulations and compliance requirements across various industries, including oil & gas and chemical processing, further shape market dynamics. The market also faces competitive pressure from substitute products offering similar functionalities but at potentially lower costs. The increasing demand for automation and digitization across industries is fueling market growth, while mergers and acquisitions (M&A) activities contribute to market consolidation and expansion.
- Market Concentration: Moderately concentrated, with top 5 players holding approximately xx% market share in 2024.
- Technological Innovation: Significant advancements in intrinsically safe technologies, wireless communication, and IoT integration are driving adoption.
- Regulatory Framework: Stringent safety standards (e.g., IEC 60079) and compliance requirements influence market growth and product development.
- Competitive Substitutes: The existence of substitute technologies creates competitive pressures and influences pricing strategies.
- End-User Demographics: Growth is driven by increasing demand from Oil & Gas, Energy & Power Generation, and Chemical sectors.
- M&A Trends: A moderate level of M&A activity is observed, contributing to market consolidation and expansion into new segments.
Hazardous Area Equipment Market Growth Trends & Insights
The Hazardous Area Equipment market has witnessed substantial growth over the historical period (2019-2024), exhibiting a CAGR of xx%. This growth is attributed to several factors, including rising investments in infrastructure projects, particularly in emerging economies, and increasing demand for automation and safety solutions across hazardous environments. Technological advancements, such as the adoption of IoT-enabled devices and advanced analytics, have further fueled market expansion. The market is expected to continue its growth trajectory during the forecast period (2025-2033), with a projected CAGR of xx%, driven by increasing industrial automation and stringent safety regulations. Consumer behavior shifts toward greater safety awareness and preference for advanced technologies are also contributing factors. Market penetration in developing regions remains relatively low, presenting significant opportunities for future expansion. Technological disruptions, such as the advent of next-generation sensors and communication protocols, are expected to reshape the competitive landscape and influence future growth.
Dominant Regions, Countries, or Segments in Hazardous Area Equipment Market
The North American and European regions currently dominate the Hazardous Area Equipment market, driven by strong industrial bases and stringent safety regulations. However, the Asia-Pacific region is poised for significant growth, propelled by substantial investments in infrastructure development and industrial expansion across countries like China and India. Within equipment segments, Power Supply Systems and Automation and Control Products represent the largest market shares, owing to their critical role in ensuring safe and efficient operation in hazardous environments. The Oil and Gas end-user industry remains a key driver of market demand, followed by the Energy and Power Generation sector.
- Key Regional Drivers:
- North America: Stringent safety regulations, mature industrial infrastructure.
- Europe: High adoption of advanced technologies, stringent environmental regulations.
- Asia-Pacific: Rapid industrialization, significant infrastructure investments.
- Dominant Segments:
- By Equipment: Power Supply Systems and Automation and Control Products hold the largest market share.
- By End-user Industry: Oil and Gas and Energy and Power Generation are the key driving sectors.
Hazardous Area Equipment Market Product Landscape
The Hazardous Area Equipment market features a diverse range of products designed to meet the specific requirements of various hazardous environments. Recent innovations include intrinsically safe wireless communication systems, advanced sensor technologies, and improved explosion-proof enclosures. These advancements enhance safety, reliability, and efficiency while minimizing environmental impact. Key selling propositions include enhanced safety features, improved operational efficiency, and reduced maintenance requirements. The focus on miniaturization, improved energy efficiency, and integration with smart technologies is shaping the future of product development.
Key Drivers, Barriers & Challenges in Hazardous Area Equipment Market
Key Drivers:
- Increasing demand for automation in hazardous industries.
- Stringent safety regulations and compliance requirements.
- Growing investments in infrastructure projects globally.
- Technological advancements in sensor technologies and communication systems.
Key Challenges and Restraints:
- High initial investment costs for adopting advanced technologies.
- Complex installation and maintenance procedures for specialized equipment.
- Supply chain disruptions impacting availability and pricing of components.
- Potential for regulatory changes affecting market dynamics.
Emerging Opportunities in Hazardous Area Equipment Market
Emerging opportunities lie in the adoption of IoT-enabled devices for remote monitoring and predictive maintenance, the expansion into untapped markets in developing economies, and the development of specialized equipment for niche applications (e.g., renewable energy). Growing interest in Industry 4.0 and the need for data-driven insights are driving demand for integrated solutions that improve safety and operational efficiency.
Growth Accelerators in the Hazardous Area Equipment Market Industry
Strategic partnerships and collaborations between equipment manufacturers and technology providers are accelerating market growth. Technological breakthroughs in intrinsically safe technologies, wireless communication, and sensor technology are creating new possibilities for improved safety and efficiency. Expanding into emerging markets, focusing on customized solutions for specific industry segments, and investing in research and development to stay ahead of the competition are other critical growth drivers.
Key Players Shaping the Hazardous Area Equipment Market Market
- R Stahl AG
- ABB Ltd
- Hangzhou Hikvision Digital Technology Co Ltd
- Adalet Inc (Scott Fetzer Company)
- Bartec GmbH
- Honeywell HBT
- Supermec Pte Ltd
- Marechal Electric Group
- Siemens AG
- Eaton Corporation PLC
- CZ Electric Co Ltd
- G M International Srl
- Spina Group SRL
- Phoenix Mecano
- Warom Technology Inc Co
- Rockwell Automation Inc
- Cordex Instruments Ltd
- Pepperl+Fuchs GmbH
- Alloy Industry Co Ltd
- Wago GmbH & Co KG
Notable Milestones in Hazardous Area Equipment Market Sector
- June 2023: Siemens AG announced a EUR 2 billion (USD 2.11 billion) investment in new manufacturing capacity, innovation labs, education centers, and other sites, including a new high-tech factory in Singapore.
- May 2023: R. Stahl AG expanded its product portfolio with the 8150/5-V88 series socket panels for applications requiring particle contamination avoidance, suitable for Zones 1, 2, 21, and 22.
In-Depth Hazardous Area Equipment Market Market Outlook
The Hazardous Area Equipment market is poised for continued growth driven by ongoing industrialization, technological advancements, and stringent safety regulations. Strategic investments in research and development, expansion into new markets, and strategic partnerships will shape future market dynamics. Companies focusing on innovative solutions, enhanced safety features, and improved operational efficiency are best positioned to capitalize on the growth potential in this critical sector.
Hazardous Area Equipment Market Segmentation
-
1. Equipment
- 1.1. Power Supply Systems
- 1.2. Electric Motors
- 1.3. Surveillance Systems
- 1.4. Cable Glands and Connectors
- 1.5. Automation and Control Products
- 1.6. Enclosures
- 1.7. Lighting Products
- 1.8. Push Buttons and Signaling Devices
-
2. End-user Industry
- 2.1. Oil and Gas
- 2.2. Energy and Power Generation
- 2.3. Chemical
- 2.4. Food and Beverage
- 2.5. Pharmaceuticals
- 2.6. Other End-user Industries
Hazardous Area Equipment Market Segmentation By Geography
-
1. North America
- 1.1. United States
- 1.2. Canada
-
2. Europe
- 2.1. United Kingdom
- 2.2. Germany
-
3. List of Manufacturers of Hazardous Equipment
- 3.1. France
- 3.2. Spain
- 3.3. Italy
- 3.4. Benelux
-
4. Asia
- 4.1. China
- 4.2. India
- 4.3. Japan
- 4.4. South Korea
- 4.5. Australia and New Zealand
-
5. Latin America
- 5.1. Mexico
- 5.2. Brazil
-
6. Middle East and Africa
- 6.1. United Arab Emirates
- 6.2. Saudi Arabia
- 6.3. South Africa
Hazardous Area Equipment Market REPORT HIGHLIGHTS
| Aspects | Details |
|---|---|
| Study Period | 2019-2033 |
| Base Year | 2024 |
| Estimated Year | 2025 |
| Forecast Period | 2025-2033 |
| Historical Period | 2019-2024 |
| Growth Rate | CAGR of 6.62% from 2019-2033 |
| Segmentation |
|
Table of Contents
- 1. Introduction
- 1.1. Research Scope
- 1.2. Market Segmentation
- 1.3. Research Methodology
- 1.4. Definitions and Assumptions
- 2. Executive Summary
- 2.1. Introduction
- 3. Market Dynamics
- 3.1. Introduction
- 3.2. Market Drivers
- 3.2.1 Stricter Regulations for Handling Hazardous Areas and Substances; Increasing Energy Requirements
- 3.2.2 Driving the Demand for Exploration of New Mines
- 3.3. Market Restrains
- 3.3.1. High Investments and High Installation Cost of the Equipment
- 3.4. Market Trends
- 3.4.1. Oil and Gas End-user Industry Segment is Expected to Hold Significant Market Share
- 4. Market Factor Analysis
- 4.1. Porters Five Forces
- 4.2. Supply/Value Chain
- 4.3. PESTEL analysis
- 4.4. Market Entropy
- 4.5. Patent/Trademark Analysis
- 5. Global Hazardous Area Equipment Market Analysis, Insights and Forecast, 2019-2031
- 5.1. Market Analysis, Insights and Forecast - by Equipment
- 5.1.1. Power Supply Systems
- 5.1.2. Electric Motors
- 5.1.3. Surveillance Systems
- 5.1.4. Cable Glands and Connectors
- 5.1.5. Automation and Control Products
- 5.1.6. Enclosures
- 5.1.7. Lighting Products
- 5.1.8. Push Buttons and Signaling Devices
- 5.2. Market Analysis, Insights and Forecast - by End-user Industry
- 5.2.1. Oil and Gas
- 5.2.2. Energy and Power Generation
- 5.2.3. Chemical
- 5.2.4. Food and Beverage
- 5.2.5. Pharmaceuticals
- 5.2.6. Other End-user Industries
- 5.3. Market Analysis, Insights and Forecast - by Region
- 5.3.1. North America
- 5.3.2. Europe
- 5.3.3. List of Manufacturers of Hazardous Equipment
- 5.3.4. Asia
- 5.3.5. Latin America
- 5.3.6. Middle East and Africa
- 5.1. Market Analysis, Insights and Forecast - by Equipment
- 6. North America Hazardous Area Equipment Market Analysis, Insights and Forecast, 2019-2031
- 6.1. Market Analysis, Insights and Forecast - by Equipment
- 6.1.1. Power Supply Systems
- 6.1.2. Electric Motors
- 6.1.3. Surveillance Systems
- 6.1.4. Cable Glands and Connectors
- 6.1.5. Automation and Control Products
- 6.1.6. Enclosures
- 6.1.7. Lighting Products
- 6.1.8. Push Buttons and Signaling Devices
- 6.2. Market Analysis, Insights and Forecast - by End-user Industry
- 6.2.1. Oil and Gas
- 6.2.2. Energy and Power Generation
- 6.2.3. Chemical
- 6.2.4. Food and Beverage
- 6.2.5. Pharmaceuticals
- 6.2.6. Other End-user Industries
- 6.1. Market Analysis, Insights and Forecast - by Equipment
- 7. Europe Hazardous Area Equipment Market Analysis, Insights and Forecast, 2019-2031
- 7.1. Market Analysis, Insights and Forecast - by Equipment
- 7.1.1. Power Supply Systems
- 7.1.2. Electric Motors
- 7.1.3. Surveillance Systems
- 7.1.4. Cable Glands and Connectors
- 7.1.5. Automation and Control Products
- 7.1.6. Enclosures
- 7.1.7. Lighting Products
- 7.1.8. Push Buttons and Signaling Devices
- 7.2. Market Analysis, Insights and Forecast - by End-user Industry
- 7.2.1. Oil and Gas
- 7.2.2. Energy and Power Generation
- 7.2.3. Chemical
- 7.2.4. Food and Beverage
- 7.2.5. Pharmaceuticals
- 7.2.6. Other End-user Industries
- 7.1. Market Analysis, Insights and Forecast - by Equipment
- 8. List of Manufacturers of Hazardous Equipment Hazardous Area Equipment Market Analysis, Insights and Forecast, 2019-2031
- 8.1. Market Analysis, Insights and Forecast - by Equipment
- 8.1.1. Power Supply Systems
- 8.1.2. Electric Motors
- 8.1.3. Surveillance Systems
- 8.1.4. Cable Glands and Connectors
- 8.1.5. Automation and Control Products
- 8.1.6. Enclosures
- 8.1.7. Lighting Products
- 8.1.8. Push Buttons and Signaling Devices
- 8.2. Market Analysis, Insights and Forecast - by End-user Industry
- 8.2.1. Oil and Gas
- 8.2.2. Energy and Power Generation
- 8.2.3. Chemical
- 8.2.4. Food and Beverage
- 8.2.5. Pharmaceuticals
- 8.2.6. Other End-user Industries
- 8.1. Market Analysis, Insights and Forecast - by Equipment
- 9. Asia Hazardous Area Equipment Market Analysis, Insights and Forecast, 2019-2031
- 9.1. Market Analysis, Insights and Forecast - by Equipment
- 9.1.1. Power Supply Systems
- 9.1.2. Electric Motors
- 9.1.3. Surveillance Systems
- 9.1.4. Cable Glands and Connectors
- 9.1.5. Automation and Control Products
- 9.1.6. Enclosures
- 9.1.7. Lighting Products
- 9.1.8. Push Buttons and Signaling Devices
- 9.2. Market Analysis, Insights and Forecast - by End-user Industry
- 9.2.1. Oil and Gas
- 9.2.2. Energy and Power Generation
- 9.2.3. Chemical
- 9.2.4. Food and Beverage
- 9.2.5. Pharmaceuticals
- 9.2.6. Other End-user Industries
- 9.1. Market Analysis, Insights and Forecast - by Equipment
- 10. Latin America Hazardous Area Equipment Market Analysis, Insights and Forecast, 2019-2031
- 10.1. Market Analysis, Insights and Forecast - by Equipment
- 10.1.1. Power Supply Systems
- 10.1.2. Electric Motors
- 10.1.3. Surveillance Systems
- 10.1.4. Cable Glands and Connectors
- 10.1.5. Automation and Control Products
- 10.1.6. Enclosures
- 10.1.7. Lighting Products
- 10.1.8. Push Buttons and Signaling Devices
- 10.2. Market Analysis, Insights and Forecast - by End-user Industry
- 10.2.1. Oil and Gas
- 10.2.2. Energy and Power Generation
- 10.2.3. Chemical
- 10.2.4. Food and Beverage
- 10.2.5. Pharmaceuticals
- 10.2.6. Other End-user Industries
- 10.1. Market Analysis, Insights and Forecast - by Equipment
- 11. Middle East and Africa Hazardous Area Equipment Market Analysis, Insights and Forecast, 2019-2031
- 11.1. Market Analysis, Insights and Forecast - by Equipment
- 11.1.1. Power Supply Systems
- 11.1.2. Electric Motors
- 11.1.3. Surveillance Systems
- 11.1.4. Cable Glands and Connectors
- 11.1.5. Automation and Control Products
- 11.1.6. Enclosures
- 11.1.7. Lighting Products
- 11.1.8. Push Buttons and Signaling Devices
- 11.2. Market Analysis, Insights and Forecast - by End-user Industry
- 11.2.1. Oil and Gas
- 11.2.2. Energy and Power Generation
- 11.2.3. Chemical
- 11.2.4. Food and Beverage
- 11.2.5. Pharmaceuticals
- 11.2.6. Other End-user Industries
- 11.1. Market Analysis, Insights and Forecast - by Equipment
- 12. North America Hazardous Area Equipment Market Analysis, Insights and Forecast, 2019-2031
- 12.1. Market Analysis, Insights and Forecast - By Country/Sub-region
- 12.1.1 United States
- 12.1.2 Canada
- 12.1.3 Mexico
- 13. Europe Hazardous Area Equipment Market Analysis, Insights and Forecast, 2019-2031
- 13.1. Market Analysis, Insights and Forecast - By Country/Sub-region
- 13.1.1 Germany
- 13.1.2 United Kingdom
- 13.1.3 France
- 13.1.4 Spain
- 13.1.5 Italy
- 13.1.6 Spain
- 13.1.7 Belgium
- 13.1.8 Netherland
- 13.1.9 Nordics
- 13.1.10 Rest of Europe
- 14. Asia Pacific Hazardous Area Equipment Market Analysis, Insights and Forecast, 2019-2031
- 14.1. Market Analysis, Insights and Forecast - By Country/Sub-region
- 14.1.1 China
- 14.1.2 Japan
- 14.1.3 India
- 14.1.4 South Korea
- 14.1.5 Southeast Asia
- 14.1.6 Australia
- 14.1.7 Indonesia
- 14.1.8 Phillipes
- 14.1.9 Singapore
- 14.1.10 Thailandc
- 14.1.11 Rest of Asia Pacific
- 15. South America Hazardous Area Equipment Market Analysis, Insights and Forecast, 2019-2031
- 15.1. Market Analysis, Insights and Forecast - By Country/Sub-region
- 15.1.1 Brazil
- 15.1.2 Argentina
- 15.1.3 Peru
- 15.1.4 Chile
- 15.1.5 Colombia
- 15.1.6 Ecuador
- 15.1.7 Venezuela
- 15.1.8 Rest of South America
- 16. North America Hazardous Area Equipment Market Analysis, Insights and Forecast, 2019-2031
- 16.1. Market Analysis, Insights and Forecast - By Country/Sub-region
- 16.1.1 United States
- 16.1.2 Canada
- 16.1.3 Mexico
- 17. MEA Hazardous Area Equipment Market Analysis, Insights and Forecast, 2019-2031
- 17.1. Market Analysis, Insights and Forecast - By Country/Sub-region
- 17.1.1 United Arab Emirates
- 17.1.2 Saudi Arabia
- 17.1.3 South Africa
- 17.1.4 Rest of Middle East and Africa
- 18. Competitive Analysis
- 18.1. Global Market Share Analysis 2024
- 18.2. Company Profiles
- 18.2.1 R Stahl AG
- 18.2.1.1. Overview
- 18.2.1.2. Products
- 18.2.1.3. SWOT Analysis
- 18.2.1.4. Recent Developments
- 18.2.1.5. Financials (Based on Availability)
- 18.2.2 ABB Ltd
- 18.2.2.1. Overview
- 18.2.2.2. Products
- 18.2.2.3. SWOT Analysis
- 18.2.2.4. Recent Developments
- 18.2.2.5. Financials (Based on Availability)
- 18.2.3 Hangzhou Hikvision Digital Technology Co Ltd*List Not Exhaustive
- 18.2.3.1. Overview
- 18.2.3.2. Products
- 18.2.3.3. SWOT Analysis
- 18.2.3.4. Recent Developments
- 18.2.3.5. Financials (Based on Availability)
- 18.2.4 Adalet Inc (Scott Fetzer Company)
- 18.2.4.1. Overview
- 18.2.4.2. Products
- 18.2.4.3. SWOT Analysis
- 18.2.4.4. Recent Developments
- 18.2.4.5. Financials (Based on Availability)
- 18.2.5 Bartec GmbH
- 18.2.5.1. Overview
- 18.2.5.2. Products
- 18.2.5.3. SWOT Analysis
- 18.2.5.4. Recent Developments
- 18.2.5.5. Financials (Based on Availability)
- 18.2.6 Honeywell HBT
- 18.2.6.1. Overview
- 18.2.6.2. Products
- 18.2.6.3. SWOT Analysis
- 18.2.6.4. Recent Developments
- 18.2.6.5. Financials (Based on Availability)
- 18.2.7 Supermec Pte Ltd
- 18.2.7.1. Overview
- 18.2.7.2. Products
- 18.2.7.3. SWOT Analysis
- 18.2.7.4. Recent Developments
- 18.2.7.5. Financials (Based on Availability)
- 18.2.8 Marechal Electric Group
- 18.2.8.1. Overview
- 18.2.8.2. Products
- 18.2.8.3. SWOT Analysis
- 18.2.8.4. Recent Developments
- 18.2.8.5. Financials (Based on Availability)
- 18.2.9 Siemens AG
- 18.2.9.1. Overview
- 18.2.9.2. Products
- 18.2.9.3. SWOT Analysis
- 18.2.9.4. Recent Developments
- 18.2.9.5. Financials (Based on Availability)
- 18.2.10 Eaton Corporation PLC
- 18.2.10.1. Overview
- 18.2.10.2. Products
- 18.2.10.3. SWOT Analysis
- 18.2.10.4. Recent Developments
- 18.2.10.5. Financials (Based on Availability)
- 18.2.11 CZ Electric Co Ltd
- 18.2.11.1. Overview
- 18.2.11.2. Products
- 18.2.11.3. SWOT Analysis
- 18.2.11.4. Recent Developments
- 18.2.11.5. Financials (Based on Availability)
- 18.2.12 G M International Srl
- 18.2.12.1. Overview
- 18.2.12.2. Products
- 18.2.12.3. SWOT Analysis
- 18.2.12.4. Recent Developments
- 18.2.12.5. Financials (Based on Availability)
- 18.2.13 Spina Group SRL
- 18.2.13.1. Overview
- 18.2.13.2. Products
- 18.2.13.3. SWOT Analysis
- 18.2.13.4. Recent Developments
- 18.2.13.5. Financials (Based on Availability)
- 18.2.14 Phoenix Mecano
- 18.2.14.1. Overview
- 18.2.14.2. Products
- 18.2.14.3. SWOT Analysis
- 18.2.14.4. Recent Developments
- 18.2.14.5. Financials (Based on Availability)
- 18.2.15 Warom Technology Inc Co
- 18.2.15.1. Overview
- 18.2.15.2. Products
- 18.2.15.3. SWOT Analysis
- 18.2.15.4. Recent Developments
- 18.2.15.5. Financials (Based on Availability)
- 18.2.16 Rockwell Automation Inc
- 18.2.16.1. Overview
- 18.2.16.2. Products
- 18.2.16.3. SWOT Analysis
- 18.2.16.4. Recent Developments
- 18.2.16.5. Financials (Based on Availability)
- 18.2.17 Cordex Instruments Ltd
- 18.2.17.1. Overview
- 18.2.17.2. Products
- 18.2.17.3. SWOT Analysis
- 18.2.17.4. Recent Developments
- 18.2.17.5. Financials (Based on Availability)
- 18.2.18 Pepperl+Fuchs GmbH
- 18.2.18.1. Overview
- 18.2.18.2. Products
- 18.2.18.3. SWOT Analysis
- 18.2.18.4. Recent Developments
- 18.2.18.5. Financials (Based on Availability)
- 18.2.19 Alloy Industry Co Ltd
- 18.2.19.1. Overview
- 18.2.19.2. Products
- 18.2.19.3. SWOT Analysis
- 18.2.19.4. Recent Developments
- 18.2.19.5. Financials (Based on Availability)
- 18.2.20 Wago GmbH & Co KG
- 18.2.20.1. Overview
- 18.2.20.2. Products
- 18.2.20.3. SWOT Analysis
- 18.2.20.4. Recent Developments
- 18.2.20.5. Financials (Based on Availability)
- 18.2.1 R Stahl AG
List of Figures
- Figure 1: Global Hazardous Area Equipment Market Revenue Breakdown (Million, %) by Region 2024 & 2032
- Figure 2: North America Hazardous Area Equipment Market Revenue (Million), by Country 2024 & 2032
- Figure 3: North America Hazardous Area Equipment Market Revenue Share (%), by Country 2024 & 2032
- Figure 4: Europe Hazardous Area Equipment Market Revenue (Million), by Country 2024 & 2032
- Figure 5: Europe Hazardous Area Equipment Market Revenue Share (%), by Country 2024 & 2032
- Figure 6: Asia Pacific Hazardous Area Equipment Market Revenue (Million), by Country 2024 & 2032
- Figure 7: Asia Pacific Hazardous Area Equipment Market Revenue Share (%), by Country 2024 & 2032
- Figure 8: South America Hazardous Area Equipment Market Revenue (Million), by Country 2024 & 2032
- Figure 9: South America Hazardous Area Equipment Market Revenue Share (%), by Country 2024 & 2032
- Figure 10: North America Hazardous Area Equipment Market Revenue (Million), by Country 2024 & 2032
- Figure 11: North America Hazardous Area Equipment Market Revenue Share (%), by Country 2024 & 2032
- Figure 12: MEA Hazardous Area Equipment Market Revenue (Million), by Country 2024 & 2032
- Figure 13: MEA Hazardous Area Equipment Market Revenue Share (%), by Country 2024 & 2032
- Figure 14: North America Hazardous Area Equipment Market Revenue (Million), by Equipment 2024 & 2032
- Figure 15: North America Hazardous Area Equipment Market Revenue Share (%), by Equipment 2024 & 2032
- Figure 16: North America Hazardous Area Equipment Market Revenue (Million), by End-user Industry 2024 & 2032
- Figure 17: North America Hazardous Area Equipment Market Revenue Share (%), by End-user Industry 2024 & 2032
- Figure 18: North America Hazardous Area Equipment Market Revenue (Million), by Country 2024 & 2032
- Figure 19: North America Hazardous Area Equipment Market Revenue Share (%), by Country 2024 & 2032
- Figure 20: Europe Hazardous Area Equipment Market Revenue (Million), by Equipment 2024 & 2032
- Figure 21: Europe Hazardous Area Equipment Market Revenue Share (%), by Equipment 2024 & 2032
- Figure 22: Europe Hazardous Area Equipment Market Revenue (Million), by End-user Industry 2024 & 2032
- Figure 23: Europe Hazardous Area Equipment Market Revenue Share (%), by End-user Industry 2024 & 2032
- Figure 24: Europe Hazardous Area Equipment Market Revenue (Million), by Country 2024 & 2032
- Figure 25: Europe Hazardous Area Equipment Market Revenue Share (%), by Country 2024 & 2032
- Figure 26: List of Manufacturers of Hazardous Equipment Hazardous Area Equipment Market Revenue (Million), by Equipment 2024 & 2032
- Figure 27: List of Manufacturers of Hazardous Equipment Hazardous Area Equipment Market Revenue Share (%), by Equipment 2024 & 2032
- Figure 28: List of Manufacturers of Hazardous Equipment Hazardous Area Equipment Market Revenue (Million), by End-user Industry 2024 & 2032
- Figure 29: List of Manufacturers of Hazardous Equipment Hazardous Area Equipment Market Revenue Share (%), by End-user Industry 2024 & 2032
- Figure 30: List of Manufacturers of Hazardous Equipment Hazardous Area Equipment Market Revenue (Million), by Country 2024 & 2032
- Figure 31: List of Manufacturers of Hazardous Equipment Hazardous Area Equipment Market Revenue Share (%), by Country 2024 & 2032
- Figure 32: Asia Hazardous Area Equipment Market Revenue (Million), by Equipment 2024 & 2032
- Figure 33: Asia Hazardous Area Equipment Market Revenue Share (%), by Equipment 2024 & 2032
- Figure 34: Asia Hazardous Area Equipment Market Revenue (Million), by End-user Industry 2024 & 2032
- Figure 35: Asia Hazardous Area Equipment Market Revenue Share (%), by End-user Industry 2024 & 2032
- Figure 36: Asia Hazardous Area Equipment Market Revenue (Million), by Country 2024 & 2032
- Figure 37: Asia Hazardous Area Equipment Market Revenue Share (%), by Country 2024 & 2032
- Figure 38: Latin America Hazardous Area Equipment Market Revenue (Million), by Equipment 2024 & 2032
- Figure 39: Latin America Hazardous Area Equipment Market Revenue Share (%), by Equipment 2024 & 2032
- Figure 40: Latin America Hazardous Area Equipment Market Revenue (Million), by End-user Industry 2024 & 2032
- Figure 41: Latin America Hazardous Area Equipment Market Revenue Share (%), by End-user Industry 2024 & 2032
- Figure 42: Latin America Hazardous Area Equipment Market Revenue (Million), by Country 2024 & 2032
- Figure 43: Latin America Hazardous Area Equipment Market Revenue Share (%), by Country 2024 & 2032
- Figure 44: Middle East and Africa Hazardous Area Equipment Market Revenue (Million), by Equipment 2024 & 2032
- Figure 45: Middle East and Africa Hazardous Area Equipment Market Revenue Share (%), by Equipment 2024 & 2032
- Figure 46: Middle East and Africa Hazardous Area Equipment Market Revenue (Million), by End-user Industry 2024 & 2032
- Figure 47: Middle East and Africa Hazardous Area Equipment Market Revenue Share (%), by End-user Industry 2024 & 2032
- Figure 48: Middle East and Africa Hazardous Area Equipment Market Revenue (Million), by Country 2024 & 2032
- Figure 49: Middle East and Africa Hazardous Area Equipment Market Revenue Share (%), by Country 2024 & 2032
List of Tables
- Table 1: Global Hazardous Area Equipment Market Revenue Million Forecast, by Region 2019 & 2032
- Table 2: Global Hazardous Area Equipment Market Revenue Million Forecast, by Equipment 2019 & 2032
- Table 3: Global Hazardous Area Equipment Market Revenue Million Forecast, by End-user Industry 2019 & 2032
- Table 4: Global Hazardous Area Equipment Market Revenue Million Forecast, by Region 2019 & 2032
- Table 5: Global Hazardous Area Equipment Market Revenue Million Forecast, by Country 2019 & 2032
- Table 6: United States Hazardous Area Equipment Market Revenue (Million) Forecast, by Application 2019 & 2032
- Table 7: Canada Hazardous Area Equipment Market Revenue (Million) Forecast, by Application 2019 & 2032
- Table 8: Mexico Hazardous Area Equipment Market Revenue (Million) Forecast, by Application 2019 & 2032
- Table 9: Global Hazardous Area Equipment Market Revenue Million Forecast, by Country 2019 & 2032
- Table 10: Germany Hazardous Area Equipment Market Revenue (Million) Forecast, by Application 2019 & 2032
- Table 11: United Kingdom Hazardous Area Equipment Market Revenue (Million) Forecast, by Application 2019 & 2032
- Table 12: France Hazardous Area Equipment Market Revenue (Million) Forecast, by Application 2019 & 2032
- Table 13: Spain Hazardous Area Equipment Market Revenue (Million) Forecast, by Application 2019 & 2032
- Table 14: Italy Hazardous Area Equipment Market Revenue (Million) Forecast, by Application 2019 & 2032
- Table 15: Spain Hazardous Area Equipment Market Revenue (Million) Forecast, by Application 2019 & 2032
- Table 16: Belgium Hazardous Area Equipment Market Revenue (Million) Forecast, by Application 2019 & 2032
- Table 17: Netherland Hazardous Area Equipment Market Revenue (Million) Forecast, by Application 2019 & 2032
- Table 18: Nordics Hazardous Area Equipment Market Revenue (Million) Forecast, by Application 2019 & 2032
- Table 19: Rest of Europe Hazardous Area Equipment Market Revenue (Million) Forecast, by Application 2019 & 2032
- Table 20: Global Hazardous Area Equipment Market Revenue Million Forecast, by Country 2019 & 2032
- Table 21: China Hazardous Area Equipment Market Revenue (Million) Forecast, by Application 2019 & 2032
- Table 22: Japan Hazardous Area Equipment Market Revenue (Million) Forecast, by Application 2019 & 2032
- Table 23: India Hazardous Area Equipment Market Revenue (Million) Forecast, by Application 2019 & 2032
- Table 24: South Korea Hazardous Area Equipment Market Revenue (Million) Forecast, by Application 2019 & 2032
- Table 25: Southeast Asia Hazardous Area Equipment Market Revenue (Million) Forecast, by Application 2019 & 2032
- Table 26: Australia Hazardous Area Equipment Market Revenue (Million) Forecast, by Application 2019 & 2032
- Table 27: Indonesia Hazardous Area Equipment Market Revenue (Million) Forecast, by Application 2019 & 2032
- Table 28: Phillipes Hazardous Area Equipment Market Revenue (Million) Forecast, by Application 2019 & 2032
- Table 29: Singapore Hazardous Area Equipment Market Revenue (Million) Forecast, by Application 2019 & 2032
- Table 30: Thailandc Hazardous Area Equipment Market Revenue (Million) Forecast, by Application 2019 & 2032
- Table 31: Rest of Asia Pacific Hazardous Area Equipment Market Revenue (Million) Forecast, by Application 2019 & 2032
- Table 32: Global Hazardous Area Equipment Market Revenue Million Forecast, by Country 2019 & 2032
- Table 33: Brazil Hazardous Area Equipment Market Revenue (Million) Forecast, by Application 2019 & 2032
- Table 34: Argentina Hazardous Area Equipment Market Revenue (Million) Forecast, by Application 2019 & 2032
- Table 35: Peru Hazardous Area Equipment Market Revenue (Million) Forecast, by Application 2019 & 2032
- Table 36: Chile Hazardous Area Equipment Market Revenue (Million) Forecast, by Application 2019 & 2032
- Table 37: Colombia Hazardous Area Equipment Market Revenue (Million) Forecast, by Application 2019 & 2032
- Table 38: Ecuador Hazardous Area Equipment Market Revenue (Million) Forecast, by Application 2019 & 2032
- Table 39: Venezuela Hazardous Area Equipment Market Revenue (Million) Forecast, by Application 2019 & 2032
- Table 40: Rest of South America Hazardous Area Equipment Market Revenue (Million) Forecast, by Application 2019 & 2032
- Table 41: Global Hazardous Area Equipment Market Revenue Million Forecast, by Country 2019 & 2032
- Table 42: United States Hazardous Area Equipment Market Revenue (Million) Forecast, by Application 2019 & 2032
- Table 43: Canada Hazardous Area Equipment Market Revenue (Million) Forecast, by Application 2019 & 2032
- Table 44: Mexico Hazardous Area Equipment Market Revenue (Million) Forecast, by Application 2019 & 2032
- Table 45: Global Hazardous Area Equipment Market Revenue Million Forecast, by Country 2019 & 2032
- Table 46: United Arab Emirates Hazardous Area Equipment Market Revenue (Million) Forecast, by Application 2019 & 2032
- Table 47: Saudi Arabia Hazardous Area Equipment Market Revenue (Million) Forecast, by Application 2019 & 2032
- Table 48: South Africa Hazardous Area Equipment Market Revenue (Million) Forecast, by Application 2019 & 2032
- Table 49: Rest of Middle East and Africa Hazardous Area Equipment Market Revenue (Million) Forecast, by Application 2019 & 2032
- Table 50: Global Hazardous Area Equipment Market Revenue Million Forecast, by Equipment 2019 & 2032
- Table 51: Global Hazardous Area Equipment Market Revenue Million Forecast, by End-user Industry 2019 & 2032
- Table 52: Global Hazardous Area Equipment Market Revenue Million Forecast, by Country 2019 & 2032
- Table 53: United States Hazardous Area Equipment Market Revenue (Million) Forecast, by Application 2019 & 2032
- Table 54: Canada Hazardous Area Equipment Market Revenue (Million) Forecast, by Application 2019 & 2032
- Table 55: Global Hazardous Area Equipment Market Revenue Million Forecast, by Equipment 2019 & 2032
- Table 56: Global Hazardous Area Equipment Market Revenue Million Forecast, by End-user Industry 2019 & 2032
- Table 57: Global Hazardous Area Equipment Market Revenue Million Forecast, by Country 2019 & 2032
- Table 58: United Kingdom Hazardous Area Equipment Market Revenue (Million) Forecast, by Application 2019 & 2032
- Table 59: Germany Hazardous Area Equipment Market Revenue (Million) Forecast, by Application 2019 & 2032
- Table 60: Global Hazardous Area Equipment Market Revenue Million Forecast, by Equipment 2019 & 2032
- Table 61: Global Hazardous Area Equipment Market Revenue Million Forecast, by End-user Industry 2019 & 2032
- Table 62: Global Hazardous Area Equipment Market Revenue Million Forecast, by Country 2019 & 2032
- Table 63: France Hazardous Area Equipment Market Revenue (Million) Forecast, by Application 2019 & 2032
- Table 64: Spain Hazardous Area Equipment Market Revenue (Million) Forecast, by Application 2019 & 2032
- Table 65: Italy Hazardous Area Equipment Market Revenue (Million) Forecast, by Application 2019 & 2032
- Table 66: Benelux Hazardous Area Equipment Market Revenue (Million) Forecast, by Application 2019 & 2032
- Table 67: Global Hazardous Area Equipment Market Revenue Million Forecast, by Equipment 2019 & 2032
- Table 68: Global Hazardous Area Equipment Market Revenue Million Forecast, by End-user Industry 2019 & 2032
- Table 69: Global Hazardous Area Equipment Market Revenue Million Forecast, by Country 2019 & 2032
- Table 70: China Hazardous Area Equipment Market Revenue (Million) Forecast, by Application 2019 & 2032
- Table 71: India Hazardous Area Equipment Market Revenue (Million) Forecast, by Application 2019 & 2032
- Table 72: Japan Hazardous Area Equipment Market Revenue (Million) Forecast, by Application 2019 & 2032
- Table 73: South Korea Hazardous Area Equipment Market Revenue (Million) Forecast, by Application 2019 & 2032
- Table 74: Australia and New Zealand Hazardous Area Equipment Market Revenue (Million) Forecast, by Application 2019 & 2032
- Table 75: Global Hazardous Area Equipment Market Revenue Million Forecast, by Equipment 2019 & 2032
- Table 76: Global Hazardous Area Equipment Market Revenue Million Forecast, by End-user Industry 2019 & 2032
- Table 77: Global Hazardous Area Equipment Market Revenue Million Forecast, by Country 2019 & 2032
- Table 78: Mexico Hazardous Area Equipment Market Revenue (Million) Forecast, by Application 2019 & 2032
- Table 79: Brazil Hazardous Area Equipment Market Revenue (Million) Forecast, by Application 2019 & 2032
- Table 80: Global Hazardous Area Equipment Market Revenue Million Forecast, by Equipment 2019 & 2032
- Table 81: Global Hazardous Area Equipment Market Revenue Million Forecast, by End-user Industry 2019 & 2032
- Table 82: Global Hazardous Area Equipment Market Revenue Million Forecast, by Country 2019 & 2032
- Table 83: United Arab Emirates Hazardous Area Equipment Market Revenue (Million) Forecast, by Application 2019 & 2032
- Table 84: Saudi Arabia Hazardous Area Equipment Market Revenue (Million) Forecast, by Application 2019 & 2032
- Table 85: South Africa Hazardous Area Equipment Market Revenue (Million) Forecast, by Application 2019 & 2032
Frequently Asked Questions
1. What is the projected Compound Annual Growth Rate (CAGR) of the Hazardous Area Equipment Market?
The projected CAGR is approximately 6.62%.
2. Which companies are prominent players in the Hazardous Area Equipment Market?
Key companies in the market include R Stahl AG, ABB Ltd, Hangzhou Hikvision Digital Technology Co Ltd*List Not Exhaustive, Adalet Inc (Scott Fetzer Company), Bartec GmbH, Honeywell HBT, Supermec Pte Ltd, Marechal Electric Group, Siemens AG, Eaton Corporation PLC, CZ Electric Co Ltd, G M International Srl, Spina Group SRL, Phoenix Mecano, Warom Technology Inc Co, Rockwell Automation Inc, Cordex Instruments Ltd, Pepperl+Fuchs GmbH, Alloy Industry Co Ltd, Wago GmbH & Co KG.
3. What are the main segments of the Hazardous Area Equipment Market?
The market segments include Equipment, End-user Industry.
4. Can you provide details about the market size?
The market size is estimated to be USD 11.81 Million as of 2022.
5. What are some drivers contributing to market growth?
Stricter Regulations for Handling Hazardous Areas and Substances; Increasing Energy Requirements. Driving the Demand for Exploration of New Mines.
6. What are the notable trends driving market growth?
Oil and Gas End-user Industry Segment is Expected to Hold Significant Market Share.
7. Are there any restraints impacting market growth?
High Investments and High Installation Cost of the Equipment.
8. Can you provide examples of recent developments in the market?
June 2023 - Siemens AG announced an investment of EUR 2 billion (USD 2.11 billion) for new manufacturing capacity and innovation labs, education centers, and other sites. Siemens also announced the construction of a new high-tech factory in Singapore to meet the growing demand from Southeast Asia markets. The company is further expected to announce additional investments in the US and Europe.
9. What pricing options are available for accessing the report?
Pricing options include single-user, multi-user, and enterprise licenses priced at USD 4750, USD 5250, and USD 8750 respectively.
10. Is the market size provided in terms of value or volume?
The market size is provided in terms of value, measured in Million.
11. Are there any specific market keywords associated with the report?
Yes, the market keyword associated with the report is "Hazardous Area Equipment Market," which aids in identifying and referencing the specific market segment covered.
12. How do I determine which pricing option suits my needs best?
The pricing options vary based on user requirements and access needs. Individual users may opt for single-user licenses, while businesses requiring broader access may choose multi-user or enterprise licenses for cost-effective access to the report.
13. Are there any additional resources or data provided in the Hazardous Area Equipment Market report?
While the report offers comprehensive insights, it's advisable to review the specific contents or supplementary materials provided to ascertain if additional resources or data are available.
14. How can I stay updated on further developments or reports in the Hazardous Area Equipment Market?
To stay informed about further developments, trends, and reports in the Hazardous Area Equipment Market, consider subscribing to industry newsletters, following relevant companies and organizations, or regularly checking reputable industry news sources and publications.
Methodology
Step 1 - Identification of Relevant Samples Size from Population Database


Step 2 - Approaches for Defining Global Market Size (Value, Volume* & Price*)

Note*: In applicable scenarios
Step 3 - Data Sources
Primary Research
- Web Analytics
- Survey Reports
- Research Institute
- Latest Research Reports
- Opinion Leaders
Secondary Research
- Annual Reports
- White Paper
- Latest Press Release
- Industry Association
- Paid Database
- Investor Presentations

Step 4 - Data Triangulation
Involves using different sources of information in order to increase the validity of a study
These sources are likely to be stakeholders in a program - participants, other researchers, program staff, other community members, and so on.
Then we put all data in single framework & apply various statistical tools to find out the dynamic on the market.
During the analysis stage, feedback from the stakeholder groups would be compared to determine areas of agreement as well as areas of divergence
