

Key Insights
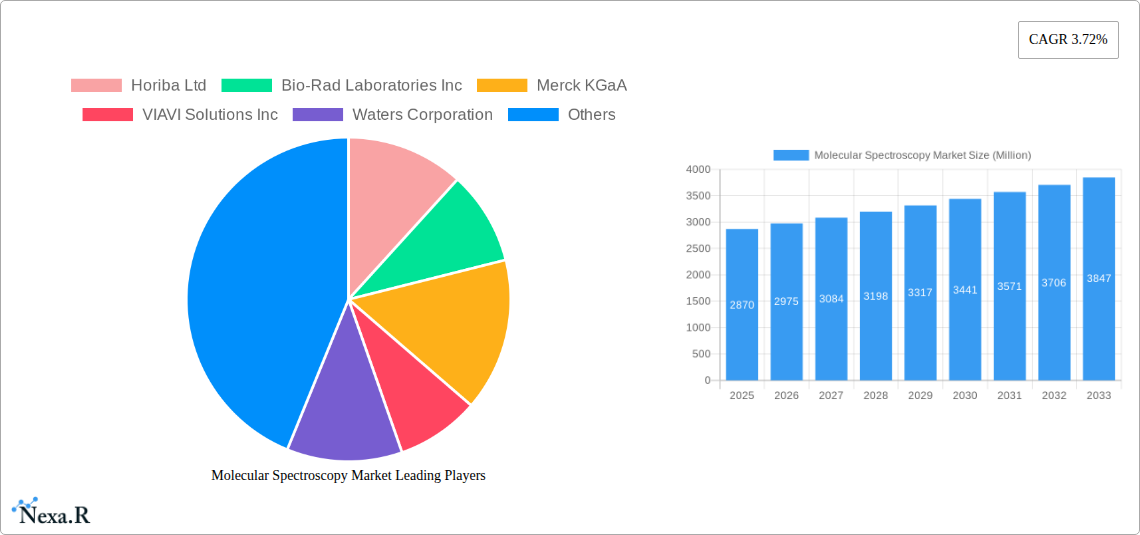
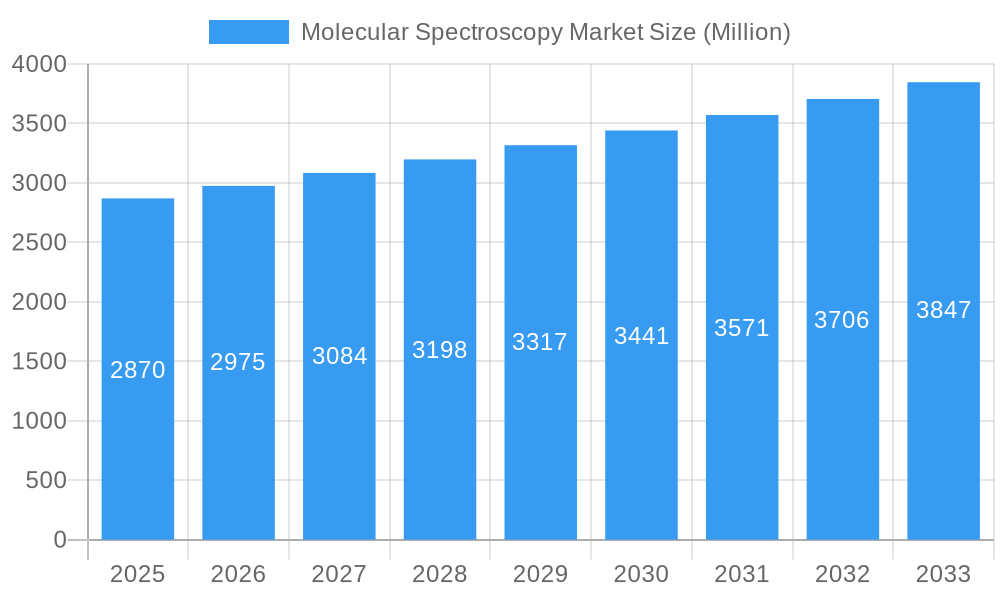
The global molecular spectroscopy market, valued at $2.87 billion in 2025, is projected to experience robust growth, driven by increasing demand across diverse sectors. A Compound Annual Growth Rate (CAGR) of 3.72% from 2025 to 2033 indicates a significant expansion, fueled primarily by advancements in pharmaceutical research and development, particularly in drug discovery and quality control. The burgeoning biotechnology and biopharmaceutical industries, coupled with the rising need for advanced analytical techniques in food safety and environmental monitoring, are key market drivers. Growth is further propelled by the increasing adoption of sophisticated spectroscopic techniques, such as Raman and NMR spectroscopy, offering enhanced sensitivity and resolution for complex molecular analysis. While the market faces certain restraints such as high instrument costs and the need for specialized expertise, the overall outlook remains positive. The market segmentation highlights the significant contribution of pharmaceutical applications, followed by food and beverage testing and biotechnology. North America and Europe currently dominate the market share, but the Asia-Pacific region is anticipated to demonstrate significant growth potential in the coming years due to rapid economic development and increasing investments in research infrastructure. The competitive landscape is characterized by a mix of established players like Thermo Fisher Scientific, Agilent Technologies, and Bruker, and smaller specialized companies, driving innovation and technological advancements.
Molecular Spectroscopy Market Market Size (In Billion)
The continued development of more compact, portable, and user-friendly molecular spectroscopy instruments will further broaden market accessibility. Moreover, ongoing research into novel spectroscopic techniques and applications, coupled with strategic partnerships and acquisitions within the industry, will be vital for maintaining market momentum. The increasing focus on personalized medicine and the growing demand for faster and more accurate analytical results further bolster the market's growth trajectory. While challenges like regulatory approvals and the complexity of certain applications remain, the overall market trend points towards a sustained and expanding market, driven by technological advancements and rising demand from diverse end-use sectors. Specific regional growth rates will depend on factors such as government regulations, investment in R&D, and the overall economic climate of each area.
Molecular Spectroscopy Market Company Market Share
Molecular Spectroscopy Market: A Comprehensive Report (2019-2033)
This in-depth report provides a comprehensive analysis of the Molecular Spectroscopy Market, encompassing its current state, future trends, and key players. With a study period spanning 2019-2033, a base year of 2025, and a forecast period of 2025-2033, this report offers invaluable insights for industry professionals, investors, and researchers. The parent market is the analytical instrumentation market and the child market is molecular spectroscopy. The market size in 2025 is estimated at xx Million.
Molecular Spectroscopy Market Dynamics & Structure
The Molecular Spectroscopy Market is characterized by a moderately consolidated structure with several key players holding significant market share. Market concentration is influenced by factors like technological advancements, regulatory approvals, and the prevalence of M&A activities. Technological innovation, particularly in areas like miniaturization and improved sensitivity, is a primary driver. Stringent regulatory frameworks governing the use of molecular spectroscopy in various applications (e.g., pharmaceutical testing) also shape market dynamics. The market faces competition from alternative analytical techniques, but the high accuracy and specificity of molecular spectroscopy maintain its strong position. End-user demographics are diverse, encompassing pharmaceutical companies, research institutions, food and beverage manufacturers, and environmental testing labs. The historical period (2019-2024) witnessed a moderate number of M&A deals, driven primarily by the need to expand product portfolios and geographic reach. The forecast period is expected to see an increase in M&A activities with a xx% increase.
- Market Concentration: Moderately consolidated, with top 5 players holding approximately xx% market share in 2025.
- Technological Innovation: Miniaturization, improved sensitivity, and automation are key drivers.
- Regulatory Framework: Stringent regulations in pharmaceutical and environmental testing influence market growth.
- Competitive Substitutes: Chromatography, mass spectrometry, and other analytical techniques pose competition.
- End-User Demographics: Pharmaceutical, food & beverage, environmental, academic, and biotech sectors.
- M&A Trends: A moderate number of mergers and acquisitions, projected to increase in the forecast period (2025-2033).
Molecular Spectroscopy Market Growth Trends & Insights
The Molecular Spectroscopy Market exhibits a steady growth trajectory, driven by the increasing demand for precise analytical techniques across diverse applications. The market size is projected to reach xx Million by 2033, registering a CAGR of xx% during the forecast period. This growth is fueled by rising investments in R&D, the adoption of advanced technologies, and the increasing prevalence of chronic diseases driving the need for precise diagnostics in pharmaceuticals and biotech. Technological disruptions, such as the development of portable and handheld spectrometers, are significantly impacting adoption rates. Consumer behavior shifts toward environmentally conscious practices are also contributing to market growth, especially within environmental testing. Market penetration across emerging economies is expected to increase significantly, further contributing to market expansion. The adoption rate for the advanced spectroscopy techniques have increased from xx% to xx% over the period 2019-2025.
Dominant Regions, Countries, or Segments in Molecular Spectroscopy Market
North America currently dominates the Molecular Spectroscopy Market, driven by robust technological advancements, a strong regulatory framework, and high investments in research and development. Europe follows closely, exhibiting significant growth potential. Within the segments, Pharmaceutical Applications and Biotechnology and Biopharmaceutical Applications hold the largest market share, driven by the high demand for quality control and drug discovery in the pharmaceutical industry. NMR Spectroscopy and Mass Spectroscopy are the leading types of spectroscopy, owing to their versatility and high analytical capabilities.
- Key Regional Drivers:
- North America: High R&D investments, strong regulatory support, advanced technological infrastructure.
- Europe: Growing pharmaceutical industry, stringent environmental regulations.
- Asia-Pacific: Rapid economic growth, increasing healthcare expenditure, rising adoption in emerging economies.
- Dominant Segments:
- Application: Pharmaceutical Applications, Biotechnology and Biopharmaceutical Applications.
- Type of Spectroscopy: NMR Spectroscopy, Mass Spectroscopy.
Molecular Spectroscopy Market Product Landscape
The Molecular Spectroscopy market showcases continuous innovation in instrument design, software capabilities, and data analysis techniques. New products emphasize portability, ease of use, and improved sensitivity, expanding applications into diverse fields. Unique selling propositions include advanced data processing algorithms, automated sample handling, and integrated software packages. Technological advancements focus on enhancing spectral resolution, reducing analysis time, and minimizing sample preparation requirements.
Key Drivers, Barriers & Challenges in Molecular Spectroscopy Market
Key Drivers: Increasing demand for precise analytical tools in pharmaceutical, biotech, and environmental sectors; advancements in miniaturization and portability of instruments; rising R&D investments in life sciences and materials science; stringent regulatory requirements for quality control.
Key Barriers and Challenges: High initial investment costs; complex operation and maintenance requirements; the availability of skilled personnel; competitive pressures from alternative analytical techniques; stringent regulatory approvals for new technologies and applications; potential supply chain disruptions impacting the availability of crucial components. For example, xx% of the components are imported and a xx% increase in the cost is anticipated in the next few years.
Emerging Opportunities in Molecular Spectroscopy Market
Emerging opportunities exist in developing countries, particularly in Asia and Africa, where healthcare and environmental testing infrastructures are expanding rapidly. Innovative applications in food safety and quality control, environmental monitoring, and materials science are gaining traction. Evolving consumer preferences for natural and organic products are driving demand for sophisticated food testing methodologies. The development of point-of-care molecular spectroscopy devices offers significant potential for personalized medicine and rapid diagnostics.
Growth Accelerators in the Molecular Spectroscopy Market Industry
Technological advancements such as the development of advanced detectors, improved algorithms for data processing, and integration with artificial intelligence are driving long-term growth. Strategic partnerships between instrument manufacturers and application specialists are expanding market reach. Expansion into new applications, particularly in the rapidly evolving fields of nanotechnology and biopharmaceuticals, are providing significant growth opportunities.
Key Players Shaping the Molecular Spectroscopy Market Market
Notable Milestones in Molecular Spectroscopy Market Sector
- 2020: Launch of a new miniaturized Raman spectrometer by Horiba Ltd.
- 2021: Acquisition of a smaller spectroscopy company by Thermo Fisher Scientific.
- 2022: Introduction of AI-powered data analysis software by Agilent Technologies.
- 2023: Significant investment in R&D for advanced NMR technology by Bruker Corporation.
- 2024: Regulatory approval of a new near-infrared spectroscopy device for food safety testing in the EU.
In-Depth Molecular Spectroscopy Market Market Outlook
The Molecular Spectroscopy Market is poised for significant growth in the coming years, driven by continued technological advancements, expanding applications, and increasing demand across various industries. Strategic partnerships, focused R&D efforts, and expansion into new geographical markets will further propel market growth. The development of sophisticated data analysis tools and the increasing integration of artificial intelligence will enhance the analytical capabilities of molecular spectroscopy, fostering wider adoption and creating lucrative opportunities for market players.
Molecular Spectroscopy Market Segmentation
-
1. Type of Spectroscopy
- 1.1. NMR Spectroscopy
- 1.2. Raman Spectroscopy
- 1.3. UV-visible Spectroscopy
- 1.4. Mass Spectroscopy
- 1.5. Infrared Spectroscopy
- 1.6. Near-infrared Spectroscopy
- 1.7. Other Types of Spectroscopy
-
2. Application
- 2.1. Pharmaceutical Applications
- 2.2. Food and Beverage Testing
- 2.3. Biotechnology and Biopharmaceutical Applications
- 2.4. Environmental Testing
- 2.5. Academic Research
- 2.6. Other Applications
Molecular Spectroscopy Market Segmentation By Geography
-
1. North America
- 1.1. United States
- 1.2. Canada
- 1.3. Mexico
-
2. Europe
- 2.1. Germany
- 2.2. United Kingdom
- 2.3. France
- 2.4. Italy
- 2.5. Spain
- 2.6. Rest of Europe
-
3. Asia Pacific
- 3.1. China
- 3.2. Japan
- 3.3. India
- 3.4. Australia
- 3.5. South Korea
- 3.6. Rest of Asia Pacific
-
4. Middle East and Africa
- 4.1. GCC
- 4.2. South Africa
- 4.3. Rest of Middle East and Africa
-
5. South America
- 5.1. Brazil
- 5.2. Argentina
- 5.3. Rest of South America
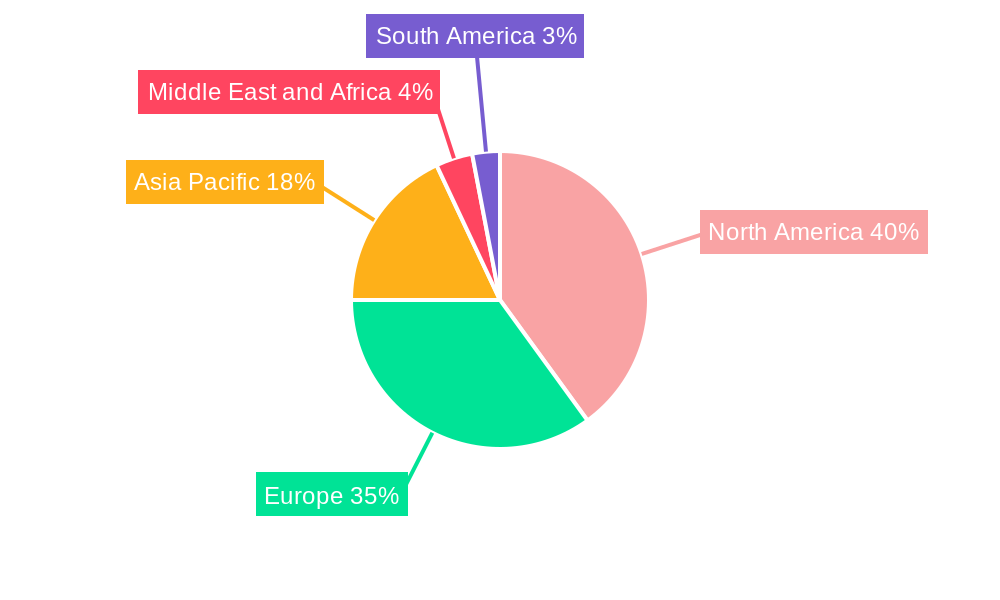
Molecular Spectroscopy Market Regional Market Share
Geographic Coverage of Molecular Spectroscopy Market
Molecular Spectroscopy Market REPORT HIGHLIGHTS
| Aspects | Details |
|---|---|
| Study Period | 2020-2034 |
| Base Year | 2025 |
| Estimated Year | 2026 |
| Forecast Period | 2026-2034 |
| Historical Period | 2020-2025 |
| Growth Rate | CAGR of 3.72% from 2020-2034 |
| Segmentation |
|
Table of Contents
- 1. Introduction
- 1.1. Research Scope
- 1.2. Market Segmentation
- 1.3. Research Objective
- 1.4. Definitions and Assumptions
- 2. Executive Summary
- 2.1. Market Snapshot
- 3. Market Dynamics
- 3.1. Market Drivers
- 3.2. Market Restrains
- 3.3. Market Trends
- 3.4. Market Opportunities
- 4. Market Factor Analysis
- 4.1. Porters Five Forces
- 4.1.1. Bargaining Power of Suppliers
- 4.1.2. Bargaining Power of Buyers
- 4.1.3. Threat of New Entrants
- 4.1.4. Threat of Substitutes
- 4.1.5. Competitive Rivalry
- 4.2. PESTEL analysis
- 4.3. BCG Analysis
- 4.3.1. Stars (High Growth, High Market Share)
- 4.3.2. Cash Cows (Low Growth, High Market Share)
- 4.3.3. Question Mark (High Growth, Low Market Share)
- 4.3.4. Dogs (Low Growth, Low Market Share)
- 4.4. Ansoff Matrix Analysis
- 4.5. Supply Chain Analysis
- 4.6. Regulatory Landscape
- 4.7. Current Market Potential and Opportunity Assessment (TAM–SAM–SOM Framework)
- 4.8. NRP Analyst Note
- 4.1. Porters Five Forces
- 5. Market Analysis, Insights and Forecast 2021-2033
- 5.1. Market Analysis, Insights and Forecast - by Type of Spectroscopy
- 5.1.1. NMR Spectroscopy
- 5.1.2. Raman Spectroscopy
- 5.1.3. UV-visible Spectroscopy
- 5.1.4. Mass Spectroscopy
- 5.1.5. Infrared Spectroscopy
- 5.1.6. Near-infrared Spectroscopy
- 5.1.7. Other Types of Spectroscopy
- 5.2. Market Analysis, Insights and Forecast - by Application
- 5.2.1. Pharmaceutical Applications
- 5.2.2. Food and Beverage Testing
- 5.2.3. Biotechnology and Biopharmaceutical Applications
- 5.2.4. Environmental Testing
- 5.2.5. Academic Research
- 5.2.6. Other Applications
- 5.3. Market Analysis, Insights and Forecast - by Region
- 5.3.1. North America
- 5.3.2. Europe
- 5.3.3. Asia Pacific
- 5.3.4. Middle East and Africa
- 5.3.5. South America
- 5.1. Market Analysis, Insights and Forecast - by Type of Spectroscopy
- 6. Global Molecular Spectroscopy Market Analysis, Insights and Forecast, 2021-2033
- 6.1. Market Analysis, Insights and Forecast - by Type of Spectroscopy
- 6.1.1. NMR Spectroscopy
- 6.1.2. Raman Spectroscopy
- 6.1.3. UV-visible Spectroscopy
- 6.1.4. Mass Spectroscopy
- 6.1.5. Infrared Spectroscopy
- 6.1.6. Near-infrared Spectroscopy
- 6.1.7. Other Types of Spectroscopy
- 6.2. Market Analysis, Insights and Forecast - by Application
- 6.2.1. Pharmaceutical Applications
- 6.2.2. Food and Beverage Testing
- 6.2.3. Biotechnology and Biopharmaceutical Applications
- 6.2.4. Environmental Testing
- 6.2.5. Academic Research
- 6.2.6. Other Applications
- 6.1. Market Analysis, Insights and Forecast - by Type of Spectroscopy
- 7. North America Molecular Spectroscopy Market Analysis, Insights and Forecast, 2020-2032
- 7.1. Market Analysis, Insights and Forecast - by Type of Spectroscopy
- 7.1.1. NMR Spectroscopy
- 7.1.2. Raman Spectroscopy
- 7.1.3. UV-visible Spectroscopy
- 7.1.4. Mass Spectroscopy
- 7.1.5. Infrared Spectroscopy
- 7.1.6. Near-infrared Spectroscopy
- 7.1.7. Other Types of Spectroscopy
- 7.2. Market Analysis, Insights and Forecast - by Application
- 7.2.1. Pharmaceutical Applications
- 7.2.2. Food and Beverage Testing
- 7.2.3. Biotechnology and Biopharmaceutical Applications
- 7.2.4. Environmental Testing
- 7.2.5. Academic Research
- 7.2.6. Other Applications
- 7.1. Market Analysis, Insights and Forecast - by Type of Spectroscopy
- 8. Europe Molecular Spectroscopy Market Analysis, Insights and Forecast, 2020-2032
- 8.1. Market Analysis, Insights and Forecast - by Type of Spectroscopy
- 8.1.1. NMR Spectroscopy
- 8.1.2. Raman Spectroscopy
- 8.1.3. UV-visible Spectroscopy
- 8.1.4. Mass Spectroscopy
- 8.1.5. Infrared Spectroscopy
- 8.1.6. Near-infrared Spectroscopy
- 8.1.7. Other Types of Spectroscopy
- 8.2. Market Analysis, Insights and Forecast - by Application
- 8.2.1. Pharmaceutical Applications
- 8.2.2. Food and Beverage Testing
- 8.2.3. Biotechnology and Biopharmaceutical Applications
- 8.2.4. Environmental Testing
- 8.2.5. Academic Research
- 8.2.6. Other Applications
- 8.1. Market Analysis, Insights and Forecast - by Type of Spectroscopy
- 9. Asia Pacific Molecular Spectroscopy Market Analysis, Insights and Forecast, 2020-2032
- 9.1. Market Analysis, Insights and Forecast - by Type of Spectroscopy
- 9.1.1. NMR Spectroscopy
- 9.1.2. Raman Spectroscopy
- 9.1.3. UV-visible Spectroscopy
- 9.1.4. Mass Spectroscopy
- 9.1.5. Infrared Spectroscopy
- 9.1.6. Near-infrared Spectroscopy
- 9.1.7. Other Types of Spectroscopy
- 9.2. Market Analysis, Insights and Forecast - by Application
- 9.2.1. Pharmaceutical Applications
- 9.2.2. Food and Beverage Testing
- 9.2.3. Biotechnology and Biopharmaceutical Applications
- 9.2.4. Environmental Testing
- 9.2.5. Academic Research
- 9.2.6. Other Applications
- 9.1. Market Analysis, Insights and Forecast - by Type of Spectroscopy
- 10. Middle East and Africa Molecular Spectroscopy Market Analysis, Insights and Forecast, 2020-2032
- 10.1. Market Analysis, Insights and Forecast - by Type of Spectroscopy
- 10.1.1. NMR Spectroscopy
- 10.1.2. Raman Spectroscopy
- 10.1.3. UV-visible Spectroscopy
- 10.1.4. Mass Spectroscopy
- 10.1.5. Infrared Spectroscopy
- 10.1.6. Near-infrared Spectroscopy
- 10.1.7. Other Types of Spectroscopy
- 10.2. Market Analysis, Insights and Forecast - by Application
- 10.2.1. Pharmaceutical Applications
- 10.2.2. Food and Beverage Testing
- 10.2.3. Biotechnology and Biopharmaceutical Applications
- 10.2.4. Environmental Testing
- 10.2.5. Academic Research
- 10.2.6. Other Applications
- 10.1. Market Analysis, Insights and Forecast - by Type of Spectroscopy
- 11. South America Molecular Spectroscopy Market Analysis, Insights and Forecast, 2020-2032
- 11.1. Market Analysis, Insights and Forecast - by Type of Spectroscopy
- 11.1.1. NMR Spectroscopy
- 11.1.2. Raman Spectroscopy
- 11.1.3. UV-visible Spectroscopy
- 11.1.4. Mass Spectroscopy
- 11.1.5. Infrared Spectroscopy
- 11.1.6. Near-infrared Spectroscopy
- 11.1.7. Other Types of Spectroscopy
- 11.2. Market Analysis, Insights and Forecast - by Application
- 11.2.1. Pharmaceutical Applications
- 11.2.2. Food and Beverage Testing
- 11.2.3. Biotechnology and Biopharmaceutical Applications
- 11.2.4. Environmental Testing
- 11.2.5. Academic Research
- 11.2.6. Other Applications
- 11.1. Market Analysis, Insights and Forecast - by Type of Spectroscopy
- 12. Competitive Analysis
- 12.1. Company Profiles
- 12.1.1 Horiba Ltd
- 12.1.1.1. Company Overview
- 12.1.1.2. Products
- 12.1.1.3. Company Financials
- 12.1.1.4. SWOT Analysis
- 12.1.2 Bio-Rad Laboratories Inc
- 12.1.2.1. Company Overview
- 12.1.2.2. Products
- 12.1.2.3. Company Financials
- 12.1.2.4. SWOT Analysis
- 12.1.3 Merck KGaA
- 12.1.3.1. Company Overview
- 12.1.3.2. Products
- 12.1.3.3. Company Financials
- 12.1.3.4. SWOT Analysis
- 12.1.4 VIAVI Solutions Inc
- 12.1.4.1. Company Overview
- 12.1.4.2. Products
- 12.1.4.3. Company Financials
- 12.1.4.4. SWOT Analysis
- 12.1.5 Waters Corporation
- 12.1.5.1. Company Overview
- 12.1.5.2. Products
- 12.1.5.3. Company Financials
- 12.1.5.4. SWOT Analysis
- 12.1.6 Danaher Corporation
- 12.1.6.1. Company Overview
- 12.1.6.2. Products
- 12.1.6.3. Company Financials
- 12.1.6.4. SWOT Analysis
- 12.1.7 Agilent Technologies Inc
- 12.1.7.1. Company Overview
- 12.1.7.2. Products
- 12.1.7.3. Company Financials
- 12.1.7.4. SWOT Analysis
- 12.1.8 Thermo Fischer Scientific Inc
- 12.1.8.1. Company Overview
- 12.1.8.2. Products
- 12.1.8.3. Company Financials
- 12.1.8.4. SWOT Analysis
- 12.1.9 Jeol Ltd
- 12.1.9.1. Company Overview
- 12.1.9.2. Products
- 12.1.9.3. Company Financials
- 12.1.9.4. SWOT Analysis
- 12.1.10 Keit Ltd
- 12.1.10.1. Company Overview
- 12.1.10.2. Products
- 12.1.10.3. Company Financials
- 12.1.10.4. SWOT Analysis
- 12.1.11 PerkinElmer Inc
- 12.1.11.1. Company Overview
- 12.1.11.2. Products
- 12.1.11.3. Company Financials
- 12.1.11.4. SWOT Analysis
- 12.1.12 Thorlabs Inc
- 12.1.12.1. Company Overview
- 12.1.12.2. Products
- 12.1.12.3. Company Financials
- 12.1.12.4. SWOT Analysis
- 12.1.13 Bruker Corporation
- 12.1.13.1. Company Overview
- 12.1.13.2. Products
- 12.1.13.3. Company Financials
- 12.1.13.4. SWOT Analysis
- 12.1.14 Shimadzu Corporation
- 12.1.14.1. Company Overview
- 12.1.14.2. Products
- 12.1.14.3. Company Financials
- 12.1.14.4. SWOT Analysis
- 12.1.1 Horiba Ltd
- 12.2. Market Entropy
- 12.2.1 Company's Key Areas Served
- 12.2.2 Recent Developments
- 12.3. Company Market Share Analysis 2025
- 12.3.1 Top 5 Companies Market Share Analysis
- 12.3.2 Top 3 Companies Market Share Analysis
- 12.4. List of Potential Customers
- 13. Research Methodology
List of Figures
- Figure 1: Global Molecular Spectroscopy Market Revenue Breakdown (Million, %) by Region 2025 & 2033
- Figure 2: Global Molecular Spectroscopy Market Volume Breakdown (K Unit, %) by Region 2025 & 2033
- Figure 3: North America Molecular Spectroscopy Market Revenue (Million), by Type of Spectroscopy 2025 & 2033
- Figure 4: North America Molecular Spectroscopy Market Volume (K Unit), by Type of Spectroscopy 2025 & 2033
- Figure 5: North America Molecular Spectroscopy Market Revenue Share (%), by Type of Spectroscopy 2025 & 2033
- Figure 6: North America Molecular Spectroscopy Market Volume Share (%), by Type of Spectroscopy 2025 & 2033
- Figure 7: North America Molecular Spectroscopy Market Revenue (Million), by Application 2025 & 2033
- Figure 8: North America Molecular Spectroscopy Market Volume (K Unit), by Application 2025 & 2033
- Figure 9: North America Molecular Spectroscopy Market Revenue Share (%), by Application 2025 & 2033
- Figure 10: North America Molecular Spectroscopy Market Volume Share (%), by Application 2025 & 2033
- Figure 11: North America Molecular Spectroscopy Market Revenue (Million), by Country 2025 & 2033
- Figure 12: North America Molecular Spectroscopy Market Volume (K Unit), by Country 2025 & 2033
- Figure 13: North America Molecular Spectroscopy Market Revenue Share (%), by Country 2025 & 2033
- Figure 14: North America Molecular Spectroscopy Market Volume Share (%), by Country 2025 & 2033
- Figure 15: Europe Molecular Spectroscopy Market Revenue (Million), by Type of Spectroscopy 2025 & 2033
- Figure 16: Europe Molecular Spectroscopy Market Volume (K Unit), by Type of Spectroscopy 2025 & 2033
- Figure 17: Europe Molecular Spectroscopy Market Revenue Share (%), by Type of Spectroscopy 2025 & 2033
- Figure 18: Europe Molecular Spectroscopy Market Volume Share (%), by Type of Spectroscopy 2025 & 2033
- Figure 19: Europe Molecular Spectroscopy Market Revenue (Million), by Application 2025 & 2033
- Figure 20: Europe Molecular Spectroscopy Market Volume (K Unit), by Application 2025 & 2033
- Figure 21: Europe Molecular Spectroscopy Market Revenue Share (%), by Application 2025 & 2033
- Figure 22: Europe Molecular Spectroscopy Market Volume Share (%), by Application 2025 & 2033
- Figure 23: Europe Molecular Spectroscopy Market Revenue (Million), by Country 2025 & 2033
- Figure 24: Europe Molecular Spectroscopy Market Volume (K Unit), by Country 2025 & 2033
- Figure 25: Europe Molecular Spectroscopy Market Revenue Share (%), by Country 2025 & 2033
- Figure 26: Europe Molecular Spectroscopy Market Volume Share (%), by Country 2025 & 2033
- Figure 27: Asia Pacific Molecular Spectroscopy Market Revenue (Million), by Type of Spectroscopy 2025 & 2033
- Figure 28: Asia Pacific Molecular Spectroscopy Market Volume (K Unit), by Type of Spectroscopy 2025 & 2033
- Figure 29: Asia Pacific Molecular Spectroscopy Market Revenue Share (%), by Type of Spectroscopy 2025 & 2033
- Figure 30: Asia Pacific Molecular Spectroscopy Market Volume Share (%), by Type of Spectroscopy 2025 & 2033
- Figure 31: Asia Pacific Molecular Spectroscopy Market Revenue (Million), by Application 2025 & 2033
- Figure 32: Asia Pacific Molecular Spectroscopy Market Volume (K Unit), by Application 2025 & 2033
- Figure 33: Asia Pacific Molecular Spectroscopy Market Revenue Share (%), by Application 2025 & 2033
- Figure 34: Asia Pacific Molecular Spectroscopy Market Volume Share (%), by Application 2025 & 2033
- Figure 35: Asia Pacific Molecular Spectroscopy Market Revenue (Million), by Country 2025 & 2033
- Figure 36: Asia Pacific Molecular Spectroscopy Market Volume (K Unit), by Country 2025 & 2033
- Figure 37: Asia Pacific Molecular Spectroscopy Market Revenue Share (%), by Country 2025 & 2033
- Figure 38: Asia Pacific Molecular Spectroscopy Market Volume Share (%), by Country 2025 & 2033
- Figure 39: Middle East and Africa Molecular Spectroscopy Market Revenue (Million), by Type of Spectroscopy 2025 & 2033
- Figure 40: Middle East and Africa Molecular Spectroscopy Market Volume (K Unit), by Type of Spectroscopy 2025 & 2033
- Figure 41: Middle East and Africa Molecular Spectroscopy Market Revenue Share (%), by Type of Spectroscopy 2025 & 2033
- Figure 42: Middle East and Africa Molecular Spectroscopy Market Volume Share (%), by Type of Spectroscopy 2025 & 2033
- Figure 43: Middle East and Africa Molecular Spectroscopy Market Revenue (Million), by Application 2025 & 2033
- Figure 44: Middle East and Africa Molecular Spectroscopy Market Volume (K Unit), by Application 2025 & 2033
- Figure 45: Middle East and Africa Molecular Spectroscopy Market Revenue Share (%), by Application 2025 & 2033
- Figure 46: Middle East and Africa Molecular Spectroscopy Market Volume Share (%), by Application 2025 & 2033
- Figure 47: Middle East and Africa Molecular Spectroscopy Market Revenue (Million), by Country 2025 & 2033
- Figure 48: Middle East and Africa Molecular Spectroscopy Market Volume (K Unit), by Country 2025 & 2033
- Figure 49: Middle East and Africa Molecular Spectroscopy Market Revenue Share (%), by Country 2025 & 2033
- Figure 50: Middle East and Africa Molecular Spectroscopy Market Volume Share (%), by Country 2025 & 2033
- Figure 51: South America Molecular Spectroscopy Market Revenue (Million), by Type of Spectroscopy 2025 & 2033
- Figure 52: South America Molecular Spectroscopy Market Volume (K Unit), by Type of Spectroscopy 2025 & 2033
- Figure 53: South America Molecular Spectroscopy Market Revenue Share (%), by Type of Spectroscopy 2025 & 2033
- Figure 54: South America Molecular Spectroscopy Market Volume Share (%), by Type of Spectroscopy 2025 & 2033
- Figure 55: South America Molecular Spectroscopy Market Revenue (Million), by Application 2025 & 2033
- Figure 56: South America Molecular Spectroscopy Market Volume (K Unit), by Application 2025 & 2033
- Figure 57: South America Molecular Spectroscopy Market Revenue Share (%), by Application 2025 & 2033
- Figure 58: South America Molecular Spectroscopy Market Volume Share (%), by Application 2025 & 2033
- Figure 59: South America Molecular Spectroscopy Market Revenue (Million), by Country 2025 & 2033
- Figure 60: South America Molecular Spectroscopy Market Volume (K Unit), by Country 2025 & 2033
- Figure 61: South America Molecular Spectroscopy Market Revenue Share (%), by Country 2025 & 2033
- Figure 62: South America Molecular Spectroscopy Market Volume Share (%), by Country 2025 & 2033
List of Tables
- Table 1: Global Molecular Spectroscopy Market Revenue Million Forecast, by Type of Spectroscopy 2020 & 2033
- Table 2: Global Molecular Spectroscopy Market Volume K Unit Forecast, by Type of Spectroscopy 2020 & 2033
- Table 3: Global Molecular Spectroscopy Market Revenue Million Forecast, by Application 2020 & 2033
- Table 4: Global Molecular Spectroscopy Market Volume K Unit Forecast, by Application 2020 & 2033
- Table 5: Global Molecular Spectroscopy Market Revenue Million Forecast, by Region 2020 & 2033
- Table 6: Global Molecular Spectroscopy Market Volume K Unit Forecast, by Region 2020 & 2033
- Table 7: Global Molecular Spectroscopy Market Revenue Million Forecast, by Type of Spectroscopy 2020 & 2033
- Table 8: Global Molecular Spectroscopy Market Volume K Unit Forecast, by Type of Spectroscopy 2020 & 2033
- Table 9: Global Molecular Spectroscopy Market Revenue Million Forecast, by Application 2020 & 2033
- Table 10: Global Molecular Spectroscopy Market Volume K Unit Forecast, by Application 2020 & 2033
- Table 11: Global Molecular Spectroscopy Market Revenue Million Forecast, by Country 2020 & 2033
- Table 12: Global Molecular Spectroscopy Market Volume K Unit Forecast, by Country 2020 & 2033
- Table 13: United States Molecular Spectroscopy Market Revenue (Million) Forecast, by Application 2020 & 2033
- Table 14: United States Molecular Spectroscopy Market Volume (K Unit) Forecast, by Application 2020 & 2033
- Table 15: Canada Molecular Spectroscopy Market Revenue (Million) Forecast, by Application 2020 & 2033
- Table 16: Canada Molecular Spectroscopy Market Volume (K Unit) Forecast, by Application 2020 & 2033
- Table 17: Mexico Molecular Spectroscopy Market Revenue (Million) Forecast, by Application 2020 & 2033
- Table 18: Mexico Molecular Spectroscopy Market Volume (K Unit) Forecast, by Application 2020 & 2033
- Table 19: Global Molecular Spectroscopy Market Revenue Million Forecast, by Type of Spectroscopy 2020 & 2033
- Table 20: Global Molecular Spectroscopy Market Volume K Unit Forecast, by Type of Spectroscopy 2020 & 2033
- Table 21: Global Molecular Spectroscopy Market Revenue Million Forecast, by Application 2020 & 2033
- Table 22: Global Molecular Spectroscopy Market Volume K Unit Forecast, by Application 2020 & 2033
- Table 23: Global Molecular Spectroscopy Market Revenue Million Forecast, by Country 2020 & 2033
- Table 24: Global Molecular Spectroscopy Market Volume K Unit Forecast, by Country 2020 & 2033
- Table 25: Germany Molecular Spectroscopy Market Revenue (Million) Forecast, by Application 2020 & 2033
- Table 26: Germany Molecular Spectroscopy Market Volume (K Unit) Forecast, by Application 2020 & 2033
- Table 27: United Kingdom Molecular Spectroscopy Market Revenue (Million) Forecast, by Application 2020 & 2033
- Table 28: United Kingdom Molecular Spectroscopy Market Volume (K Unit) Forecast, by Application 2020 & 2033
- Table 29: France Molecular Spectroscopy Market Revenue (Million) Forecast, by Application 2020 & 2033
- Table 30: France Molecular Spectroscopy Market Volume (K Unit) Forecast, by Application 2020 & 2033
- Table 31: Italy Molecular Spectroscopy Market Revenue (Million) Forecast, by Application 2020 & 2033
- Table 32: Italy Molecular Spectroscopy Market Volume (K Unit) Forecast, by Application 2020 & 2033
- Table 33: Spain Molecular Spectroscopy Market Revenue (Million) Forecast, by Application 2020 & 2033
- Table 34: Spain Molecular Spectroscopy Market Volume (K Unit) Forecast, by Application 2020 & 2033
- Table 35: Rest of Europe Molecular Spectroscopy Market Revenue (Million) Forecast, by Application 2020 & 2033
- Table 36: Rest of Europe Molecular Spectroscopy Market Volume (K Unit) Forecast, by Application 2020 & 2033
- Table 37: Global Molecular Spectroscopy Market Revenue Million Forecast, by Type of Spectroscopy 2020 & 2033
- Table 38: Global Molecular Spectroscopy Market Volume K Unit Forecast, by Type of Spectroscopy 2020 & 2033
- Table 39: Global Molecular Spectroscopy Market Revenue Million Forecast, by Application 2020 & 2033
- Table 40: Global Molecular Spectroscopy Market Volume K Unit Forecast, by Application 2020 & 2033
- Table 41: Global Molecular Spectroscopy Market Revenue Million Forecast, by Country 2020 & 2033
- Table 42: Global Molecular Spectroscopy Market Volume K Unit Forecast, by Country 2020 & 2033
- Table 43: China Molecular Spectroscopy Market Revenue (Million) Forecast, by Application 2020 & 2033
- Table 44: China Molecular Spectroscopy Market Volume (K Unit) Forecast, by Application 2020 & 2033
- Table 45: Japan Molecular Spectroscopy Market Revenue (Million) Forecast, by Application 2020 & 2033
- Table 46: Japan Molecular Spectroscopy Market Volume (K Unit) Forecast, by Application 2020 & 2033
- Table 47: India Molecular Spectroscopy Market Revenue (Million) Forecast, by Application 2020 & 2033
- Table 48: India Molecular Spectroscopy Market Volume (K Unit) Forecast, by Application 2020 & 2033
- Table 49: Australia Molecular Spectroscopy Market Revenue (Million) Forecast, by Application 2020 & 2033
- Table 50: Australia Molecular Spectroscopy Market Volume (K Unit) Forecast, by Application 2020 & 2033
- Table 51: South Korea Molecular Spectroscopy Market Revenue (Million) Forecast, by Application 2020 & 2033
- Table 52: South Korea Molecular Spectroscopy Market Volume (K Unit) Forecast, by Application 2020 & 2033
- Table 53: Rest of Asia Pacific Molecular Spectroscopy Market Revenue (Million) Forecast, by Application 2020 & 2033
- Table 54: Rest of Asia Pacific Molecular Spectroscopy Market Volume (K Unit) Forecast, by Application 2020 & 2033
- Table 55: Global Molecular Spectroscopy Market Revenue Million Forecast, by Type of Spectroscopy 2020 & 2033
- Table 56: Global Molecular Spectroscopy Market Volume K Unit Forecast, by Type of Spectroscopy 2020 & 2033
- Table 57: Global Molecular Spectroscopy Market Revenue Million Forecast, by Application 2020 & 2033
- Table 58: Global Molecular Spectroscopy Market Volume K Unit Forecast, by Application 2020 & 2033
- Table 59: Global Molecular Spectroscopy Market Revenue Million Forecast, by Country 2020 & 2033
- Table 60: Global Molecular Spectroscopy Market Volume K Unit Forecast, by Country 2020 & 2033
- Table 61: GCC Molecular Spectroscopy Market Revenue (Million) Forecast, by Application 2020 & 2033
- Table 62: GCC Molecular Spectroscopy Market Volume (K Unit) Forecast, by Application 2020 & 2033
- Table 63: South Africa Molecular Spectroscopy Market Revenue (Million) Forecast, by Application 2020 & 2033
- Table 64: South Africa Molecular Spectroscopy Market Volume (K Unit) Forecast, by Application 2020 & 2033
- Table 65: Rest of Middle East and Africa Molecular Spectroscopy Market Revenue (Million) Forecast, by Application 2020 & 2033
- Table 66: Rest of Middle East and Africa Molecular Spectroscopy Market Volume (K Unit) Forecast, by Application 2020 & 2033
- Table 67: Global Molecular Spectroscopy Market Revenue Million Forecast, by Type of Spectroscopy 2020 & 2033
- Table 68: Global Molecular Spectroscopy Market Volume K Unit Forecast, by Type of Spectroscopy 2020 & 2033
- Table 69: Global Molecular Spectroscopy Market Revenue Million Forecast, by Application 2020 & 2033
- Table 70: Global Molecular Spectroscopy Market Volume K Unit Forecast, by Application 2020 & 2033
- Table 71: Global Molecular Spectroscopy Market Revenue Million Forecast, by Country 2020 & 2033
- Table 72: Global Molecular Spectroscopy Market Volume K Unit Forecast, by Country 2020 & 2033
- Table 73: Brazil Molecular Spectroscopy Market Revenue (Million) Forecast, by Application 2020 & 2033
- Table 74: Brazil Molecular Spectroscopy Market Volume (K Unit) Forecast, by Application 2020 & 2033
- Table 75: Argentina Molecular Spectroscopy Market Revenue (Million) Forecast, by Application 2020 & 2033
- Table 76: Argentina Molecular Spectroscopy Market Volume (K Unit) Forecast, by Application 2020 & 2033
- Table 77: Rest of South America Molecular Spectroscopy Market Revenue (Million) Forecast, by Application 2020 & 2033
- Table 78: Rest of South America Molecular Spectroscopy Market Volume (K Unit) Forecast, by Application 2020 & 2033
Frequently Asked Questions
1. What is the projected Compound Annual Growth Rate (CAGR) of the Molecular Spectroscopy Market?
The projected CAGR is approximately 3.72%.
2. Which companies are prominent players in the Molecular Spectroscopy Market?
Key companies in the market include Horiba Ltd, Bio-Rad Laboratories Inc, Merck KGaA, VIAVI Solutions Inc, Waters Corporation, Danaher Corporation, Agilent Technologies Inc, Thermo Fischer Scientific Inc, Jeol Ltd, Keit Ltd, PerkinElmer Inc, Thorlabs Inc, Bruker Corporation, Shimadzu Corporation.
3. What are the main segments of the Molecular Spectroscopy Market?
The market segments include Type of Spectroscopy, Application.
4. Can you provide details about the market size?
The market size is estimated to be USD 2.87 Million as of 2022.
5. What are some drivers contributing to market growth?
Rapid Adoption in the Pharmaceutical Industry; Penetration of MS Technology in Various Verticals; Increased Emphasis for Discovery of Newer Molecules by Pharmaceuticals.
6. What are the notable trends driving market growth?
The NMR Spectroscopy Segment is Expected to Observe Good Growth Over the Forecast Period.
7. Are there any restraints impacting market growth?
High Cost of Maintenance and Installation Charges; Need of Technically Skilled Personnel.
8. Can you provide examples of recent developments in the market?
N/A
9. What pricing options are available for accessing the report?
Pricing options include single-user, multi-user, and enterprise licenses priced at USD 4750, USD 5250, and USD 8750 respectively.
10. Is the market size provided in terms of value or volume?
The market size is provided in terms of value, measured in Million and volume, measured in K Unit.
11. Are there any specific market keywords associated with the report?
Yes, the market keyword associated with the report is "Molecular Spectroscopy Market," which aids in identifying and referencing the specific market segment covered.
12. How do I determine which pricing option suits my needs best?
The pricing options vary based on user requirements and access needs. Individual users may opt for single-user licenses, while businesses requiring broader access may choose multi-user or enterprise licenses for cost-effective access to the report.
13. Are there any additional resources or data provided in the Molecular Spectroscopy Market report?
While the report offers comprehensive insights, it's advisable to review the specific contents or supplementary materials provided to ascertain if additional resources or data are available.
14. How can I stay updated on further developments or reports in the Molecular Spectroscopy Market?
To stay informed about further developments, trends, and reports in the Molecular Spectroscopy Market, consider subscribing to industry newsletters, following relevant companies and organizations, or regularly checking reputable industry news sources and publications.
Methodology
Step 1 - Identification of Relevant Samples Size from Population Database


Step 2 - Approaches for Defining Global Market Size (Value, Volume* & Price*)

Note*: In applicable scenarios
Step 3 - Data Sources
Primary Research
- Web Analytics
- Survey Reports
- Research Institute
- Latest Research Reports
- Opinion Leaders
Secondary Research
- Annual Reports
- White Paper
- Latest Press Release
- Industry Association
- Paid Database
- Investor Presentations

Step 4 - Data Triangulation
Involves using different sources of information in order to increase the validity of a study
These sources are likely to be stakeholders in a program - participants, other researchers, program staff, other community members, and so on.
Then we put all data in single framework & apply various statistical tools to find out the dynamic on the market.
During the analysis stage, feedback from the stakeholder groups would be compared to determine areas of agreement as well as areas of divergence