

Key Insights
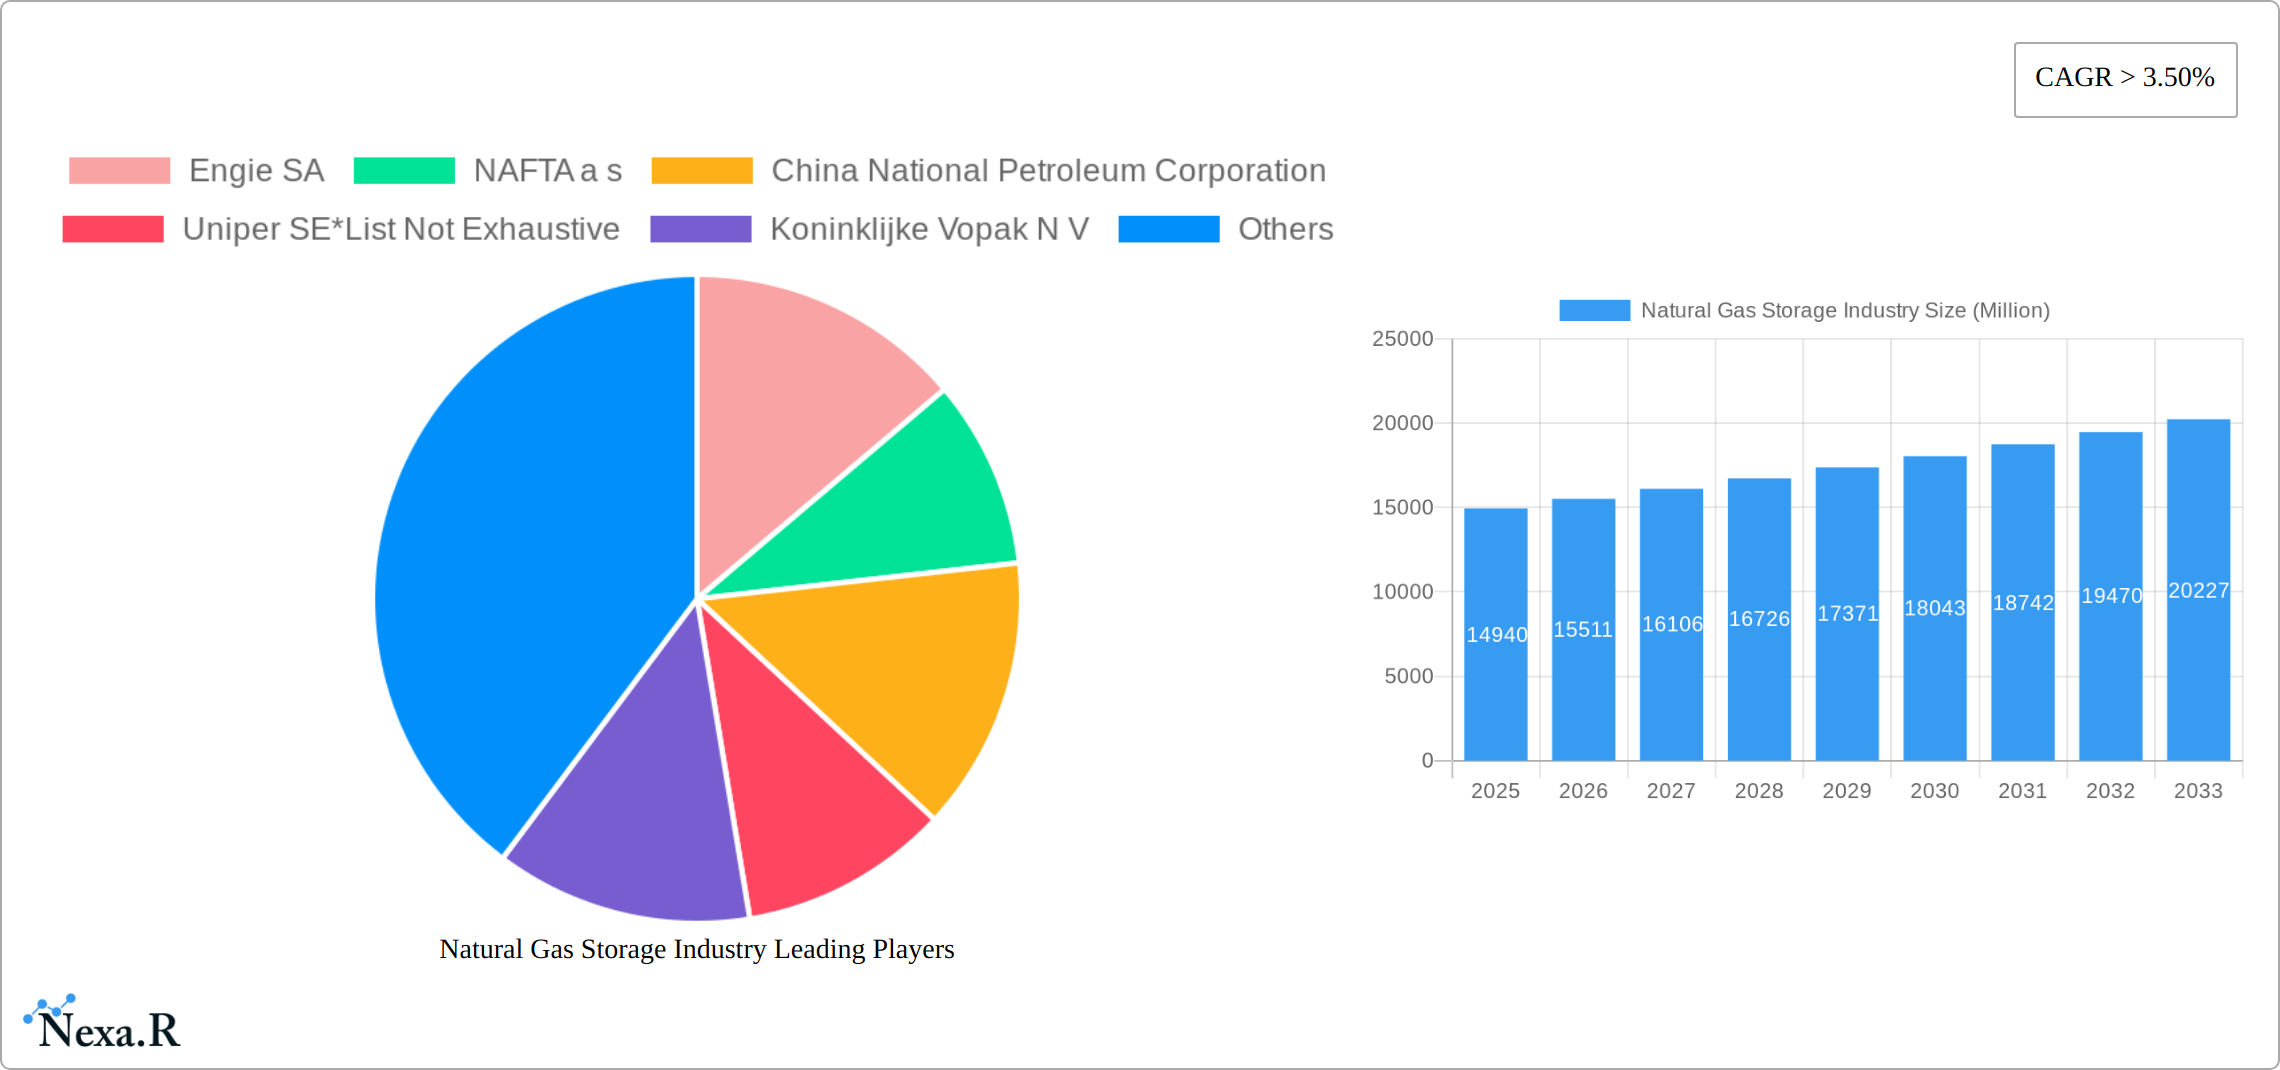
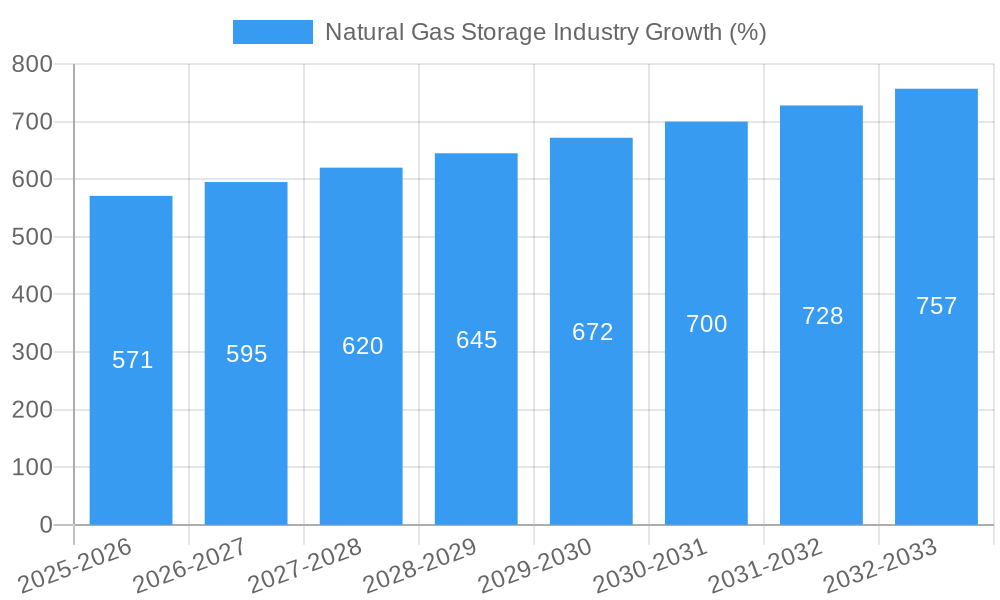
The global natural gas storage market, valued at $14.94 billion in 2025, is projected to experience robust growth, driven by increasing energy demands, the need for energy security, and the transition towards cleaner energy sources. The compound annual growth rate (CAGR) exceeding 3.50% from 2025 to 2033 indicates a significant expansion in market size. Key drivers include growing liquefied natural gas (LNG) trade, increasing reliance on natural gas for power generation, and government policies promoting gas infrastructure development to ensure reliable energy supply. The market segmentation highlights two primary types: underground storage, which dominates due to its higher storage capacity and lower cost, and above-ground storage, which offers greater flexibility and is often preferred for smaller-scale applications. Major players, including Engie SA, NAFTA, and China National Petroleum Corporation, are strategically investing in expanding their storage capacity and optimizing operational efficiency to meet growing market demands. Geographic expansion, particularly in developing economies with rapidly increasing energy consumption, presents significant opportunities. However, challenges remain, such as the high capital expenditure associated with new storage infrastructure, environmental concerns related to methane leakage, and regulatory complexities surrounding site selection and permitting.
The market's future trajectory is influenced by several trends. The shift towards renewable energy sources will likely necessitate improved integration of natural gas storage to balance intermittent energy supplies from solar and wind power. Technological advancements in storage technologies, such as the development of advanced materials for improved containment and safety, are expected to enhance efficiency and reduce operational costs. Furthermore, increased investments in smart grids and advanced energy management systems are expected to optimize the utilization of natural gas storage facilities, leading to greater efficiency and cost savings. The competitive landscape is characterized by both large multinational corporations and smaller regional players. Strategic partnerships, mergers and acquisitions, and technological innovations are expected to shape the industry's competitive dynamics in the coming years. The continuous exploration for new natural gas reserves and expansion of existing pipelines also play a critical role in the growth potential of the natural gas storage market.
Natural Gas Storage Industry Market Report: 2019-2033
This comprehensive report provides an in-depth analysis of the global natural gas storage industry, encompassing market dynamics, growth trends, competitive landscape, and future outlook. The study period covers 2019-2033, with a base year of 2025 and a forecast period of 2025-2033. The report caters to industry professionals, investors, and strategic decision-makers seeking a granular understanding of this vital energy sector. Parent market: Energy Storage; Child Market: Natural Gas Storage.
Natural Gas Storage Industry Market Dynamics & Structure
The natural gas storage industry is a dynamic sector shaped by a complex interplay of market forces, technological advancements, and regulatory landscapes. The global market, estimated at XX million in 2025, is projected to experience a CAGR of XX% throughout the forecast period. This growth trajectory is influenced by several key factors detailed below.
- Market Concentration and Competition: The market demonstrates moderate concentration, with a handful of major players controlling a significant portion (approximately XX% in 2025) of the global market share. However, the presence of numerous smaller, regional operators contributes to a competitive landscape. This competition is further fueled by the emergence of alternative energy storage solutions.
- Technological Innovation and Investment: Significant advancements in underground storage technologies (e.g., improved well design and enhanced reservoir management techniques), above-ground storage solutions (e.g., advanced LNG tank designs), and the widespread adoption of smart sensors for predictive maintenance and enhanced safety are driving efficiency and operational optimization. However, high capital expenditure requirements and rigorous regulatory approval processes continue to act as barriers to entry for new players and expansion projects.
- Regulatory Landscape and Policy: Governmental policies and regulations pertaining to emissions, safety, security, and environmental impact exert considerable influence on market dynamics. The varied regulatory frameworks across different jurisdictions create operational complexities for international players and necessitate region-specific adaptation strategies. Changes in these regulations, therefore, directly impact investment decisions and market expansion.
- Competitive Substitutes and Energy Transition: The rise of alternative energy storage solutions, including pumped hydro storage and battery storage technologies, presents a significant competitive challenge. Natural gas storage, however, maintains a competitive edge due to its established infrastructure, relatively lower cost in certain regions, and capacity for large-scale energy storage. The ongoing energy transition will require a strategic assessment of the role of natural gas storage within a diversified energy mix.
- End-User Demand and Market Segmentation: The primary end-users of natural gas storage remain power generation companies, industrial consumers, and city gas distribution networks. However, evolving energy consumption patterns, driven by factors like decarbonization targets and the increasing penetration of renewables, are significantly influencing the demand for storage capacity and the need for flexible storage solutions. Understanding these changing demands is crucial for market participants.
- Mergers, Acquisitions, and Strategic Alliances: The natural gas storage industry has seen a moderate level of M&A activity in recent years, with transactions primarily focused on expanding storage capacity, enhancing geographic reach, and consolidating market share. The total value of M&A deals in 2024 was approximately XX million, reflecting ongoing industry consolidation and strategic investments.
Natural Gas Storage Industry Growth Trends & Insights
This section details market size evolution, adoption rates, technological disruptions, and consumer behavior shifts in the natural gas storage industry from 2019 to 2033. The market is driven by increasing demand for natural gas, particularly in developing economies, and the need for enhanced grid reliability and energy security. The report uses extensive data and advanced analytical models to provide detailed insights into various market trends.
The market size has witnessed significant growth during the historical period (2019-2024), expanding from xx Million in 2019 to xx Million in 2024. The forecast period (2025-2033) projects continued growth, driven by factors such as the expansion of renewable energy sources and the increasing focus on energy security. Key growth drivers are further explored in the following sections. The market penetration of advanced storage technologies is expected to increase from xx% in 2025 to xx% by 2033, fueled by technological advancements and supportive government policies. The changing consumer behavior towards cleaner energy sources also drives the adoption of more efficient and sustainable storage solutions.
Dominant Regions, Countries, or Segments in Natural Gas Storage Industry
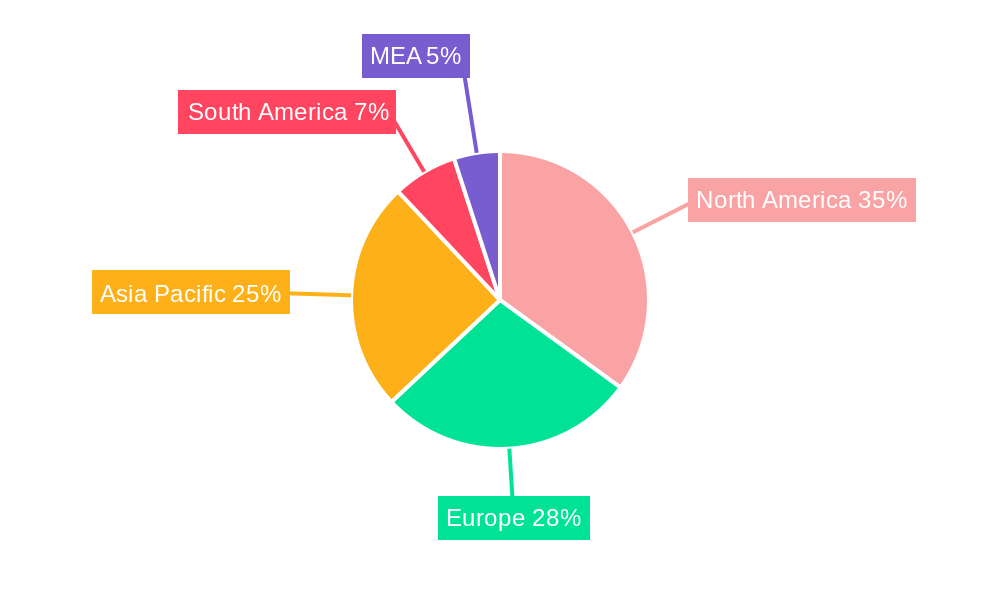
North America and Europe currently dominate the natural gas storage market, primarily due to established infrastructure and high demand. However, Asia-Pacific is expected to witness significant growth in the coming years, driven by increasing energy consumption and investments in gas infrastructure.
Type: Underground Storage
- Key Drivers: Existing extensive underground infrastructure, lower operating costs compared to above-ground storage, and higher storage capacity.
- Dominance Factors: Large-scale projects in North America and Europe have established underground storage as the dominant segment. This segment holds a xx% market share in 2025. Growth is expected to be driven by new projects, upgrades to existing facilities, and expanded capacity.
Type: Above-Ground Storage
- Key Drivers: Suitable for smaller-scale applications and locations with limited underground storage options. Advances in materials and design are making above-ground storage more efficient and cost-effective.
- Dominance Factors: Though smaller than the underground storage segment (holding xx% of the market in 2025), above-ground storage is experiencing growth, particularly in urban areas and regions where underground storage is not feasible. Future growth will be linked to technological advancements and cost reductions.
Natural Gas Storage Industry Product Landscape
The industry offers a diverse range of storage solutions, encompassing salt caverns, depleted gas fields, aquifers, and above-ground LNG storage tanks. Each technology presents its own set of advantages and disadvantages in terms of cost, capacity, geographic suitability, and environmental impact. Recent technological advancements have concentrated on enhancing storage capacity, improving safety features, and minimizing environmental footprint through leak detection and mitigation technologies. Advanced monitoring and control systems, coupled with data analytics, are being deployed to optimize storage operations, maximize efficiency, and ensure reliable and safe operation. Unique selling propositions increasingly emphasize enhanced safety and reduced environmental impact achieved through optimized operations and improved leak detection.
Key Drivers, Barriers & Challenges in Natural Gas Storage Industry
Key Drivers:
- The sustained growth in global natural gas demand for power generation and industrial applications is a primary driver.
- The increasing need for grid reliability and energy security, particularly in regions with intermittent renewable energy sources, underscores the importance of flexible and reliable storage.
- Government policies and initiatives aimed at promoting natural gas infrastructure development and energy security continue to incentivize investment in storage capacity.
- Ongoing technological advancements are improving the efficiency, safety, and cost-effectiveness of natural gas storage solutions, making them more attractive to investors and operators.
Key Challenges:
- The significant capital investment required for new projects and infrastructure development remains a substantial barrier to entry and expansion.
- Stringent regulatory approvals, environmental concerns, and the need for robust safety protocols impose significant hurdles for project development and operation.
- Intensifying competition from alternative energy storage technologies, such as pumped hydro and batteries, necessitates continuous innovation and cost optimization in the natural gas storage sector.
- Geopolitical risks and supply chain disruptions can significantly impact gas supply, prices, and the overall feasibility of storage projects. For example, the supply chain disruptions experienced in 2022 resulted in an approximate XX% price increase, highlighting the vulnerability of the industry to external factors.
Emerging Opportunities in Natural Gas Storage Industry
Significant opportunities exist at the intersection of natural gas storage and the energy transition. Integrating natural gas storage with renewable energy sources (e.g., solar and wind power) offers the potential to create hybrid energy systems that enhance grid stability and resilience, addressing the intermittency challenges of renewable energy. Furthermore, developing innovative storage solutions tailored for remote locations, leveraging advanced materials and technologies to reduce costs and increase efficiency, presents a promising avenue for growth. Finally, the expansion into developing countries experiencing rapid energy demand growth represents a considerable market opportunity, especially in regions with limited access to reliable and diversified energy sources.
Growth Accelerators in the Natural Gas Storage Industry Industry
Technological advancements, especially in materials science and data analytics, are significantly enhancing the efficiency and cost-effectiveness of natural gas storage. Strategic partnerships between storage operators, energy companies, and technology providers are driving innovation and accelerating market growth. Expansion into new geographical markets, especially in regions with growing energy demand, is another key growth accelerator.
Key Players Shaping the Natural Gas Storage Industry Market
- Engie SA
- NAFTA a s
- China National Petroleum Corporation
- Uniper SE
- Koninklijke Vopak N V
- Enbridge Inc
- Chiyoda Corporation
- John Wood Group PLC
- Gazprom PAO
- Costain Group PLC
Notable Milestones in Natural Gas Storage Industry Sector
- 2020: Launch of a new, large-scale underground storage facility in the US, significantly increasing storage capacity.
- 2021: Introduction of advanced leak detection technology in European storage facilities, improving safety and environmental performance.
- 2022: Government policy in the EU offering financial incentives for developing new storage infrastructure.
- 2023: Strategic partnership between a major energy company and a technology provider to develop a new generation of high-efficiency storage systems.
In-Depth Natural Gas Storage Industry Market Outlook
The natural gas storage industry is poised for continued growth in the coming years, driven by increasing energy demand, the expansion of renewable energy sources, and advancements in storage technologies. Strategic partnerships, technological innovations, and investments in infrastructure will play a pivotal role in shaping the future of this sector. Significant opportunities exist for companies to capitalize on the expanding market by investing in new technologies, expanding their storage capacity, and focusing on enhancing operational efficiency and sustainability.
Natural Gas Storage Industry Segmentation
-
1. Type
- 1.1. Underground Storage
- 1.2. Above-Ground Storage
Natural Gas Storage Industry Segmentation By Geography
- 1. North America
- 2. Europe
- 3. Asia Pacific
- 4. South America
- 5. Middle East and Africa
Natural Gas Storage Industry REPORT HIGHLIGHTS
| Aspects | Details |
|---|---|
| Study Period | 2019-2033 |
| Base Year | 2024 |
| Estimated Year | 2025 |
| Forecast Period | 2025-2033 |
| Historical Period | 2019-2024 |
| Growth Rate | CAGR of > 3.50% from 2019-2033 |
| Segmentation |
|
Table of Contents
- 1. Introduction
- 1.1. Research Scope
- 1.2. Market Segmentation
- 1.3. Research Methodology
- 1.4. Definitions and Assumptions
- 2. Executive Summary
- 2.1. Introduction
- 3. Market Dynamics
- 3.1. Introduction
- 3.2. Market Drivers
- 3.2.1. 4.; Increasing Electricity Demand4.; Rsing Investments in the Coal Industry
- 3.3. Market Restrains
- 3.3.1. 4.; Increasing Installation of Renewable Energy Sources
- 3.4. Market Trends
- 3.4.1. Underground Storage to Dominate the Market
- 4. Market Factor Analysis
- 4.1. Porters Five Forces
- 4.2. Supply/Value Chain
- 4.3. PESTEL analysis
- 4.4. Market Entropy
- 4.5. Patent/Trademark Analysis
- 5. Global Natural Gas Storage Industry Analysis, Insights and Forecast, 2019-2031
- 5.1. Market Analysis, Insights and Forecast - by Type
- 5.1.1. Underground Storage
- 5.1.2. Above-Ground Storage
- 5.2. Market Analysis, Insights and Forecast - by Region
- 5.2.1. North America
- 5.2.2. Europe
- 5.2.3. Asia Pacific
- 5.2.4. South America
- 5.2.5. Middle East and Africa
- 5.1. Market Analysis, Insights and Forecast - by Type
- 6. North America Natural Gas Storage Industry Analysis, Insights and Forecast, 2019-2031
- 6.1. Market Analysis, Insights and Forecast - by Type
- 6.1.1. Underground Storage
- 6.1.2. Above-Ground Storage
- 6.1. Market Analysis, Insights and Forecast - by Type
- 7. Europe Natural Gas Storage Industry Analysis, Insights and Forecast, 2019-2031
- 7.1. Market Analysis, Insights and Forecast - by Type
- 7.1.1. Underground Storage
- 7.1.2. Above-Ground Storage
- 7.1. Market Analysis, Insights and Forecast - by Type
- 8. Asia Pacific Natural Gas Storage Industry Analysis, Insights and Forecast, 2019-2031
- 8.1. Market Analysis, Insights and Forecast - by Type
- 8.1.1. Underground Storage
- 8.1.2. Above-Ground Storage
- 8.1. Market Analysis, Insights and Forecast - by Type
- 9. South America Natural Gas Storage Industry Analysis, Insights and Forecast, 2019-2031
- 9.1. Market Analysis, Insights and Forecast - by Type
- 9.1.1. Underground Storage
- 9.1.2. Above-Ground Storage
- 9.1. Market Analysis, Insights and Forecast - by Type
- 10. Middle East and Africa Natural Gas Storage Industry Analysis, Insights and Forecast, 2019-2031
- 10.1. Market Analysis, Insights and Forecast - by Type
- 10.1.1. Underground Storage
- 10.1.2. Above-Ground Storage
- 10.1. Market Analysis, Insights and Forecast - by Type
- 11. North America Natural Gas Storage Industry Analysis, Insights and Forecast, 2019-2031
- 11.1. Market Analysis, Insights and Forecast - By Country/Sub-region
- 11.1.1 United States
- 11.1.2 Canada
- 11.1.3 Mexico
- 12. Europe Natural Gas Storage Industry Analysis, Insights and Forecast, 2019-2031
- 12.1. Market Analysis, Insights and Forecast - By Country/Sub-region
- 12.1.1 Germany
- 12.1.2 United Kingdom
- 12.1.3 France
- 12.1.4 Spain
- 12.1.5 Italy
- 12.1.6 Spain
- 12.1.7 Belgium
- 12.1.8 Netherland
- 12.1.9 Nordics
- 12.1.10 Rest of Europe
- 13. Asia Pacific Natural Gas Storage Industry Analysis, Insights and Forecast, 2019-2031
- 13.1. Market Analysis, Insights and Forecast - By Country/Sub-region
- 13.1.1 China
- 13.1.2 Japan
- 13.1.3 India
- 13.1.4 South Korea
- 13.1.5 Southeast Asia
- 13.1.6 Australia
- 13.1.7 Indonesia
- 13.1.8 Phillipes
- 13.1.9 Singapore
- 13.1.10 Thailandc
- 13.1.11 Rest of Asia Pacific
- 14. South America Natural Gas Storage Industry Analysis, Insights and Forecast, 2019-2031
- 14.1. Market Analysis, Insights and Forecast - By Country/Sub-region
- 14.1.1 Brazil
- 14.1.2 Argentina
- 14.1.3 Peru
- 14.1.4 Chile
- 14.1.5 Colombia
- 14.1.6 Ecuador
- 14.1.7 Venezuela
- 14.1.8 Rest of South America
- 15. North America Natural Gas Storage Industry Analysis, Insights and Forecast, 2019-2031
- 15.1. Market Analysis, Insights and Forecast - By Country/Sub-region
- 15.1.1 United States
- 15.1.2 Canada
- 15.1.3 Mexico
- 16. MEA Natural Gas Storage Industry Analysis, Insights and Forecast, 2019-2031
- 16.1. Market Analysis, Insights and Forecast - By Country/Sub-region
- 16.1.1 United Arab Emirates
- 16.1.2 Saudi Arabia
- 16.1.3 South Africa
- 16.1.4 Rest of Middle East and Africa
- 17. Competitive Analysis
- 17.1. Global Market Share Analysis 2024
- 17.2. Company Profiles
- 17.2.1 Engie SA
- 17.2.1.1. Overview
- 17.2.1.2. Products
- 17.2.1.3. SWOT Analysis
- 17.2.1.4. Recent Developments
- 17.2.1.5. Financials (Based on Availability)
- 17.2.2 NAFTA a s
- 17.2.2.1. Overview
- 17.2.2.2. Products
- 17.2.2.3. SWOT Analysis
- 17.2.2.4. Recent Developments
- 17.2.2.5. Financials (Based on Availability)
- 17.2.3 China National Petroleum Corporation
- 17.2.3.1. Overview
- 17.2.3.2. Products
- 17.2.3.3. SWOT Analysis
- 17.2.3.4. Recent Developments
- 17.2.3.5. Financials (Based on Availability)
- 17.2.4 Uniper SE*List Not Exhaustive
- 17.2.4.1. Overview
- 17.2.4.2. Products
- 17.2.4.3. SWOT Analysis
- 17.2.4.4. Recent Developments
- 17.2.4.5. Financials (Based on Availability)
- 17.2.5 Koninklijke Vopak N V
- 17.2.5.1. Overview
- 17.2.5.2. Products
- 17.2.5.3. SWOT Analysis
- 17.2.5.4. Recent Developments
- 17.2.5.5. Financials (Based on Availability)
- 17.2.6 Enbridge Inc
- 17.2.6.1. Overview
- 17.2.6.2. Products
- 17.2.6.3. SWOT Analysis
- 17.2.6.4. Recent Developments
- 17.2.6.5. Financials (Based on Availability)
- 17.2.7 Chiyoda Corporation
- 17.2.7.1. Overview
- 17.2.7.2. Products
- 17.2.7.3. SWOT Analysis
- 17.2.7.4. Recent Developments
- 17.2.7.5. Financials (Based on Availability)
- 17.2.8 John Wood Group PLC
- 17.2.8.1. Overview
- 17.2.8.2. Products
- 17.2.8.3. SWOT Analysis
- 17.2.8.4. Recent Developments
- 17.2.8.5. Financials (Based on Availability)
- 17.2.9 Gazprom PAO
- 17.2.9.1. Overview
- 17.2.9.2. Products
- 17.2.9.3. SWOT Analysis
- 17.2.9.4. Recent Developments
- 17.2.9.5. Financials (Based on Availability)
- 17.2.10 Costain Group PLC
- 17.2.10.1. Overview
- 17.2.10.2. Products
- 17.2.10.3. SWOT Analysis
- 17.2.10.4. Recent Developments
- 17.2.10.5. Financials (Based on Availability)
- 17.2.1 Engie SA
List of Figures
- Figure 1: Global Natural Gas Storage Industry Revenue Breakdown (Million, %) by Region 2024 & 2032
- Figure 2: Global Natural Gas Storage Industry Volume Breakdown (K Tons, %) by Region 2024 & 2032
- Figure 3: North America Natural Gas Storage Industry Revenue (Million), by Country 2024 & 2032
- Figure 4: North America Natural Gas Storage Industry Volume (K Tons), by Country 2024 & 2032
- Figure 5: North America Natural Gas Storage Industry Revenue Share (%), by Country 2024 & 2032
- Figure 6: North America Natural Gas Storage Industry Volume Share (%), by Country 2024 & 2032
- Figure 7: Europe Natural Gas Storage Industry Revenue (Million), by Country 2024 & 2032
- Figure 8: Europe Natural Gas Storage Industry Volume (K Tons), by Country 2024 & 2032
- Figure 9: Europe Natural Gas Storage Industry Revenue Share (%), by Country 2024 & 2032
- Figure 10: Europe Natural Gas Storage Industry Volume Share (%), by Country 2024 & 2032
- Figure 11: Asia Pacific Natural Gas Storage Industry Revenue (Million), by Country 2024 & 2032
- Figure 12: Asia Pacific Natural Gas Storage Industry Volume (K Tons), by Country 2024 & 2032
- Figure 13: Asia Pacific Natural Gas Storage Industry Revenue Share (%), by Country 2024 & 2032
- Figure 14: Asia Pacific Natural Gas Storage Industry Volume Share (%), by Country 2024 & 2032
- Figure 15: South America Natural Gas Storage Industry Revenue (Million), by Country 2024 & 2032
- Figure 16: South America Natural Gas Storage Industry Volume (K Tons), by Country 2024 & 2032
- Figure 17: South America Natural Gas Storage Industry Revenue Share (%), by Country 2024 & 2032
- Figure 18: South America Natural Gas Storage Industry Volume Share (%), by Country 2024 & 2032
- Figure 19: North America Natural Gas Storage Industry Revenue (Million), by Country 2024 & 2032
- Figure 20: North America Natural Gas Storage Industry Volume (K Tons), by Country 2024 & 2032
- Figure 21: North America Natural Gas Storage Industry Revenue Share (%), by Country 2024 & 2032
- Figure 22: North America Natural Gas Storage Industry Volume Share (%), by Country 2024 & 2032
- Figure 23: MEA Natural Gas Storage Industry Revenue (Million), by Country 2024 & 2032
- Figure 24: MEA Natural Gas Storage Industry Volume (K Tons), by Country 2024 & 2032
- Figure 25: MEA Natural Gas Storage Industry Revenue Share (%), by Country 2024 & 2032
- Figure 26: MEA Natural Gas Storage Industry Volume Share (%), by Country 2024 & 2032
- Figure 27: North America Natural Gas Storage Industry Revenue (Million), by Type 2024 & 2032
- Figure 28: North America Natural Gas Storage Industry Volume (K Tons), by Type 2024 & 2032
- Figure 29: North America Natural Gas Storage Industry Revenue Share (%), by Type 2024 & 2032
- Figure 30: North America Natural Gas Storage Industry Volume Share (%), by Type 2024 & 2032
- Figure 31: North America Natural Gas Storage Industry Revenue (Million), by Country 2024 & 2032
- Figure 32: North America Natural Gas Storage Industry Volume (K Tons), by Country 2024 & 2032
- Figure 33: North America Natural Gas Storage Industry Revenue Share (%), by Country 2024 & 2032
- Figure 34: North America Natural Gas Storage Industry Volume Share (%), by Country 2024 & 2032
- Figure 35: Europe Natural Gas Storage Industry Revenue (Million), by Type 2024 & 2032
- Figure 36: Europe Natural Gas Storage Industry Volume (K Tons), by Type 2024 & 2032
- Figure 37: Europe Natural Gas Storage Industry Revenue Share (%), by Type 2024 & 2032
- Figure 38: Europe Natural Gas Storage Industry Volume Share (%), by Type 2024 & 2032
- Figure 39: Europe Natural Gas Storage Industry Revenue (Million), by Country 2024 & 2032
- Figure 40: Europe Natural Gas Storage Industry Volume (K Tons), by Country 2024 & 2032
- Figure 41: Europe Natural Gas Storage Industry Revenue Share (%), by Country 2024 & 2032
- Figure 42: Europe Natural Gas Storage Industry Volume Share (%), by Country 2024 & 2032
- Figure 43: Asia Pacific Natural Gas Storage Industry Revenue (Million), by Type 2024 & 2032
- Figure 44: Asia Pacific Natural Gas Storage Industry Volume (K Tons), by Type 2024 & 2032
- Figure 45: Asia Pacific Natural Gas Storage Industry Revenue Share (%), by Type 2024 & 2032
- Figure 46: Asia Pacific Natural Gas Storage Industry Volume Share (%), by Type 2024 & 2032
- Figure 47: Asia Pacific Natural Gas Storage Industry Revenue (Million), by Country 2024 & 2032
- Figure 48: Asia Pacific Natural Gas Storage Industry Volume (K Tons), by Country 2024 & 2032
- Figure 49: Asia Pacific Natural Gas Storage Industry Revenue Share (%), by Country 2024 & 2032
- Figure 50: Asia Pacific Natural Gas Storage Industry Volume Share (%), by Country 2024 & 2032
- Figure 51: South America Natural Gas Storage Industry Revenue (Million), by Type 2024 & 2032
- Figure 52: South America Natural Gas Storage Industry Volume (K Tons), by Type 2024 & 2032
- Figure 53: South America Natural Gas Storage Industry Revenue Share (%), by Type 2024 & 2032
- Figure 54: South America Natural Gas Storage Industry Volume Share (%), by Type 2024 & 2032
- Figure 55: South America Natural Gas Storage Industry Revenue (Million), by Country 2024 & 2032
- Figure 56: South America Natural Gas Storage Industry Volume (K Tons), by Country 2024 & 2032
- Figure 57: South America Natural Gas Storage Industry Revenue Share (%), by Country 2024 & 2032
- Figure 58: South America Natural Gas Storage Industry Volume Share (%), by Country 2024 & 2032
- Figure 59: Middle East and Africa Natural Gas Storage Industry Revenue (Million), by Type 2024 & 2032
- Figure 60: Middle East and Africa Natural Gas Storage Industry Volume (K Tons), by Type 2024 & 2032
- Figure 61: Middle East and Africa Natural Gas Storage Industry Revenue Share (%), by Type 2024 & 2032
- Figure 62: Middle East and Africa Natural Gas Storage Industry Volume Share (%), by Type 2024 & 2032
- Figure 63: Middle East and Africa Natural Gas Storage Industry Revenue (Million), by Country 2024 & 2032
- Figure 64: Middle East and Africa Natural Gas Storage Industry Volume (K Tons), by Country 2024 & 2032
- Figure 65: Middle East and Africa Natural Gas Storage Industry Revenue Share (%), by Country 2024 & 2032
- Figure 66: Middle East and Africa Natural Gas Storage Industry Volume Share (%), by Country 2024 & 2032
List of Tables
- Table 1: Global Natural Gas Storage Industry Revenue Million Forecast, by Region 2019 & 2032
- Table 2: Global Natural Gas Storage Industry Volume K Tons Forecast, by Region 2019 & 2032
- Table 3: Global Natural Gas Storage Industry Revenue Million Forecast, by Type 2019 & 2032
- Table 4: Global Natural Gas Storage Industry Volume K Tons Forecast, by Type 2019 & 2032
- Table 5: Global Natural Gas Storage Industry Revenue Million Forecast, by Region 2019 & 2032
- Table 6: Global Natural Gas Storage Industry Volume K Tons Forecast, by Region 2019 & 2032
- Table 7: Global Natural Gas Storage Industry Revenue Million Forecast, by Country 2019 & 2032
- Table 8: Global Natural Gas Storage Industry Volume K Tons Forecast, by Country 2019 & 2032
- Table 9: United States Natural Gas Storage Industry Revenue (Million) Forecast, by Application 2019 & 2032
- Table 10: United States Natural Gas Storage Industry Volume (K Tons) Forecast, by Application 2019 & 2032
- Table 11: Canada Natural Gas Storage Industry Revenue (Million) Forecast, by Application 2019 & 2032
- Table 12: Canada Natural Gas Storage Industry Volume (K Tons) Forecast, by Application 2019 & 2032
- Table 13: Mexico Natural Gas Storage Industry Revenue (Million) Forecast, by Application 2019 & 2032
- Table 14: Mexico Natural Gas Storage Industry Volume (K Tons) Forecast, by Application 2019 & 2032
- Table 15: Global Natural Gas Storage Industry Revenue Million Forecast, by Country 2019 & 2032
- Table 16: Global Natural Gas Storage Industry Volume K Tons Forecast, by Country 2019 & 2032
- Table 17: Germany Natural Gas Storage Industry Revenue (Million) Forecast, by Application 2019 & 2032
- Table 18: Germany Natural Gas Storage Industry Volume (K Tons) Forecast, by Application 2019 & 2032
- Table 19: United Kingdom Natural Gas Storage Industry Revenue (Million) Forecast, by Application 2019 & 2032
- Table 20: United Kingdom Natural Gas Storage Industry Volume (K Tons) Forecast, by Application 2019 & 2032
- Table 21: France Natural Gas Storage Industry Revenue (Million) Forecast, by Application 2019 & 2032
- Table 22: France Natural Gas Storage Industry Volume (K Tons) Forecast, by Application 2019 & 2032
- Table 23: Spain Natural Gas Storage Industry Revenue (Million) Forecast, by Application 2019 & 2032
- Table 24: Spain Natural Gas Storage Industry Volume (K Tons) Forecast, by Application 2019 & 2032
- Table 25: Italy Natural Gas Storage Industry Revenue (Million) Forecast, by Application 2019 & 2032
- Table 26: Italy Natural Gas Storage Industry Volume (K Tons) Forecast, by Application 2019 & 2032
- Table 27: Spain Natural Gas Storage Industry Revenue (Million) Forecast, by Application 2019 & 2032
- Table 28: Spain Natural Gas Storage Industry Volume (K Tons) Forecast, by Application 2019 & 2032
- Table 29: Belgium Natural Gas Storage Industry Revenue (Million) Forecast, by Application 2019 & 2032
- Table 30: Belgium Natural Gas Storage Industry Volume (K Tons) Forecast, by Application 2019 & 2032
- Table 31: Netherland Natural Gas Storage Industry Revenue (Million) Forecast, by Application 2019 & 2032
- Table 32: Netherland Natural Gas Storage Industry Volume (K Tons) Forecast, by Application 2019 & 2032
- Table 33: Nordics Natural Gas Storage Industry Revenue (Million) Forecast, by Application 2019 & 2032
- Table 34: Nordics Natural Gas Storage Industry Volume (K Tons) Forecast, by Application 2019 & 2032
- Table 35: Rest of Europe Natural Gas Storage Industry Revenue (Million) Forecast, by Application 2019 & 2032
- Table 36: Rest of Europe Natural Gas Storage Industry Volume (K Tons) Forecast, by Application 2019 & 2032
- Table 37: Global Natural Gas Storage Industry Revenue Million Forecast, by Country 2019 & 2032
- Table 38: Global Natural Gas Storage Industry Volume K Tons Forecast, by Country 2019 & 2032
- Table 39: China Natural Gas Storage Industry Revenue (Million) Forecast, by Application 2019 & 2032
- Table 40: China Natural Gas Storage Industry Volume (K Tons) Forecast, by Application 2019 & 2032
- Table 41: Japan Natural Gas Storage Industry Revenue (Million) Forecast, by Application 2019 & 2032
- Table 42: Japan Natural Gas Storage Industry Volume (K Tons) Forecast, by Application 2019 & 2032
- Table 43: India Natural Gas Storage Industry Revenue (Million) Forecast, by Application 2019 & 2032
- Table 44: India Natural Gas Storage Industry Volume (K Tons) Forecast, by Application 2019 & 2032
- Table 45: South Korea Natural Gas Storage Industry Revenue (Million) Forecast, by Application 2019 & 2032
- Table 46: South Korea Natural Gas Storage Industry Volume (K Tons) Forecast, by Application 2019 & 2032
- Table 47: Southeast Asia Natural Gas Storage Industry Revenue (Million) Forecast, by Application 2019 & 2032
- Table 48: Southeast Asia Natural Gas Storage Industry Volume (K Tons) Forecast, by Application 2019 & 2032
- Table 49: Australia Natural Gas Storage Industry Revenue (Million) Forecast, by Application 2019 & 2032
- Table 50: Australia Natural Gas Storage Industry Volume (K Tons) Forecast, by Application 2019 & 2032
- Table 51: Indonesia Natural Gas Storage Industry Revenue (Million) Forecast, by Application 2019 & 2032
- Table 52: Indonesia Natural Gas Storage Industry Volume (K Tons) Forecast, by Application 2019 & 2032
- Table 53: Phillipes Natural Gas Storage Industry Revenue (Million) Forecast, by Application 2019 & 2032
- Table 54: Phillipes Natural Gas Storage Industry Volume (K Tons) Forecast, by Application 2019 & 2032
- Table 55: Singapore Natural Gas Storage Industry Revenue (Million) Forecast, by Application 2019 & 2032
- Table 56: Singapore Natural Gas Storage Industry Volume (K Tons) Forecast, by Application 2019 & 2032
- Table 57: Thailandc Natural Gas Storage Industry Revenue (Million) Forecast, by Application 2019 & 2032
- Table 58: Thailandc Natural Gas Storage Industry Volume (K Tons) Forecast, by Application 2019 & 2032
- Table 59: Rest of Asia Pacific Natural Gas Storage Industry Revenue (Million) Forecast, by Application 2019 & 2032
- Table 60: Rest of Asia Pacific Natural Gas Storage Industry Volume (K Tons) Forecast, by Application 2019 & 2032
- Table 61: Global Natural Gas Storage Industry Revenue Million Forecast, by Country 2019 & 2032
- Table 62: Global Natural Gas Storage Industry Volume K Tons Forecast, by Country 2019 & 2032
- Table 63: Brazil Natural Gas Storage Industry Revenue (Million) Forecast, by Application 2019 & 2032
- Table 64: Brazil Natural Gas Storage Industry Volume (K Tons) Forecast, by Application 2019 & 2032
- Table 65: Argentina Natural Gas Storage Industry Revenue (Million) Forecast, by Application 2019 & 2032
- Table 66: Argentina Natural Gas Storage Industry Volume (K Tons) Forecast, by Application 2019 & 2032
- Table 67: Peru Natural Gas Storage Industry Revenue (Million) Forecast, by Application 2019 & 2032
- Table 68: Peru Natural Gas Storage Industry Volume (K Tons) Forecast, by Application 2019 & 2032
- Table 69: Chile Natural Gas Storage Industry Revenue (Million) Forecast, by Application 2019 & 2032
- Table 70: Chile Natural Gas Storage Industry Volume (K Tons) Forecast, by Application 2019 & 2032
- Table 71: Colombia Natural Gas Storage Industry Revenue (Million) Forecast, by Application 2019 & 2032
- Table 72: Colombia Natural Gas Storage Industry Volume (K Tons) Forecast, by Application 2019 & 2032
- Table 73: Ecuador Natural Gas Storage Industry Revenue (Million) Forecast, by Application 2019 & 2032
- Table 74: Ecuador Natural Gas Storage Industry Volume (K Tons) Forecast, by Application 2019 & 2032
- Table 75: Venezuela Natural Gas Storage Industry Revenue (Million) Forecast, by Application 2019 & 2032
- Table 76: Venezuela Natural Gas Storage Industry Volume (K Tons) Forecast, by Application 2019 & 2032
- Table 77: Rest of South America Natural Gas Storage Industry Revenue (Million) Forecast, by Application 2019 & 2032
- Table 78: Rest of South America Natural Gas Storage Industry Volume (K Tons) Forecast, by Application 2019 & 2032
- Table 79: Global Natural Gas Storage Industry Revenue Million Forecast, by Country 2019 & 2032
- Table 80: Global Natural Gas Storage Industry Volume K Tons Forecast, by Country 2019 & 2032
- Table 81: United States Natural Gas Storage Industry Revenue (Million) Forecast, by Application 2019 & 2032
- Table 82: United States Natural Gas Storage Industry Volume (K Tons) Forecast, by Application 2019 & 2032
- Table 83: Canada Natural Gas Storage Industry Revenue (Million) Forecast, by Application 2019 & 2032
- Table 84: Canada Natural Gas Storage Industry Volume (K Tons) Forecast, by Application 2019 & 2032
- Table 85: Mexico Natural Gas Storage Industry Revenue (Million) Forecast, by Application 2019 & 2032
- Table 86: Mexico Natural Gas Storage Industry Volume (K Tons) Forecast, by Application 2019 & 2032
- Table 87: Global Natural Gas Storage Industry Revenue Million Forecast, by Country 2019 & 2032
- Table 88: Global Natural Gas Storage Industry Volume K Tons Forecast, by Country 2019 & 2032
- Table 89: United Arab Emirates Natural Gas Storage Industry Revenue (Million) Forecast, by Application 2019 & 2032
- Table 90: United Arab Emirates Natural Gas Storage Industry Volume (K Tons) Forecast, by Application 2019 & 2032
- Table 91: Saudi Arabia Natural Gas Storage Industry Revenue (Million) Forecast, by Application 2019 & 2032
- Table 92: Saudi Arabia Natural Gas Storage Industry Volume (K Tons) Forecast, by Application 2019 & 2032
- Table 93: South Africa Natural Gas Storage Industry Revenue (Million) Forecast, by Application 2019 & 2032
- Table 94: South Africa Natural Gas Storage Industry Volume (K Tons) Forecast, by Application 2019 & 2032
- Table 95: Rest of Middle East and Africa Natural Gas Storage Industry Revenue (Million) Forecast, by Application 2019 & 2032
- Table 96: Rest of Middle East and Africa Natural Gas Storage Industry Volume (K Tons) Forecast, by Application 2019 & 2032
- Table 97: Global Natural Gas Storage Industry Revenue Million Forecast, by Type 2019 & 2032
- Table 98: Global Natural Gas Storage Industry Volume K Tons Forecast, by Type 2019 & 2032
- Table 99: Global Natural Gas Storage Industry Revenue Million Forecast, by Country 2019 & 2032
- Table 100: Global Natural Gas Storage Industry Volume K Tons Forecast, by Country 2019 & 2032
- Table 101: Global Natural Gas Storage Industry Revenue Million Forecast, by Type 2019 & 2032
- Table 102: Global Natural Gas Storage Industry Volume K Tons Forecast, by Type 2019 & 2032
- Table 103: Global Natural Gas Storage Industry Revenue Million Forecast, by Country 2019 & 2032
- Table 104: Global Natural Gas Storage Industry Volume K Tons Forecast, by Country 2019 & 2032
- Table 105: Global Natural Gas Storage Industry Revenue Million Forecast, by Type 2019 & 2032
- Table 106: Global Natural Gas Storage Industry Volume K Tons Forecast, by Type 2019 & 2032
- Table 107: Global Natural Gas Storage Industry Revenue Million Forecast, by Country 2019 & 2032
- Table 108: Global Natural Gas Storage Industry Volume K Tons Forecast, by Country 2019 & 2032
- Table 109: Global Natural Gas Storage Industry Revenue Million Forecast, by Type 2019 & 2032
- Table 110: Global Natural Gas Storage Industry Volume K Tons Forecast, by Type 2019 & 2032
- Table 111: Global Natural Gas Storage Industry Revenue Million Forecast, by Country 2019 & 2032
- Table 112: Global Natural Gas Storage Industry Volume K Tons Forecast, by Country 2019 & 2032
- Table 113: Global Natural Gas Storage Industry Revenue Million Forecast, by Type 2019 & 2032
- Table 114: Global Natural Gas Storage Industry Volume K Tons Forecast, by Type 2019 & 2032
- Table 115: Global Natural Gas Storage Industry Revenue Million Forecast, by Country 2019 & 2032
- Table 116: Global Natural Gas Storage Industry Volume K Tons Forecast, by Country 2019 & 2032
Frequently Asked Questions
1. What is the projected Compound Annual Growth Rate (CAGR) of the Natural Gas Storage Industry?
The projected CAGR is approximately > 3.50%.
2. Which companies are prominent players in the Natural Gas Storage Industry?
Key companies in the market include Engie SA, NAFTA a s, China National Petroleum Corporation, Uniper SE*List Not Exhaustive, Koninklijke Vopak N V, Enbridge Inc, Chiyoda Corporation, John Wood Group PLC, Gazprom PAO, Costain Group PLC.
3. What are the main segments of the Natural Gas Storage Industry?
The market segments include Type.
4. Can you provide details about the market size?
The market size is estimated to be USD 14940 Million as of 2022.
5. What are some drivers contributing to market growth?
4.; Increasing Electricity Demand4.; Rsing Investments in the Coal Industry.
6. What are the notable trends driving market growth?
Underground Storage to Dominate the Market.
7. Are there any restraints impacting market growth?
4.; Increasing Installation of Renewable Energy Sources.
8. Can you provide examples of recent developments in the market?
Technological innovations in storage systems
9. What pricing options are available for accessing the report?
Pricing options include single-user, multi-user, and enterprise licenses priced at USD 4750, USD 5250, and USD 8750 respectively.
10. Is the market size provided in terms of value or volume?
The market size is provided in terms of value, measured in Million and volume, measured in K Tons.
11. Are there any specific market keywords associated with the report?
Yes, the market keyword associated with the report is "Natural Gas Storage Industry," which aids in identifying and referencing the specific market segment covered.
12. How do I determine which pricing option suits my needs best?
The pricing options vary based on user requirements and access needs. Individual users may opt for single-user licenses, while businesses requiring broader access may choose multi-user or enterprise licenses for cost-effective access to the report.
13. Are there any additional resources or data provided in the Natural Gas Storage Industry report?
While the report offers comprehensive insights, it's advisable to review the specific contents or supplementary materials provided to ascertain if additional resources or data are available.
14. How can I stay updated on further developments or reports in the Natural Gas Storage Industry?
To stay informed about further developments, trends, and reports in the Natural Gas Storage Industry, consider subscribing to industry newsletters, following relevant companies and organizations, or regularly checking reputable industry news sources and publications.
Methodology
Step 1 - Identification of Relevant Samples Size from Population Database


Step 2 - Approaches for Defining Global Market Size (Value, Volume* & Price*)

Note*: In applicable scenarios
Step 3 - Data Sources
Primary Research
- Web Analytics
- Survey Reports
- Research Institute
- Latest Research Reports
- Opinion Leaders
Secondary Research
- Annual Reports
- White Paper
- Latest Press Release
- Industry Association
- Paid Database
- Investor Presentations

Step 4 - Data Triangulation
Involves using different sources of information in order to increase the validity of a study
These sources are likely to be stakeholders in a program - participants, other researchers, program staff, other community members, and so on.
Then we put all data in single framework & apply various statistical tools to find out the dynamic on the market.
During the analysis stage, feedback from the stakeholder groups would be compared to determine areas of agreement as well as areas of divergence
