

Key Insights
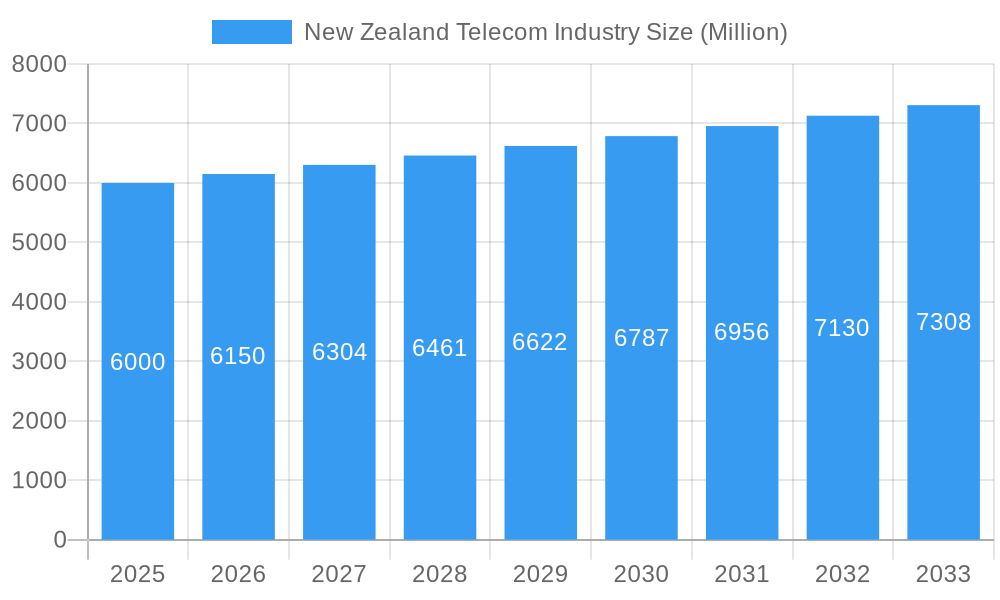
The New Zealand telecommunications market, valued at approximately NZD 6 billion in 2025, is projected for sustained growth. Driven by increasing demand for high-speed data, expanding 5G infrastructure, and the rising adoption of smartphones and smart devices, the market is expected to achieve a Compound Annual Growth Rate (CAGR) of 2.5% from 2025 to 2033. Key trends include the adoption of bundled services, the growing influence of Over-The-Top (OTT) platforms, and a strong emphasis on cybersecurity. Despite market size limitations and intense competition from major players like Spark, Vodafone, and 2degrees, ongoing infrastructure investments and service innovation are poised to drive market expansion. The industry is segmented into voice services, wireless data and messaging, and OTT and Pay-TV services, with wireless data experiencing the most significant growth.
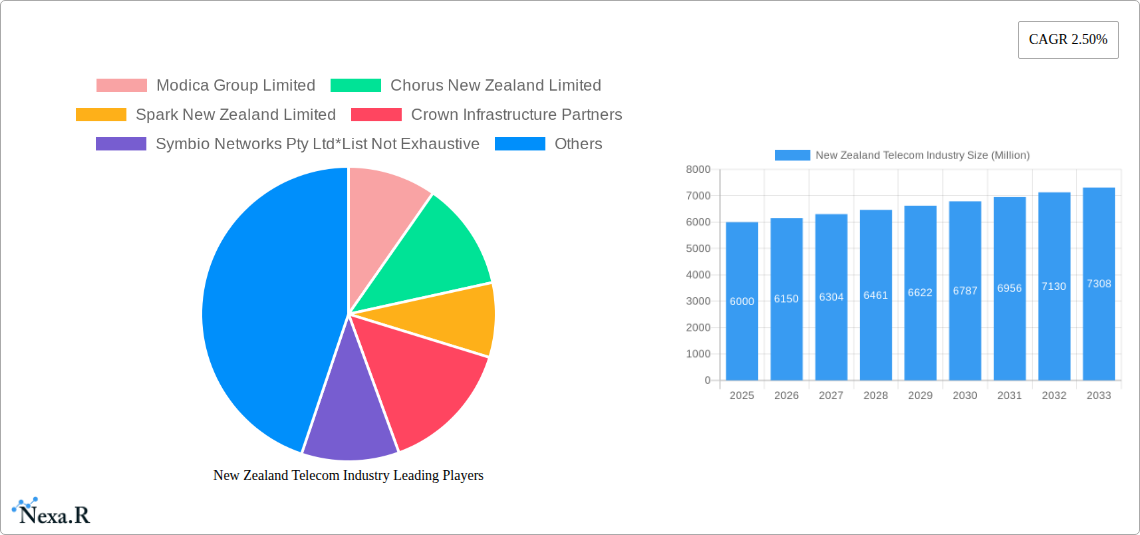
New Zealand Telecom Industry Market Size (In Billion)
The competitive landscape features established leaders Spark, Vodafone, and 2degrees, alongside infrastructure providers like Chorus and specialized fiber companies. Government initiatives supporting digital infrastructure development further bolster the sector. Future growth hinges on strategic network modernization, adaptable regulatory navigation, and innovative value propositions. Technological advancements, including 5G rollout and emerging technologies, will significantly shape the New Zealand telecommunications market's trajectory.
New Zealand Telecom Industry Company Market Share
New Zealand Telecom Industry Report: 2019-2033
This comprehensive report provides an in-depth analysis of the New Zealand telecom industry, covering market dynamics, growth trends, key players, and future outlook. With a focus on the parent market (Telecommunications) and child markets (Voice Services, Wireless Data & Messaging, OTT & Pay-TV), this report is essential for industry professionals, investors, and strategic planners. The study period spans 2019-2033, with a base year of 2025 and a forecast period of 2025-2033. Market values are presented in millions of units (NZD).
New Zealand Telecom Industry Market Dynamics & Structure
This section analyzes the competitive landscape, regulatory environment, and technological advancements shaping the New Zealand telecom market. The market exhibits moderate concentration, with key players like Spark New Zealand Limited and Vodafone New Zealand Limited holding significant market share. However, the emergence of smaller players like Tuatahi First Fibre and Compass NZ is increasing competition. The regulatory framework, while supportive of infrastructure development, also poses challenges in balancing competition and consumer protection.
- Market Concentration: Spark and Vodafone dominate, holding a combined xx% market share (2024 estimate). Chorus plays a crucial role in infrastructure.
- Technological Innovation: 5G and 6G deployments are key drivers, alongside fiber optic network expansion. Barriers include high infrastructure costs and spectrum allocation.
- Regulatory Framework: The Commerce Commission plays a significant role, regulating pricing and competition. Recent policy focuses on infrastructure investment and rural broadband expansion.
- Competitive Substitutes: Over-the-top (OTT) services pose a significant challenge to traditional telecom providers.
- M&A Trends: Consolidation is expected to continue, driven by the need for scale and investment in advanced technologies. The number of M&A deals in the last 5 years totaled xx.
- End-User Demographics: High internet penetration, coupled with increasing mobile usage, drives demand for data-intensive services. The aging population presents both challenges and opportunities.
New Zealand Telecom Industry Growth Trends & Insights
The New Zealand telecom market exhibits consistent growth, driven by increasing mobile and broadband adoption. The market size reached NZD xx million in 2024 and is projected to reach NZD xx million by 2033, exhibiting a CAGR of xx% during the forecast period. Technological disruptions, such as the rollout of 5G, are accelerating growth. Consumer behavior is shifting towards data-heavy services, favoring bundled packages and unlimited plans. The market is witnessing increased demand for high-speed internet and mobile data, particularly in urban areas. The increasing penetration of smart devices further fuels demand for mobile data services. The shift towards cloud-based services and the rise of IoT also contribute to the market's growth. Rural broadband expansion remains a key focus, with ongoing government initiatives aiming to bridge the digital divide.
Dominant Regions, Countries, or Segments in New Zealand Telecom Industry
The New Zealand telecommunications market is primarily concentrated in its major metropolitan hubs, including Auckland, Wellington, and Christchurch. These urban centers, with their higher population densities and more developed infrastructure, represent the core of market activity. The fastest-growing segment is unequivocally Wireless: Data and Messaging Services. This surge is directly attributable to the widespread adoption of smartphones and the ever-increasing demand for data-intensive applications and high-speed internet access.
- Wireless: Data & Messaging: This segment is projected for robust growth, with a market size of NZD [Insert Value] million in 2024, anticipated to expand to NZD [Insert Value] million by 2033. The Average Revenue Per User (ARPU) stands at NZD [Insert Value]. Key growth catalysts include the continued upward trend in smartphone penetration and the escalating demand for seamless, high-speed internet connectivity across the nation.
- Voice Services: While historically a dominant segment, Voice Services are expected to experience a gradual decline. The market size was NZD [Insert Value] million in 2024, with a projected decrease due to the increasing popularity of Over-The-Top (OTT) communication platforms. The ARPU for this segment is NZD [Insert Value].
- OTT and Pay-TV Services: This segment is demonstrating consistent growth, with a market size of NZD [Insert Value] million in 2024. The expansion is driven by the burgeoning consumer appetite for streaming services and on-demand video content. The ARPU for OTT and Pay-TV services is NZD [Insert Value].
New Zealand Telecom Industry Product Landscape
The product landscape within the New Zealand telecommunications industry is characterized by its breadth and depth, encompassing a comprehensive array of services. These include essential mobile voice and data plans, robust fixed-line broadband solutions, and integrated, value-added bundled packages designed to meet diverse consumer and business needs. Innovation is a constant theme, with a strong focus on enhancing network speeds, extending coverage to previously underserved areas, and elevating the overall customer experience. Key technological advancements such as the widespread deployment of 5G and the continued expansion of fiber optic networks are pivotal, delivering unparalleled speeds and significantly increased network capacity. Competitive strategies are multifaceted, featuring highly customized data packages, attractive bundled service offerings, and the integration of value-added features like popular streaming service subscriptions.
Key Drivers, Barriers & Challenges in New Zealand Telecom Industry
Key Drivers:
- Significant and ongoing government investments in developing and upgrading broadband infrastructure across the country.
- The continuous rise in smartphone penetration rates and the corresponding surge in mobile data consumption.
- A growing and persistent demand for high-speed, reliable internet services from both residential and commercial users.
Barriers & Challenges:
- The substantial capital investment required for network modernization, particularly for the rollout of advanced technologies like 5G.
- Intensified competition from Over-The-Top (OTT) service providers, which can erode traditional revenue streams for incumbent telecom operators.
- Ensuring equitable and comprehensive broadband coverage in rural and geographically challenging regions of New Zealand remains a persistent challenge.
Emerging Opportunities in New Zealand Telecom Industry
- Expansion of 5G and 6G networks.
- Growth in IoT applications and smart city initiatives.
- Increasing demand for cloud-based services and cybersecurity solutions.
- Opportunities in rural broadband expansion and bridging the digital divide.
Growth Accelerators in the New Zealand Telecom Industry
Strategic partnerships between telecom providers and technology companies, fostering innovation in areas like 5G and IoT, are key growth drivers. Government initiatives supporting infrastructure development and bridging the digital divide will continue to fuel market expansion. The increasing demand for cloud-based services and cybersecurity solutions further presents significant growth potential.
Key Players Shaping the New Zealand Telecom Industry Market
- Modica Group Limited
- Chorus New Zealand Limited
- Spark New Zealand Limited
- Crown Infrastructure Partners
- Symbio Networks Pty Ltd
- Two Degrees Mobile Limited
- Vodafone New Zealand Limited
- Vocus Group Limited
- Tuatahi First Fibre
- Compass NZ
Notable Milestones in New Zealand Telecom Industry Sector
- August 2022: Spark achieved a significant milestone by successfully conducting the first end-to-end 5G standalone network test in New Zealand, marking a crucial step in advancing 5G network capabilities.
- September 2022: Vodafone New Zealand solidified its commitment to future network innovation through a strategic partnership with Nokia, aimed at accelerating the development of 6G and 5G-Advanced network technologies, thereby reinforcing their ongoing collaboration.
In-Depth New Zealand Telecom Industry Market Outlook
The New Zealand telecom market is poised for continued growth, driven by technological advancements, government initiatives, and evolving consumer demands. Strategic investments in 5G and fiber optic networks, coupled with a focus on expanding rural broadband access, will unlock significant market potential. Opportunities exist for companies to innovate in areas like IoT, cloud services, and cybersecurity, capitalizing on the growing demand for data-intensive applications.
New Zealand Telecom Industry Segmentation
-
1. Segmenta
-
1.1. Voice Services
- 1.1.1. Wired
- 1.1.2. Wireless
- 1.2. Data and
- 1.3. OTT and Pay-TV Services
-
1.1. Voice Services
New Zealand Telecom Industry Segmentation By Geography
- 1. New Zealand
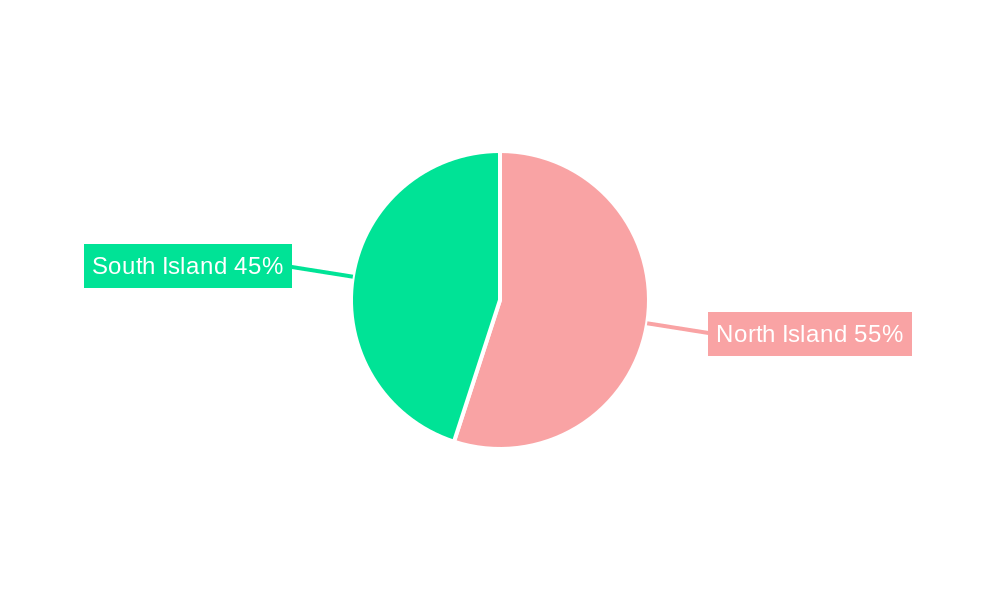
New Zealand Telecom Industry Regional Market Share
Geographic Coverage of New Zealand Telecom Industry
New Zealand Telecom Industry REPORT HIGHLIGHTS
| Aspects | Details |
|---|---|
| Study Period | 2020-2034 |
| Base Year | 2025 |
| Estimated Year | 2026 |
| Forecast Period | 2026-2034 |
| Historical Period | 2020-2025 |
| Growth Rate | CAGR of 1.2% from 2020-2034 |
| Segmentation |
|
Table of Contents
- 1. Introduction
- 1.1. Research Scope
- 1.2. Market Segmentation
- 1.3. Research Methodology
- 1.4. Definitions and Assumptions
- 2. Executive Summary
- 2.1. Introduction
- 3. Market Dynamics
- 3.1. Introduction
- 3.2. Market Drivers
- 3.2.1. Growing Market for OTT; Investment on Rural Connectivity
- 3.3. Market Restrains
- 3.3.1. Rigid Competition in the Market
- 3.4. Market Trends
- 3.4.1. Growing Market of OTT
- 4. Market Factor Analysis
- 4.1. Porters Five Forces
- 4.2. Supply/Value Chain
- 4.3. PESTEL analysis
- 4.4. Market Entropy
- 4.5. Patent/Trademark Analysis
- 5. New Zealand Telecom Industry Analysis, Insights and Forecast, 2020-2032
- 5.1. Market Analysis, Insights and Forecast - by Segmenta
- 5.1.1. Voice Services
- 5.1.1.1. Wired
- 5.1.1.2. Wireless
- 5.1.2. Data and
- 5.1.3. OTT and Pay-TV Services
- 5.1.1. Voice Services
- 5.2. Market Analysis, Insights and Forecast - by Region
- 5.2.1. New Zealand
- 5.1. Market Analysis, Insights and Forecast - by Segmenta
- 6. Competitive Analysis
- 6.1. Market Share Analysis 2025
- 6.2. Company Profiles
- 6.2.1 Modica Group Limited
- 6.2.1.1. Overview
- 6.2.1.2. Products
- 6.2.1.3. SWOT Analysis
- 6.2.1.4. Recent Developments
- 6.2.1.5. Financials (Based on Availability)
- 6.2.2 Chorus New Zealand Limited
- 6.2.2.1. Overview
- 6.2.2.2. Products
- 6.2.2.3. SWOT Analysis
- 6.2.2.4. Recent Developments
- 6.2.2.5. Financials (Based on Availability)
- 6.2.3 Spark New Zealand Limited
- 6.2.3.1. Overview
- 6.2.3.2. Products
- 6.2.3.3. SWOT Analysis
- 6.2.3.4. Recent Developments
- 6.2.3.5. Financials (Based on Availability)
- 6.2.4 Crown Infrastructure Partners
- 6.2.4.1. Overview
- 6.2.4.2. Products
- 6.2.4.3. SWOT Analysis
- 6.2.4.4. Recent Developments
- 6.2.4.5. Financials (Based on Availability)
- 6.2.5 Symbio Networks Pty Ltd*List Not Exhaustive
- 6.2.5.1. Overview
- 6.2.5.2. Products
- 6.2.5.3. SWOT Analysis
- 6.2.5.4. Recent Developments
- 6.2.5.5. Financials (Based on Availability)
- 6.2.6 Two Degrees Mobile Limited
- 6.2.6.1. Overview
- 6.2.6.2. Products
- 6.2.6.3. SWOT Analysis
- 6.2.6.4. Recent Developments
- 6.2.6.5. Financials (Based on Availability)
- 6.2.7 Vodafone New Zealand Limited
- 6.2.7.1. Overview
- 6.2.7.2. Products
- 6.2.7.3. SWOT Analysis
- 6.2.7.4. Recent Developments
- 6.2.7.5. Financials (Based on Availability)
- 6.2.8 Vocus Group Limited
- 6.2.8.1. Overview
- 6.2.8.2. Products
- 6.2.8.3. SWOT Analysis
- 6.2.8.4. Recent Developments
- 6.2.8.5. Financials (Based on Availability)
- 6.2.9 Tuatahi First Fibre
- 6.2.9.1. Overview
- 6.2.9.2. Products
- 6.2.9.3. SWOT Analysis
- 6.2.9.4. Recent Developments
- 6.2.9.5. Financials (Based on Availability)
- 6.2.10 Compass NZ
- 6.2.10.1. Overview
- 6.2.10.2. Products
- 6.2.10.3. SWOT Analysis
- 6.2.10.4. Recent Developments
- 6.2.10.5. Financials (Based on Availability)
- 6.2.1 Modica Group Limited
List of Figures
- Figure 1: New Zealand Telecom Industry Revenue Breakdown (billion, %) by Product 2025 & 2033
- Figure 2: New Zealand Telecom Industry Share (%) by Company 2025
List of Tables
- Table 1: New Zealand Telecom Industry Revenue billion Forecast, by Segmenta 2020 & 2033
- Table 2: New Zealand Telecom Industry Revenue billion Forecast, by Region 2020 & 2033
- Table 3: New Zealand Telecom Industry Revenue billion Forecast, by Segmenta 2020 & 2033
- Table 4: New Zealand Telecom Industry Revenue billion Forecast, by Country 2020 & 2033
Frequently Asked Questions
1. What is the projected Compound Annual Growth Rate (CAGR) of the New Zealand Telecom Industry?
The projected CAGR is approximately 1.2%.
2. Which companies are prominent players in the New Zealand Telecom Industry?
Key companies in the market include Modica Group Limited, Chorus New Zealand Limited, Spark New Zealand Limited, Crown Infrastructure Partners, Symbio Networks Pty Ltd*List Not Exhaustive, Two Degrees Mobile Limited, Vodafone New Zealand Limited, Vocus Group Limited, Tuatahi First Fibre, Compass NZ.
3. What are the main segments of the New Zealand Telecom Industry?
The market segments include Segmenta.
4. Can you provide details about the market size?
The market size is estimated to be USD 3.4 billion as of 2022.
5. What are some drivers contributing to market growth?
Growing Market for OTT; Investment on Rural Connectivity.
6. What are the notable trends driving market growth?
Growing Market of OTT.
7. Are there any restraints impacting market growth?
Rigid Competition in the Market.
8. Can you provide examples of recent developments in the market?
August 2022: Spark tested the first end-to-end 5G standalone network in New Zealand. Technology companies Mavenir, AWS, Nokia, and Oppo, have participated in the testing. Such development would be significant for telecommunications businesses in New Zealand, where operators are now rolling out 5G networks. However, data centers and network cores still use 4G infrastructure and older technologies.
9. What pricing options are available for accessing the report?
Pricing options include single-user, multi-user, and enterprise licenses priced at USD 3800, USD 4500, and USD 5800 respectively.
10. Is the market size provided in terms of value or volume?
The market size is provided in terms of value, measured in billion.
11. Are there any specific market keywords associated with the report?
Yes, the market keyword associated with the report is "New Zealand Telecom Industry," which aids in identifying and referencing the specific market segment covered.
12. How do I determine which pricing option suits my needs best?
The pricing options vary based on user requirements and access needs. Individual users may opt for single-user licenses, while businesses requiring broader access may choose multi-user or enterprise licenses for cost-effective access to the report.
13. Are there any additional resources or data provided in the New Zealand Telecom Industry report?
While the report offers comprehensive insights, it's advisable to review the specific contents or supplementary materials provided to ascertain if additional resources or data are available.
14. How can I stay updated on further developments or reports in the New Zealand Telecom Industry?
To stay informed about further developments, trends, and reports in the New Zealand Telecom Industry, consider subscribing to industry newsletters, following relevant companies and organizations, or regularly checking reputable industry news sources and publications.
Methodology
Step 1 - Identification of Relevant Samples Size from Population Database


Step 2 - Approaches for Defining Global Market Size (Value, Volume* & Price*)

Note*: In applicable scenarios
Step 3 - Data Sources
Primary Research
- Web Analytics
- Survey Reports
- Research Institute
- Latest Research Reports
- Opinion Leaders
Secondary Research
- Annual Reports
- White Paper
- Latest Press Release
- Industry Association
- Paid Database
- Investor Presentations

Step 4 - Data Triangulation
Involves using different sources of information in order to increase the validity of a study
These sources are likely to be stakeholders in a program - participants, other researchers, program staff, other community members, and so on.
Then we put all data in single framework & apply various statistical tools to find out the dynamic on the market.
During the analysis stage, feedback from the stakeholder groups would be compared to determine areas of agreement as well as areas of divergence