

Key Insights
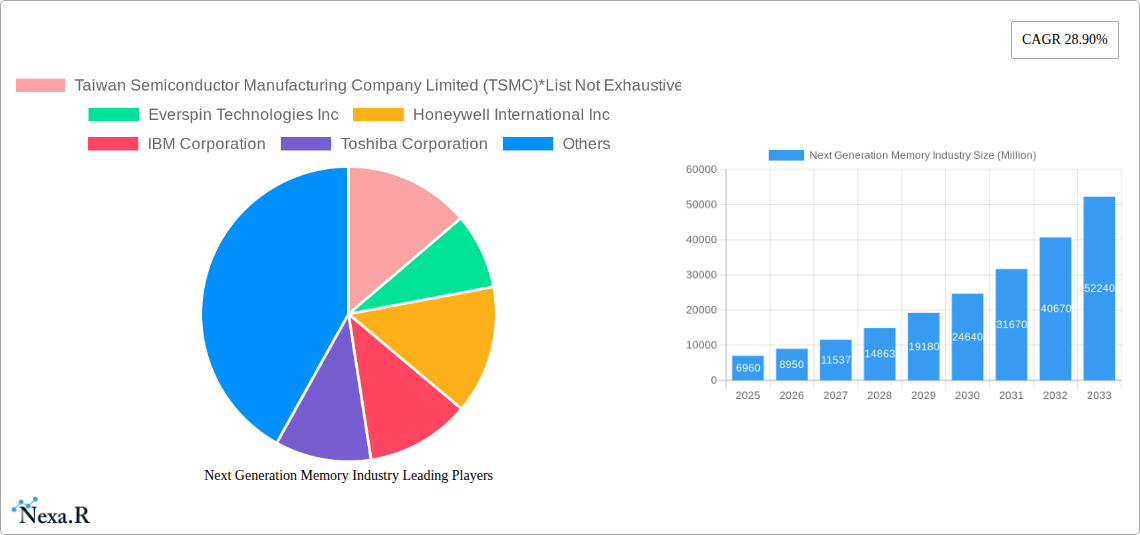
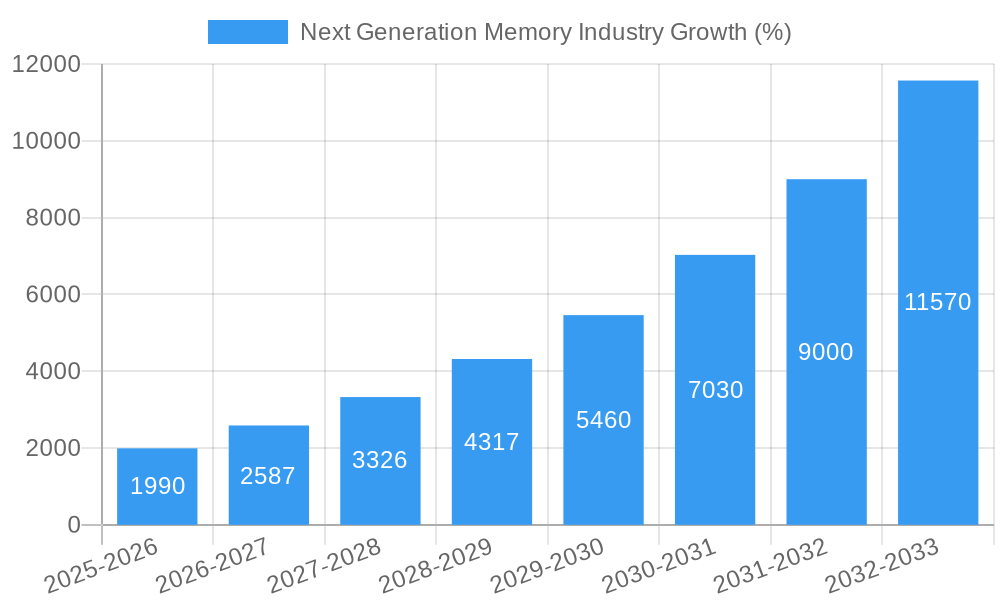
The Next Generation Memory (NGM) market is experiencing explosive growth, projected to reach \$6.96 billion in 2025 and exhibiting a remarkable Compound Annual Growth Rate (CAGR) of 28.90% from 2025 to 2033. This surge is driven by the increasing demand for high-performance computing, particularly in data-intensive sectors like BFSI (Banking, Financial Services, and Insurance), telecommunications, and consumer electronics. The proliferation of IoT devices, AI applications, and the increasing need for faster data processing and storage are key catalysts. Technological advancements in non-volatile memory (NVM) technologies, such as Phase Change RAM (PCRAM), STT-RAM, and 3D NAND, are fueling this expansion, offering superior performance and energy efficiency compared to traditional memory solutions. Market segmentation reveals that NVM holds a significant share, driven by its inherent advantages in data retention and speed. While the growth trajectory is positive, potential restraints include high manufacturing costs for some advanced NVM technologies and the need for wider industry adoption.
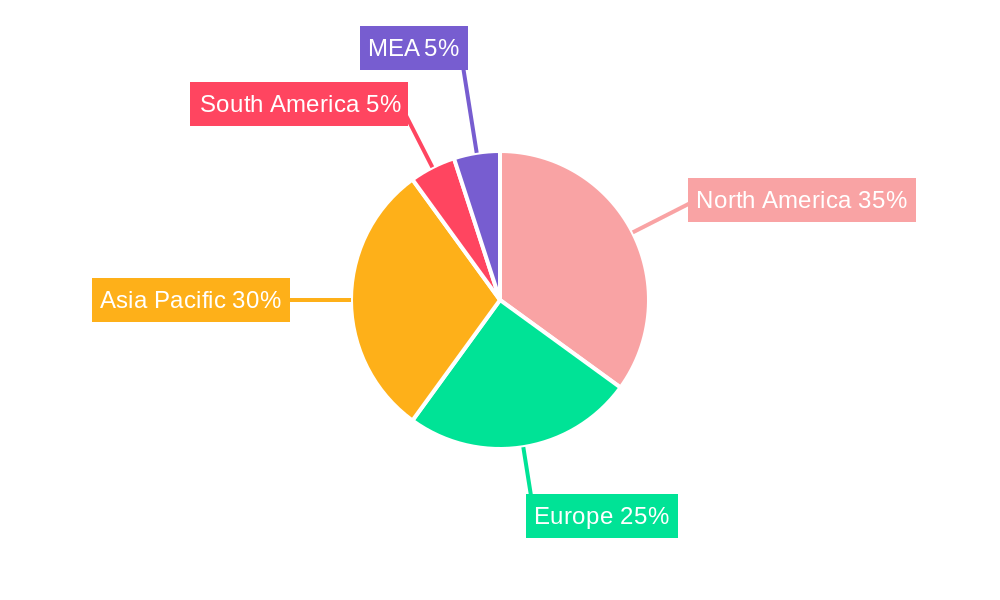
Growth is geographically diverse, with North America and Asia Pacific leading the charge. North America's established technological infrastructure and strong presence of major players like Intel and Micron contribute to its dominance. Asia Pacific, driven by burgeoning economies and rapid technological advancements in countries like China, South Korea, and Japan, is poised for significant expansion. The competitive landscape is intense, with key players like TSMC, Samsung, Micron, SK Hynix, and Intel vying for market share through continuous innovation and strategic partnerships. The forecast period suggests a continued upward trajectory for the NGM market, with consistent technological advancements and increasing demand in diverse applications reinforcing the industry's positive growth outlook. The market's success hinges on the continued miniaturization of memory chips, the development of new materials with improved properties, and the decreasing cost of manufacturing advanced NVM technologies.
Next Generation Memory Industry: Market Report 2019-2033
This comprehensive report provides an in-depth analysis of the Next Generation Memory industry, encompassing market dynamics, growth trends, regional landscapes, product innovation, key players, and future outlook. The study period covers 2019-2033, with a base year of 2025 and a forecast period of 2025-2033. This report is essential for industry professionals, investors, and strategists seeking to understand and capitalize on the opportunities within this rapidly evolving sector. The report analyzes both parent and child markets, providing a granular view of the market segmentation by technology (Volatile, Non-volatile, including Phase change RAM, STT-RAM, and SRAM) and application (BFSI, Consumer Electronics, Government, Telecommunications, Information Technology, and Other Applications). Market size is presented in Million units.
Next Generation Memory Industry Market Dynamics & Structure
The next-generation memory market is characterized by intense competition, rapid technological advancements, and evolving regulatory landscapes. Market concentration is relatively high, with a few major players controlling significant market share. However, the emergence of innovative technologies and new entrants is gradually shifting the competitive dynamics. The industry is driven by increasing demand for high-performance computing, particularly in AI and data center applications. Mergers and acquisitions (M&A) activity is frequent, reflecting consolidation efforts and attempts to acquire crucial technologies.
- Market Concentration: Top 5 players hold approximately xx% of the market share (2024).
- Technological Innovation: HBM, 3D NAND, and other emerging non-volatile memory technologies are key drivers.
- Regulatory Frameworks: Government policies and regulations impacting semiconductor manufacturing and data security influence market growth.
- Competitive Product Substitutes: Traditional memory technologies pose a competitive threat, especially in price-sensitive segments.
- End-User Demographics: Data centers, cloud providers, and high-performance computing sectors are primary end-users.
- M&A Trends: An average of xx M&A deals per year have been observed in the historical period (2019-2024). Innovation barriers, such as high R&D costs and complex manufacturing processes, limit the entry of new players.
Next Generation Memory Industry Growth Trends & Insights
The next-generation memory market is experiencing robust growth, fueled by the expanding adoption of high-bandwidth memory (HBM) in artificial intelligence (AI) and high-performance computing (HPC) applications. The market size is expected to grow at a Compound Annual Growth Rate (CAGR) of xx% from 2025 to 2033, reaching xx Million units by 2033. This growth is driven by increasing data volumes, the proliferation of connected devices, and the demand for faster data processing speeds. Technological disruptions, such as the development of novel memory technologies, are constantly reshaping the market landscape, while consumer behavior is shifting towards more energy-efficient and higher-capacity memory solutions. Market penetration of advanced memory technologies is steadily increasing across various application segments.
Dominant Regions, Countries, or Segments in Next Generation Memory Industry
The North American and Asia-Pacific regions dominate the next-generation memory market, driven by strong demand from the IT and telecommunications sectors. Within Asia-Pacific, countries like South Korea, Taiwan, and China are key manufacturing hubs and major consumers of advanced memory technologies. The Information Technology segment and the Non-volatile memory technology segment demonstrate the most significant growth potential.
- Key Drivers:
- North America: Strong investment in R&D, high adoption rates of advanced technologies, robust demand from the data center industry.
- Asia-Pacific: Large manufacturing capacity, significant government support for the semiconductor industry, high consumer electronics demand.
- Europe: Growing adoption of AI and HPC technologies in various sectors driving demand for advanced memory.
- Dominance Factors: Economic policies promoting technological advancements, robust infrastructure, and the presence of key manufacturers and research institutions have contributed to the dominance of these regions.
Next Generation Memory Industry Product Landscape
Next-generation memory products are characterized by higher bandwidth, lower power consumption, and increased storage capacity compared to their predecessors. Recent innovations include high-bandwidth memory (HBM) and various types of non-volatile memory technologies like 3D NAND. These advancements are enabling faster data processing, improved energy efficiency, and the development of more powerful computing systems. Unique selling propositions focus on speed, density, and power efficiency. Technological advancements such as advanced packaging techniques and new memory cell designs are continuously pushing the boundaries of performance.
Key Drivers, Barriers & Challenges in Next Generation Memory Industry
Key Drivers:
- Increasing demand for high-performance computing in AI and HPC.
- Growth of cloud computing and data centers.
- Advancements in semiconductor technology.
- Government initiatives promoting semiconductor manufacturing.
Challenges & Restraints:
- High R&D costs and manufacturing complexities.
- Geopolitical risks and supply chain disruptions.
- Stringent regulatory requirements.
- Intense competition among established players. Estimated impact of supply chain disruptions on market growth is xx% (2024).
Emerging Opportunities in Next Generation Memory Industry
- Expansion into emerging markets such as Africa and Latin America.
- Development of new applications in IoT, automotive, and medical devices.
- Increased adoption of innovative memory technologies in edge computing.
- Growth of the embedded memory market in various consumer electronic products.
Growth Accelerators in the Next Generation Memory Industry
Technological breakthroughs, particularly in HBM and other emerging non-volatile technologies, are driving significant growth. Strategic partnerships between memory manufacturers and system integrators are further accelerating market expansion. Investment in new manufacturing facilities and R&D to enhance production capacity and develop next-generation memory technologies is crucial for sustained growth.
Key Players Shaping the Next Generation Memory Industry Market
- Taiwan Semiconductor Manufacturing Company Limited (TSMC)
- Everspin Technologies Inc
- Honeywell International Inc
- IBM Corporation
- Toshiba Corporation
- Fujitsu Ltd
- Adesto Technologies
- Cypress Semiconductor Corporation
- Samsung Electronics Co Ltd
- Crossbar Inc
- Micron Technologies Inc
- SK Hynix Inc
- Avalanche Technologies Inc
- Intel Corporation
- Sony Corporation
Notable Milestones in Next Generation Memory Industry Sector
- October 2023: Samsung launched its next-generation memory solutions, including Shinebolt HBM3e, LPDDR5X CAMM2, and detachable AutoSSD, targeting hyperscale AI applications. This significantly advanced their competitiveness in the high-performance computing market.
- August 2023: SK Hynix launched its 5th generation HBM3E memory, designed for high-performance AI applications. This highlights the ongoing race to develop faster and higher-capacity memory.
In-Depth Next Generation Memory Industry Market Outlook
The next-generation memory market is poised for continued expansion, driven by the sustained growth of data centers, AI, and HPC. Strategic partnerships, investments in advanced technologies, and expansion into new applications will unlock significant growth opportunities in the coming years. The market's future success hinges on the ability of key players to innovate and deliver solutions that meet the escalating demands of high-performance computing and ever-growing data storage needs.
Next Generation Memory Industry Segmentation
-
1. Technology
-
1.1. Non-volatile
- 1.1.1. Magneto-Resistive Random-Access Memory (MRAM)
- 1.1.2. Ferroelectric RAM (FRAM)
- 1.1.3. Resistive Random-Access Memory (ReRAM)
- 1.1.4. 3D Xpoint
- 1.1.5. Nano RAM
- 1.1.6. Other No
-
1.2. Volatile
- 1.2.1. Hybrid Memory Cube (HMC)
- 1.2.2. High-bandwidth Memory (HBM)
-
1.1. Non-volatile
-
2. Application
- 2.1. BFSI
- 2.2. Consumer Electronics
- 2.3. Government
- 2.4. Telecommunications
- 2.5. Information Technology
- 2.6. Other Applications
Next Generation Memory Industry Segmentation By Geography
- 1. North America
- 2. Europe
- 3. Asia Pacific
- 4. Latin America
- 5. Middle East
Next Generation Memory Industry REPORT HIGHLIGHTS
| Aspects | Details |
|---|---|
| Study Period | 2019-2033 |
| Base Year | 2024 |
| Estimated Year | 2025 |
| Forecast Period | 2025-2033 |
| Historical Period | 2019-2024 |
| Growth Rate | CAGR of 28.90% from 2019-2033 |
| Segmentation |
|
Table of Contents
- 1. Introduction
- 1.1. Research Scope
- 1.2. Market Segmentation
- 1.3. Research Methodology
- 1.4. Definitions and Assumptions
- 2. Executive Summary
- 2.1. Introduction
- 3. Market Dynamics
- 3.1. Introduction
- 3.2. Market Drivers
- 3.2.1. Demand for Universal Memory Devices; Increasing Demand for Enterprise Storage Applications
- 3.3. Market Restrains
- 3.3.1. Lack of Stability Under Extreme Environmental Conditions
- 3.4. Market Trends
- 3.4.1. Information Technology Application will Have Significant Share in the Market
- 4. Market Factor Analysis
- 4.1. Porters Five Forces
- 4.2. Supply/Value Chain
- 4.3. PESTEL analysis
- 4.4. Market Entropy
- 4.5. Patent/Trademark Analysis
- 5. Global Next Generation Memory Industry Analysis, Insights and Forecast, 2019-2031
- 5.1. Market Analysis, Insights and Forecast - by Technology
- 5.1.1. Non-volatile
- 5.1.1.1. Magneto-Resistive Random-Access Memory (MRAM)
- 5.1.1.2. Ferroelectric RAM (FRAM)
- 5.1.1.3. Resistive Random-Access Memory (ReRAM)
- 5.1.1.4. 3D Xpoint
- 5.1.1.5. Nano RAM
- 5.1.1.6. Other No
- 5.1.2. Volatile
- 5.1.2.1. Hybrid Memory Cube (HMC)
- 5.1.2.2. High-bandwidth Memory (HBM)
- 5.1.1. Non-volatile
- 5.2. Market Analysis, Insights and Forecast - by Application
- 5.2.1. BFSI
- 5.2.2. Consumer Electronics
- 5.2.3. Government
- 5.2.4. Telecommunications
- 5.2.5. Information Technology
- 5.2.6. Other Applications
- 5.3. Market Analysis, Insights and Forecast - by Region
- 5.3.1. North America
- 5.3.2. Europe
- 5.3.3. Asia Pacific
- 5.3.4. Latin America
- 5.3.5. Middle East
- 5.1. Market Analysis, Insights and Forecast - by Technology
- 6. North America Next Generation Memory Industry Analysis, Insights and Forecast, 2019-2031
- 6.1. Market Analysis, Insights and Forecast - by Technology
- 6.1.1. Non-volatile
- 6.1.1.1. Magneto-Resistive Random-Access Memory (MRAM)
- 6.1.1.2. Ferroelectric RAM (FRAM)
- 6.1.1.3. Resistive Random-Access Memory (ReRAM)
- 6.1.1.4. 3D Xpoint
- 6.1.1.5. Nano RAM
- 6.1.1.6. Other No
- 6.1.2. Volatile
- 6.1.2.1. Hybrid Memory Cube (HMC)
- 6.1.2.2. High-bandwidth Memory (HBM)
- 6.1.1. Non-volatile
- 6.2. Market Analysis, Insights and Forecast - by Application
- 6.2.1. BFSI
- 6.2.2. Consumer Electronics
- 6.2.3. Government
- 6.2.4. Telecommunications
- 6.2.5. Information Technology
- 6.2.6. Other Applications
- 6.1. Market Analysis, Insights and Forecast - by Technology
- 7. Europe Next Generation Memory Industry Analysis, Insights and Forecast, 2019-2031
- 7.1. Market Analysis, Insights and Forecast - by Technology
- 7.1.1. Non-volatile
- 7.1.1.1. Magneto-Resistive Random-Access Memory (MRAM)
- 7.1.1.2. Ferroelectric RAM (FRAM)
- 7.1.1.3. Resistive Random-Access Memory (ReRAM)
- 7.1.1.4. 3D Xpoint
- 7.1.1.5. Nano RAM
- 7.1.1.6. Other No
- 7.1.2. Volatile
- 7.1.2.1. Hybrid Memory Cube (HMC)
- 7.1.2.2. High-bandwidth Memory (HBM)
- 7.1.1. Non-volatile
- 7.2. Market Analysis, Insights and Forecast - by Application
- 7.2.1. BFSI
- 7.2.2. Consumer Electronics
- 7.2.3. Government
- 7.2.4. Telecommunications
- 7.2.5. Information Technology
- 7.2.6. Other Applications
- 7.1. Market Analysis, Insights and Forecast - by Technology
- 8. Asia Pacific Next Generation Memory Industry Analysis, Insights and Forecast, 2019-2031
- 8.1. Market Analysis, Insights and Forecast - by Technology
- 8.1.1. Non-volatile
- 8.1.1.1. Magneto-Resistive Random-Access Memory (MRAM)
- 8.1.1.2. Ferroelectric RAM (FRAM)
- 8.1.1.3. Resistive Random-Access Memory (ReRAM)
- 8.1.1.4. 3D Xpoint
- 8.1.1.5. Nano RAM
- 8.1.1.6. Other No
- 8.1.2. Volatile
- 8.1.2.1. Hybrid Memory Cube (HMC)
- 8.1.2.2. High-bandwidth Memory (HBM)
- 8.1.1. Non-volatile
- 8.2. Market Analysis, Insights and Forecast - by Application
- 8.2.1. BFSI
- 8.2.2. Consumer Electronics
- 8.2.3. Government
- 8.2.4. Telecommunications
- 8.2.5. Information Technology
- 8.2.6. Other Applications
- 8.1. Market Analysis, Insights and Forecast - by Technology
- 9. Latin America Next Generation Memory Industry Analysis, Insights and Forecast, 2019-2031
- 9.1. Market Analysis, Insights and Forecast - by Technology
- 9.1.1. Non-volatile
- 9.1.1.1. Magneto-Resistive Random-Access Memory (MRAM)
- 9.1.1.2. Ferroelectric RAM (FRAM)
- 9.1.1.3. Resistive Random-Access Memory (ReRAM)
- 9.1.1.4. 3D Xpoint
- 9.1.1.5. Nano RAM
- 9.1.1.6. Other No
- 9.1.2. Volatile
- 9.1.2.1. Hybrid Memory Cube (HMC)
- 9.1.2.2. High-bandwidth Memory (HBM)
- 9.1.1. Non-volatile
- 9.2. Market Analysis, Insights and Forecast - by Application
- 9.2.1. BFSI
- 9.2.2. Consumer Electronics
- 9.2.3. Government
- 9.2.4. Telecommunications
- 9.2.5. Information Technology
- 9.2.6. Other Applications
- 9.1. Market Analysis, Insights and Forecast - by Technology
- 10. Middle East Next Generation Memory Industry Analysis, Insights and Forecast, 2019-2031
- 10.1. Market Analysis, Insights and Forecast - by Technology
- 10.1.1. Non-volatile
- 10.1.1.1. Magneto-Resistive Random-Access Memory (MRAM)
- 10.1.1.2. Ferroelectric RAM (FRAM)
- 10.1.1.3. Resistive Random-Access Memory (ReRAM)
- 10.1.1.4. 3D Xpoint
- 10.1.1.5. Nano RAM
- 10.1.1.6. Other No
- 10.1.2. Volatile
- 10.1.2.1. Hybrid Memory Cube (HMC)
- 10.1.2.2. High-bandwidth Memory (HBM)
- 10.1.1. Non-volatile
- 10.2. Market Analysis, Insights and Forecast - by Application
- 10.2.1. BFSI
- 10.2.2. Consumer Electronics
- 10.2.3. Government
- 10.2.4. Telecommunications
- 10.2.5. Information Technology
- 10.2.6. Other Applications
- 10.1. Market Analysis, Insights and Forecast - by Technology
- 11. North America Next Generation Memory Industry Analysis, Insights and Forecast, 2019-2031
- 11.1. Market Analysis, Insights and Forecast - By Country/Sub-region
- 11.1.1 United States
- 11.1.2 Canada
- 11.1.3 Mexico
- 12. Europe Next Generation Memory Industry Analysis, Insights and Forecast, 2019-2031
- 12.1. Market Analysis, Insights and Forecast - By Country/Sub-region
- 12.1.1 Germany
- 12.1.2 United Kingdom
- 12.1.3 France
- 12.1.4 Spain
- 12.1.5 Italy
- 12.1.6 Spain
- 12.1.7 Belgium
- 12.1.8 Netherland
- 12.1.9 Nordics
- 12.1.10 Rest of Europe
- 13. Asia Pacific Next Generation Memory Industry Analysis, Insights and Forecast, 2019-2031
- 13.1. Market Analysis, Insights and Forecast - By Country/Sub-region
- 13.1.1 China
- 13.1.2 Japan
- 13.1.3 India
- 13.1.4 South Korea
- 13.1.5 Southeast Asia
- 13.1.6 Australia
- 13.1.7 Indonesia
- 13.1.8 Phillipes
- 13.1.9 Singapore
- 13.1.10 Thailandc
- 13.1.11 Rest of Asia Pacific
- 14. South America Next Generation Memory Industry Analysis, Insights and Forecast, 2019-2031
- 14.1. Market Analysis, Insights and Forecast - By Country/Sub-region
- 14.1.1 Brazil
- 14.1.2 Argentina
- 14.1.3 Peru
- 14.1.4 Chile
- 14.1.5 Colombia
- 14.1.6 Ecuador
- 14.1.7 Venezuela
- 14.1.8 Rest of South America
- 15. North America Next Generation Memory Industry Analysis, Insights and Forecast, 2019-2031
- 15.1. Market Analysis, Insights and Forecast - By Country/Sub-region
- 15.1.1 United States
- 15.1.2 Canada
- 15.1.3 Mexico
- 16. MEA Next Generation Memory Industry Analysis, Insights and Forecast, 2019-2031
- 16.1. Market Analysis, Insights and Forecast - By Country/Sub-region
- 16.1.1 United Arab Emirates
- 16.1.2 Saudi Arabia
- 16.1.3 South Africa
- 16.1.4 Rest of Middle East and Africa
- 17. Competitive Analysis
- 17.1. Global Market Share Analysis 2024
- 17.2. Company Profiles
- 17.2.1 Taiwan Semiconductor Manufacturing Company Limited (TSMC)*List Not Exhaustive
- 17.2.1.1. Overview
- 17.2.1.2. Products
- 17.2.1.3. SWOT Analysis
- 17.2.1.4. Recent Developments
- 17.2.1.5. Financials (Based on Availability)
- 17.2.2 Everspin Technologies Inc
- 17.2.2.1. Overview
- 17.2.2.2. Products
- 17.2.2.3. SWOT Analysis
- 17.2.2.4. Recent Developments
- 17.2.2.5. Financials (Based on Availability)
- 17.2.3 Honeywell International Inc
- 17.2.3.1. Overview
- 17.2.3.2. Products
- 17.2.3.3. SWOT Analysis
- 17.2.3.4. Recent Developments
- 17.2.3.5. Financials (Based on Availability)
- 17.2.4 IBM Corporation
- 17.2.4.1. Overview
- 17.2.4.2. Products
- 17.2.4.3. SWOT Analysis
- 17.2.4.4. Recent Developments
- 17.2.4.5. Financials (Based on Availability)
- 17.2.5 Toshiba Corporation
- 17.2.5.1. Overview
- 17.2.5.2. Products
- 17.2.5.3. SWOT Analysis
- 17.2.5.4. Recent Developments
- 17.2.5.5. Financials (Based on Availability)
- 17.2.6 Fujitsu Ltd
- 17.2.6.1. Overview
- 17.2.6.2. Products
- 17.2.6.3. SWOT Analysis
- 17.2.6.4. Recent Developments
- 17.2.6.5. Financials (Based on Availability)
- 17.2.7 Adesto Technologies
- 17.2.7.1. Overview
- 17.2.7.2. Products
- 17.2.7.3. SWOT Analysis
- 17.2.7.4. Recent Developments
- 17.2.7.5. Financials (Based on Availability)
- 17.2.8 Cypress Semiconductor Corporation
- 17.2.8.1. Overview
- 17.2.8.2. Products
- 17.2.8.3. SWOT Analysis
- 17.2.8.4. Recent Developments
- 17.2.8.5. Financials (Based on Availability)
- 17.2.9 Samsung Electronics Co Ltd
- 17.2.9.1. Overview
- 17.2.9.2. Products
- 17.2.9.3. SWOT Analysis
- 17.2.9.4. Recent Developments
- 17.2.9.5. Financials (Based on Availability)
- 17.2.10 Crossbar Inc
- 17.2.10.1. Overview
- 17.2.10.2. Products
- 17.2.10.3. SWOT Analysis
- 17.2.10.4. Recent Developments
- 17.2.10.5. Financials (Based on Availability)
- 17.2.11 Micron Technologies Inc
- 17.2.11.1. Overview
- 17.2.11.2. Products
- 17.2.11.3. SWOT Analysis
- 17.2.11.4. Recent Developments
- 17.2.11.5. Financials (Based on Availability)
- 17.2.12 SK Hynix Inc
- 17.2.12.1. Overview
- 17.2.12.2. Products
- 17.2.12.3. SWOT Analysis
- 17.2.12.4. Recent Developments
- 17.2.12.5. Financials (Based on Availability)
- 17.2.13 Avalanche Technologies Inc
- 17.2.13.1. Overview
- 17.2.13.2. Products
- 17.2.13.3. SWOT Analysis
- 17.2.13.4. Recent Developments
- 17.2.13.5. Financials (Based on Availability)
- 17.2.14 Intel Corporation
- 17.2.14.1. Overview
- 17.2.14.2. Products
- 17.2.14.3. SWOT Analysis
- 17.2.14.4. Recent Developments
- 17.2.14.5. Financials (Based on Availability)
- 17.2.15 Sony Corporation
- 17.2.15.1. Overview
- 17.2.15.2. Products
- 17.2.15.3. SWOT Analysis
- 17.2.15.4. Recent Developments
- 17.2.15.5. Financials (Based on Availability)
- 17.2.1 Taiwan Semiconductor Manufacturing Company Limited (TSMC)*List Not Exhaustive
List of Figures
- Figure 1: Global Next Generation Memory Industry Revenue Breakdown (Million, %) by Region 2024 & 2032
- Figure 2: North America Next Generation Memory Industry Revenue (Million), by Country 2024 & 2032
- Figure 3: North America Next Generation Memory Industry Revenue Share (%), by Country 2024 & 2032
- Figure 4: Europe Next Generation Memory Industry Revenue (Million), by Country 2024 & 2032
- Figure 5: Europe Next Generation Memory Industry Revenue Share (%), by Country 2024 & 2032
- Figure 6: Asia Pacific Next Generation Memory Industry Revenue (Million), by Country 2024 & 2032
- Figure 7: Asia Pacific Next Generation Memory Industry Revenue Share (%), by Country 2024 & 2032
- Figure 8: South America Next Generation Memory Industry Revenue (Million), by Country 2024 & 2032
- Figure 9: South America Next Generation Memory Industry Revenue Share (%), by Country 2024 & 2032
- Figure 10: North America Next Generation Memory Industry Revenue (Million), by Country 2024 & 2032
- Figure 11: North America Next Generation Memory Industry Revenue Share (%), by Country 2024 & 2032
- Figure 12: MEA Next Generation Memory Industry Revenue (Million), by Country 2024 & 2032
- Figure 13: MEA Next Generation Memory Industry Revenue Share (%), by Country 2024 & 2032
- Figure 14: North America Next Generation Memory Industry Revenue (Million), by Technology 2024 & 2032
- Figure 15: North America Next Generation Memory Industry Revenue Share (%), by Technology 2024 & 2032
- Figure 16: North America Next Generation Memory Industry Revenue (Million), by Application 2024 & 2032
- Figure 17: North America Next Generation Memory Industry Revenue Share (%), by Application 2024 & 2032
- Figure 18: North America Next Generation Memory Industry Revenue (Million), by Country 2024 & 2032
- Figure 19: North America Next Generation Memory Industry Revenue Share (%), by Country 2024 & 2032
- Figure 20: Europe Next Generation Memory Industry Revenue (Million), by Technology 2024 & 2032
- Figure 21: Europe Next Generation Memory Industry Revenue Share (%), by Technology 2024 & 2032
- Figure 22: Europe Next Generation Memory Industry Revenue (Million), by Application 2024 & 2032
- Figure 23: Europe Next Generation Memory Industry Revenue Share (%), by Application 2024 & 2032
- Figure 24: Europe Next Generation Memory Industry Revenue (Million), by Country 2024 & 2032
- Figure 25: Europe Next Generation Memory Industry Revenue Share (%), by Country 2024 & 2032
- Figure 26: Asia Pacific Next Generation Memory Industry Revenue (Million), by Technology 2024 & 2032
- Figure 27: Asia Pacific Next Generation Memory Industry Revenue Share (%), by Technology 2024 & 2032
- Figure 28: Asia Pacific Next Generation Memory Industry Revenue (Million), by Application 2024 & 2032
- Figure 29: Asia Pacific Next Generation Memory Industry Revenue Share (%), by Application 2024 & 2032
- Figure 30: Asia Pacific Next Generation Memory Industry Revenue (Million), by Country 2024 & 2032
- Figure 31: Asia Pacific Next Generation Memory Industry Revenue Share (%), by Country 2024 & 2032
- Figure 32: Latin America Next Generation Memory Industry Revenue (Million), by Technology 2024 & 2032
- Figure 33: Latin America Next Generation Memory Industry Revenue Share (%), by Technology 2024 & 2032
- Figure 34: Latin America Next Generation Memory Industry Revenue (Million), by Application 2024 & 2032
- Figure 35: Latin America Next Generation Memory Industry Revenue Share (%), by Application 2024 & 2032
- Figure 36: Latin America Next Generation Memory Industry Revenue (Million), by Country 2024 & 2032
- Figure 37: Latin America Next Generation Memory Industry Revenue Share (%), by Country 2024 & 2032
- Figure 38: Middle East Next Generation Memory Industry Revenue (Million), by Technology 2024 & 2032
- Figure 39: Middle East Next Generation Memory Industry Revenue Share (%), by Technology 2024 & 2032
- Figure 40: Middle East Next Generation Memory Industry Revenue (Million), by Application 2024 & 2032
- Figure 41: Middle East Next Generation Memory Industry Revenue Share (%), by Application 2024 & 2032
- Figure 42: Middle East Next Generation Memory Industry Revenue (Million), by Country 2024 & 2032
- Figure 43: Middle East Next Generation Memory Industry Revenue Share (%), by Country 2024 & 2032
List of Tables
- Table 1: Global Next Generation Memory Industry Revenue Million Forecast, by Region 2019 & 2032
- Table 2: Global Next Generation Memory Industry Revenue Million Forecast, by Technology 2019 & 2032
- Table 3: Global Next Generation Memory Industry Revenue Million Forecast, by Application 2019 & 2032
- Table 4: Global Next Generation Memory Industry Revenue Million Forecast, by Region 2019 & 2032
- Table 5: Global Next Generation Memory Industry Revenue Million Forecast, by Country 2019 & 2032
- Table 6: United States Next Generation Memory Industry Revenue (Million) Forecast, by Application 2019 & 2032
- Table 7: Canada Next Generation Memory Industry Revenue (Million) Forecast, by Application 2019 & 2032
- Table 8: Mexico Next Generation Memory Industry Revenue (Million) Forecast, by Application 2019 & 2032
- Table 9: Global Next Generation Memory Industry Revenue Million Forecast, by Country 2019 & 2032
- Table 10: Germany Next Generation Memory Industry Revenue (Million) Forecast, by Application 2019 & 2032
- Table 11: United Kingdom Next Generation Memory Industry Revenue (Million) Forecast, by Application 2019 & 2032
- Table 12: France Next Generation Memory Industry Revenue (Million) Forecast, by Application 2019 & 2032
- Table 13: Spain Next Generation Memory Industry Revenue (Million) Forecast, by Application 2019 & 2032
- Table 14: Italy Next Generation Memory Industry Revenue (Million) Forecast, by Application 2019 & 2032
- Table 15: Spain Next Generation Memory Industry Revenue (Million) Forecast, by Application 2019 & 2032
- Table 16: Belgium Next Generation Memory Industry Revenue (Million) Forecast, by Application 2019 & 2032
- Table 17: Netherland Next Generation Memory Industry Revenue (Million) Forecast, by Application 2019 & 2032
- Table 18: Nordics Next Generation Memory Industry Revenue (Million) Forecast, by Application 2019 & 2032
- Table 19: Rest of Europe Next Generation Memory Industry Revenue (Million) Forecast, by Application 2019 & 2032
- Table 20: Global Next Generation Memory Industry Revenue Million Forecast, by Country 2019 & 2032
- Table 21: China Next Generation Memory Industry Revenue (Million) Forecast, by Application 2019 & 2032
- Table 22: Japan Next Generation Memory Industry Revenue (Million) Forecast, by Application 2019 & 2032
- Table 23: India Next Generation Memory Industry Revenue (Million) Forecast, by Application 2019 & 2032
- Table 24: South Korea Next Generation Memory Industry Revenue (Million) Forecast, by Application 2019 & 2032
- Table 25: Southeast Asia Next Generation Memory Industry Revenue (Million) Forecast, by Application 2019 & 2032
- Table 26: Australia Next Generation Memory Industry Revenue (Million) Forecast, by Application 2019 & 2032
- Table 27: Indonesia Next Generation Memory Industry Revenue (Million) Forecast, by Application 2019 & 2032
- Table 28: Phillipes Next Generation Memory Industry Revenue (Million) Forecast, by Application 2019 & 2032
- Table 29: Singapore Next Generation Memory Industry Revenue (Million) Forecast, by Application 2019 & 2032
- Table 30: Thailandc Next Generation Memory Industry Revenue (Million) Forecast, by Application 2019 & 2032
- Table 31: Rest of Asia Pacific Next Generation Memory Industry Revenue (Million) Forecast, by Application 2019 & 2032
- Table 32: Global Next Generation Memory Industry Revenue Million Forecast, by Country 2019 & 2032
- Table 33: Brazil Next Generation Memory Industry Revenue (Million) Forecast, by Application 2019 & 2032
- Table 34: Argentina Next Generation Memory Industry Revenue (Million) Forecast, by Application 2019 & 2032
- Table 35: Peru Next Generation Memory Industry Revenue (Million) Forecast, by Application 2019 & 2032
- Table 36: Chile Next Generation Memory Industry Revenue (Million) Forecast, by Application 2019 & 2032
- Table 37: Colombia Next Generation Memory Industry Revenue (Million) Forecast, by Application 2019 & 2032
- Table 38: Ecuador Next Generation Memory Industry Revenue (Million) Forecast, by Application 2019 & 2032
- Table 39: Venezuela Next Generation Memory Industry Revenue (Million) Forecast, by Application 2019 & 2032
- Table 40: Rest of South America Next Generation Memory Industry Revenue (Million) Forecast, by Application 2019 & 2032
- Table 41: Global Next Generation Memory Industry Revenue Million Forecast, by Country 2019 & 2032
- Table 42: United States Next Generation Memory Industry Revenue (Million) Forecast, by Application 2019 & 2032
- Table 43: Canada Next Generation Memory Industry Revenue (Million) Forecast, by Application 2019 & 2032
- Table 44: Mexico Next Generation Memory Industry Revenue (Million) Forecast, by Application 2019 & 2032
- Table 45: Global Next Generation Memory Industry Revenue Million Forecast, by Country 2019 & 2032
- Table 46: United Arab Emirates Next Generation Memory Industry Revenue (Million) Forecast, by Application 2019 & 2032
- Table 47: Saudi Arabia Next Generation Memory Industry Revenue (Million) Forecast, by Application 2019 & 2032
- Table 48: South Africa Next Generation Memory Industry Revenue (Million) Forecast, by Application 2019 & 2032
- Table 49: Rest of Middle East and Africa Next Generation Memory Industry Revenue (Million) Forecast, by Application 2019 & 2032
- Table 50: Global Next Generation Memory Industry Revenue Million Forecast, by Technology 2019 & 2032
- Table 51: Global Next Generation Memory Industry Revenue Million Forecast, by Application 2019 & 2032
- Table 52: Global Next Generation Memory Industry Revenue Million Forecast, by Country 2019 & 2032
- Table 53: Global Next Generation Memory Industry Revenue Million Forecast, by Technology 2019 & 2032
- Table 54: Global Next Generation Memory Industry Revenue Million Forecast, by Application 2019 & 2032
- Table 55: Global Next Generation Memory Industry Revenue Million Forecast, by Country 2019 & 2032
- Table 56: Global Next Generation Memory Industry Revenue Million Forecast, by Technology 2019 & 2032
- Table 57: Global Next Generation Memory Industry Revenue Million Forecast, by Application 2019 & 2032
- Table 58: Global Next Generation Memory Industry Revenue Million Forecast, by Country 2019 & 2032
- Table 59: Global Next Generation Memory Industry Revenue Million Forecast, by Technology 2019 & 2032
- Table 60: Global Next Generation Memory Industry Revenue Million Forecast, by Application 2019 & 2032
- Table 61: Global Next Generation Memory Industry Revenue Million Forecast, by Country 2019 & 2032
- Table 62: Global Next Generation Memory Industry Revenue Million Forecast, by Technology 2019 & 2032
- Table 63: Global Next Generation Memory Industry Revenue Million Forecast, by Application 2019 & 2032
- Table 64: Global Next Generation Memory Industry Revenue Million Forecast, by Country 2019 & 2032
Frequently Asked Questions
1. What is the projected Compound Annual Growth Rate (CAGR) of the Next Generation Memory Industry?
The projected CAGR is approximately 28.90%.
2. Which companies are prominent players in the Next Generation Memory Industry?
Key companies in the market include Taiwan Semiconductor Manufacturing Company Limited (TSMC)*List Not Exhaustive, Everspin Technologies Inc, Honeywell International Inc, IBM Corporation, Toshiba Corporation, Fujitsu Ltd, Adesto Technologies, Cypress Semiconductor Corporation, Samsung Electronics Co Ltd, Crossbar Inc, Micron Technologies Inc, SK Hynix Inc, Avalanche Technologies Inc, Intel Corporation, Sony Corporation.
3. What are the main segments of the Next Generation Memory Industry?
The market segments include Technology, Application.
4. Can you provide details about the market size?
The market size is estimated to be USD 6.96 Million as of 2022.
5. What are some drivers contributing to market growth?
Demand for Universal Memory Devices; Increasing Demand for Enterprise Storage Applications.
6. What are the notable trends driving market growth?
Information Technology Application will Have Significant Share in the Market.
7. Are there any restraints impacting market growth?
Lack of Stability Under Extreme Environmental Conditions.
8. Can you provide examples of recent developments in the market?
October 2023: Samsung introduced its next-generation memory solutions on Memory Tech Day, with the aim of playing a significant role in offering advanced artificial intelligence models for hyperscale applications. The company has unveiled a range of cutting-edge memory solutions, such as the latest Shinebolt HBM3e memory, the LPDDR5X CAMM2 solutions based on LPDDR package modules, and the detachable AutoSSD that can be conveniently used through storage virtualization. This innovative chip has the potential to revolutionize the future PC and laptop DRAM market.
9. What pricing options are available for accessing the report?
Pricing options include single-user, multi-user, and enterprise licenses priced at USD 4750, USD 5250, and USD 8750 respectively.
10. Is the market size provided in terms of value or volume?
The market size is provided in terms of value, measured in Million.
11. Are there any specific market keywords associated with the report?
Yes, the market keyword associated with the report is "Next Generation Memory Industry," which aids in identifying and referencing the specific market segment covered.
12. How do I determine which pricing option suits my needs best?
The pricing options vary based on user requirements and access needs. Individual users may opt for single-user licenses, while businesses requiring broader access may choose multi-user or enterprise licenses for cost-effective access to the report.
13. Are there any additional resources or data provided in the Next Generation Memory Industry report?
While the report offers comprehensive insights, it's advisable to review the specific contents or supplementary materials provided to ascertain if additional resources or data are available.
14. How can I stay updated on further developments or reports in the Next Generation Memory Industry?
To stay informed about further developments, trends, and reports in the Next Generation Memory Industry, consider subscribing to industry newsletters, following relevant companies and organizations, or regularly checking reputable industry news sources and publications.
Methodology
Step 1 - Identification of Relevant Samples Size from Population Database


Step 2 - Approaches for Defining Global Market Size (Value, Volume* & Price*)

Note*: In applicable scenarios
Step 3 - Data Sources
Primary Research
- Web Analytics
- Survey Reports
- Research Institute
- Latest Research Reports
- Opinion Leaders
Secondary Research
- Annual Reports
- White Paper
- Latest Press Release
- Industry Association
- Paid Database
- Investor Presentations

Step 4 - Data Triangulation
Involves using different sources of information in order to increase the validity of a study
These sources are likely to be stakeholders in a program - participants, other researchers, program staff, other community members, and so on.
Then we put all data in single framework & apply various statistical tools to find out the dynamic on the market.
During the analysis stage, feedback from the stakeholder groups would be compared to determine areas of agreement as well as areas of divergence
