

Key Insights
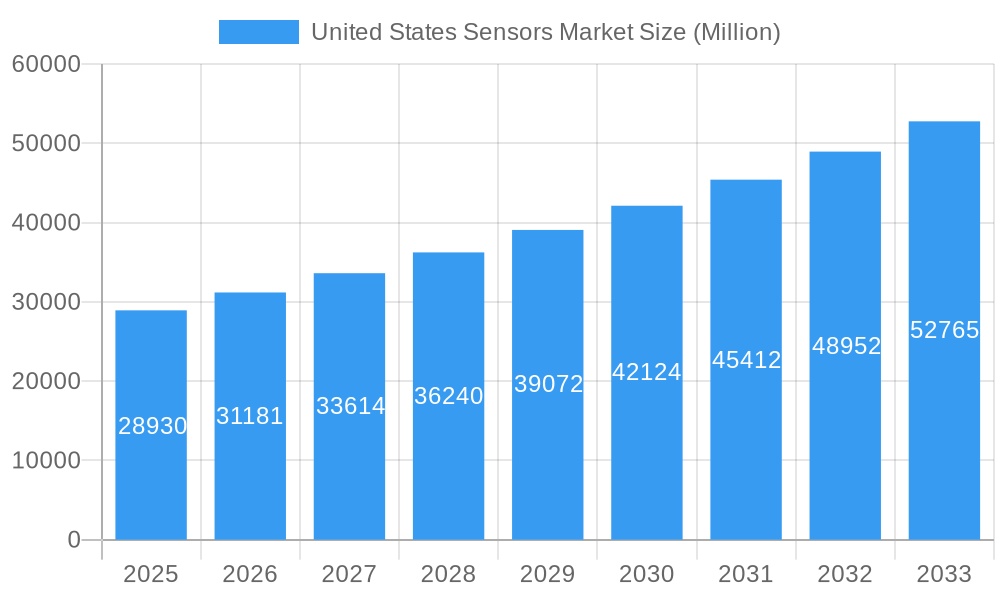
The United States sensors market, valued at $28.93 billion in 2025, is projected to experience robust growth, driven by increasing automation across various sectors, advances in sensor technology leading to enhanced accuracy and miniaturization, and the burgeoning demand for IoT devices. The market's Compound Annual Growth Rate (CAGR) of 7.79% from 2019 to 2024 suggests a consistent upward trajectory, a trend expected to continue through 2033. Key growth drivers include the automotive industry's adoption of advanced driver-assistance systems (ADAS) and autonomous vehicles, the expansion of industrial automation and smart manufacturing initiatives, and the rising integration of sensors in healthcare applications for remote patient monitoring and diagnostics. Furthermore, increasing government investments in infrastructure development and smart city projects are fueling demand for various sensor technologies.
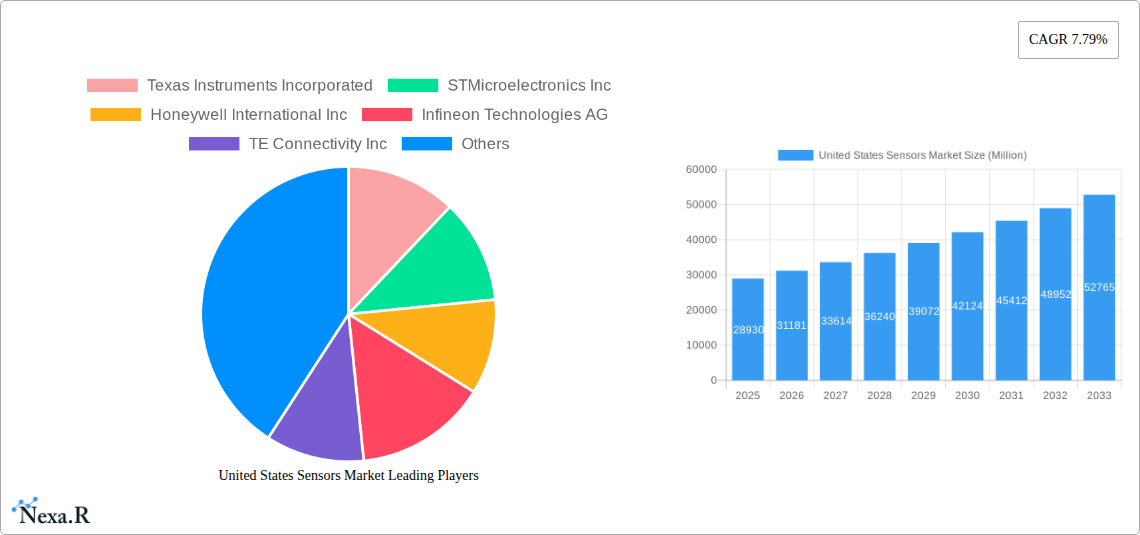
United States Sensors Market Market Size (In Billion)
Despite these positive factors, the market faces certain constraints. Supply chain disruptions and potential increases in raw material costs could impact production and pricing. Additionally, ensuring data security and addressing privacy concerns associated with the vast amounts of data generated by sensor networks presents a significant challenge. However, ongoing technological advancements and the growing adoption of robust cybersecurity measures are mitigating these risks. Major players like Texas Instruments, STMicroelectronics, Honeywell, and Infineon are actively shaping market dynamics through innovation and strategic partnerships, solidifying their positions within this expanding sector. The segmentation of the market (while not explicitly detailed) likely reflects the diverse applications of sensors across industrial, automotive, healthcare, and consumer electronics sectors.
United States Sensors Market Company Market Share
United States Sensors Market: A Comprehensive Report (2019-2033)
This comprehensive report provides a detailed analysis of the United States sensors market, encompassing market dynamics, growth trends, regional segmentation, product landscape, key players, and future outlook. The study period spans from 2019 to 2033, with 2025 serving as the base and estimated year. The report offers invaluable insights for industry professionals, investors, and strategic decision-makers seeking to navigate this rapidly evolving market. The market is segmented by type (e.g., temperature sensors, pressure sensors, proximity sensors, etc.) and application (e.g., automotive, industrial automation, healthcare, etc.). The total market size is projected to reach xx Million units by 2033.
United States Sensors Market Market Dynamics & Structure
The US sensors market exhibits a moderately concentrated structure, with several key players holding significant market share. Technological innovation, driven by advancements in microelectromechanical systems (MEMS) and integrated circuits, fuels market growth. Stringent regulatory frameworks, particularly concerning data privacy and safety standards, influence product development and adoption. The market faces competition from substitute technologies, including image processing and AI-based systems, though sensors remain essential for many applications. The end-user demographics are diverse, spanning automotive, industrial automation, healthcare, consumer electronics, and aerospace. M&A activity is relatively frequent, driven by efforts to expand product portfolios and geographic reach.
- Market Concentration: Moderately concentrated, with top 5 players holding approximately xx% market share in 2024.
- Technological Innovation: MEMS and integrated circuit advancements are key drivers.
- Regulatory Landscape: Stringent regulations regarding data privacy and safety impact product development.
- Competitive Substitutes: Image processing and AI-based systems pose some competitive pressure.
- End-User Demographics: Diverse, including automotive, industrial, healthcare, consumer electronics, and aerospace.
- M&A Activity: Significant M&A activity observed, with xx major deals completed in the last 5 years.
United States Sensors Market Growth Trends & Insights
The US sensors market experienced significant growth during the historical period (2019-2024), driven primarily by increasing automation across various sectors and the proliferation of smart devices. The market size expanded from xx Million units in 2019 to xx Million units in 2024, demonstrating a CAGR of xx%. This growth is anticipated to continue during the forecast period (2025-2033), with adoption rates accelerating across diverse applications, particularly in the industrial IoT (IIoT) and automotive sectors. Technological disruptions, such as the emergence of advanced sensor technologies like LiDAR and the increasing adoption of AI and machine learning in sensor data processing, are further driving growth. Shifting consumer preferences toward smart homes, wearables, and connected cars also positively impact market dynamics.
Dominant Regions, Countries, or Segments in United States Sensors Market
The automotive industry is currently the dominant segment, accounting for approximately xx% of the market share in 2024, driven by the increasing demand for advanced driver-assistance systems (ADAS) and autonomous vehicles. California and Michigan are leading states in terms of market size and growth, benefiting from a strong automotive manufacturing base and supportive technological ecosystem.
Key Drivers:
- High concentration of automotive manufacturers and suppliers.
- Government incentives promoting the adoption of ADAS and autonomous vehicles.
- Significant investments in R&D for sensor technologies.
Dominance Factors:
- High demand for ADAS and autonomous vehicle features.
- Strong technological infrastructure and expertise.
- Government support for technological innovation.
Growth Potential: Continued high growth is expected due to the ongoing shift towards autonomous driving and vehicle electrification.
United States Sensors Market Product Landscape
The US sensors market showcases a diverse product landscape, featuring various types such as temperature, pressure, proximity, and image sensors. Continuous innovations are evident in areas like miniaturization, improved accuracy, enhanced power efficiency, and increased functionality. Advanced sensors, like those using MEMS technology, are gaining prominence due to their compact size, cost-effectiveness, and improved performance. New applications are constantly emerging, including smart agriculture, environmental monitoring, and industrial robotics.
Key Drivers, Barriers & Challenges in United States Sensors Market
Key Drivers:
- The increasing demand for automation across various industries is a major driver.
- Advances in technology, such as MEMS, are improving sensor capabilities.
- Government initiatives supporting the development of smart cities and IoT technologies are also boosting the market.
Challenges & Restraints:
- Supply chain disruptions can impact the availability and cost of sensors.
- High initial investment costs can be a barrier for some companies.
- Concerns about data privacy and security may limit adoption in certain applications. The impact is estimated to reduce market growth by approximately xx% in 2025.
Emerging Opportunities in United States Sensors Market
Untapped markets exist in sectors like smart agriculture, environmental monitoring, and healthcare. Opportunities also exist in the development of highly specialized sensors for niche applications, such as industrial IoT and advanced robotics. Furthermore, integrating AI and machine learning into sensor data analysis will create significant opportunities for enhanced decision-making and automation.
Growth Accelerators in the United States Sensors Market Industry
Technological breakthroughs in sensor materials and manufacturing processes continue to drive innovation and cost reduction. Strategic partnerships between sensor manufacturers and system integrators facilitate faster market penetration. Aggressive expansion strategies, such as geographic diversification and vertical integration, further accelerate market growth.
Key Players Shaping the United States Sensors Market Market
- Texas Instruments Incorporated (Texas Instruments)
- STMicroelectronics Inc (STMicroelectronics)
- Honeywell International Inc (Honeywell)
- Infineon Technologies AG (Infineon)
- TE Connectivity Inc (TE Connectivity)
- Rockwell Automation Inc (Rockwell Automation)
- Bosch Sensortec GmbH (Bosch Sensortec)
- Omega Engineering Inc (Omega Engineering)
- Siemens AG (Siemens)
- ams OSRAM AG (ams OSRAM)
- Sick AG (Sick)
- ABB Limited (ABB)
- Omron Corporation (Omron)
- Allegro MicroSystems Inc (Allegro MicroSystems)
Notable Milestones in United States Sensors Market Sector
- April 2024: TE Connectivity launched two advanced wireless pressure sensors (65xxN and 69xxN) for periodic condition monitoring, utilizing BLE 5.3 technology. This expansion significantly enhances capabilities in remote monitoring applications.
- February 2024: STMicroelectronics introduced a high-resolution 2.3k dToF 3D LiDAR module and secured a design win for a 500k-pixel iToF sensor, demonstrating advancements in 3D sensing technology. These developments significantly impact the capabilities of autonomous vehicles and robotics.
In-Depth United States Sensors Market Market Outlook
The future of the US sensors market appears bright, with continued growth driven by the pervasive adoption of IoT, the expansion of the automotive sector, and ongoing technological advancements. The market offers strategic opportunities for companies focusing on innovation, strategic partnerships, and expansion into high-growth segments such as smart infrastructure and industrial automation. The market is poised for substantial expansion, driven by the increasing demand for intelligent and connected systems across various industries.
United States Sensors Market Segmentation
-
1. Product Type
- 1.1. Temperature
- 1.2. Pressure
- 1.3. Level
- 1.4. Flow
- 1.5. Proximity
- 1.6. Environmental (Humidity, Gas and Combos)
- 1.7. Chemical
- 1.8. Inertial
-
1.9. Magnetic
- 1.9.1. Hall effect sensors
- 1.9.2. Other Magnetic Sensors
- 1.10. Position Sensors
- 1.11. Current Sensors
- 1.12. Other Types
-
2. Mode of Operation
- 2.1. Optical
- 2.2. Electrical Resistance
- 2.3. Biosensor
- 2.4. Piezoresistive
- 2.5. Image
- 2.6. Capacitive
- 2.7. Piezoelectric
- 2.8. LiDAR
- 2.9. Radar
- 2.10. Other Modes of Operations
-
3. End-user Industry
- 3.1. Automotive
- 3.2. Consumer Electronics
- 3.3. Energy
- 3.4. Industrial and Other
- 3.5. Medical and Wellness
- 3.6. Construction, Agriculture and Mining
- 3.7. Aerospace
- 3.8. Robotics
- 3.9. Other End-user Industries
United States Sensors Market Segmentation By Geography
- 1. United States
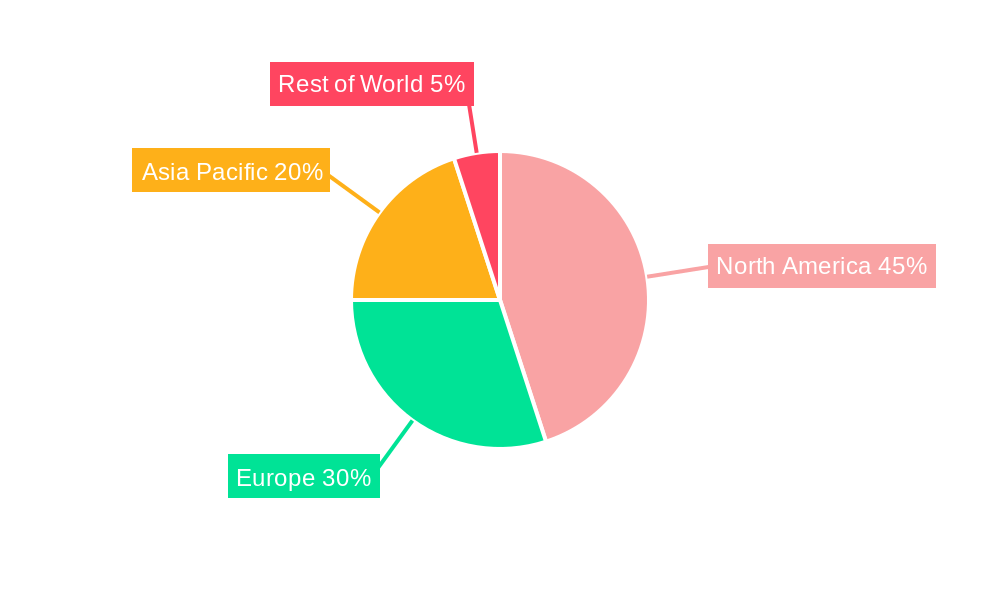
United States Sensors Market Regional Market Share
Geographic Coverage of United States Sensors Market
United States Sensors Market REPORT HIGHLIGHTS
| Aspects | Details |
|---|---|
| Study Period | 2020-2034 |
| Base Year | 2025 |
| Estimated Year | 2026 |
| Forecast Period | 2026-2034 |
| Historical Period | 2020-2025 |
| Growth Rate | CAGR of 7.79% from 2020-2034 |
| Segmentation |
|
Table of Contents
- 1. Introduction
- 1.1. Research Scope
- 1.2. Market Segmentation
- 1.3. Research Methodology
- 1.4. Definitions and Assumptions
- 2. Executive Summary
- 2.1. Introduction
- 3. Market Dynamics
- 3.1. Introduction
- 3.2. Market Drivers
- 3.2.1. Rising Demand for IoT and Connected Devices; Increasing Adoption of Advanced Sensor Technologies in Automotive Industry
- 3.3. Market Restrains
- 3.3.1. Rising Demand for IoT and Connected Devices; Increasing Adoption of Advanced Sensor Technologies in Automotive Industry
- 3.4. Market Trends
- 3.4.1. Environmental Sensors is Expected to Witness a Significant Growth
- 4. Market Factor Analysis
- 4.1. Porters Five Forces
- 4.2. Supply/Value Chain
- 4.3. PESTEL analysis
- 4.4. Market Entropy
- 4.5. Patent/Trademark Analysis
- 5. United States Sensors Market Analysis, Insights and Forecast, 2020-2032
- 5.1. Market Analysis, Insights and Forecast - by Product Type
- 5.1.1. Temperature
- 5.1.2. Pressure
- 5.1.3. Level
- 5.1.4. Flow
- 5.1.5. Proximity
- 5.1.6. Environmental (Humidity, Gas and Combos)
- 5.1.7. Chemical
- 5.1.8. Inertial
- 5.1.9. Magnetic
- 5.1.9.1. Hall effect sensors
- 5.1.9.2. Other Magnetic Sensors
- 5.1.10. Position Sensors
- 5.1.11. Current Sensors
- 5.1.12. Other Types
- 5.2. Market Analysis, Insights and Forecast - by Mode of Operation
- 5.2.1. Optical
- 5.2.2. Electrical Resistance
- 5.2.3. Biosensor
- 5.2.4. Piezoresistive
- 5.2.5. Image
- 5.2.6. Capacitive
- 5.2.7. Piezoelectric
- 5.2.8. LiDAR
- 5.2.9. Radar
- 5.2.10. Other Modes of Operations
- 5.3. Market Analysis, Insights and Forecast - by End-user Industry
- 5.3.1. Automotive
- 5.3.2. Consumer Electronics
- 5.3.3. Energy
- 5.3.4. Industrial and Other
- 5.3.5. Medical and Wellness
- 5.3.6. Construction, Agriculture and Mining
- 5.3.7. Aerospace
- 5.3.8. Robotics
- 5.3.9. Other End-user Industries
- 5.4. Market Analysis, Insights and Forecast - by Region
- 5.4.1. United States
- 5.1. Market Analysis, Insights and Forecast - by Product Type
- 6. Competitive Analysis
- 6.1. Market Share Analysis 2025
- 6.2. Company Profiles
- 6.2.1 Texas Instruments Incorporated
- 6.2.1.1. Overview
- 6.2.1.2. Products
- 6.2.1.3. SWOT Analysis
- 6.2.1.4. Recent Developments
- 6.2.1.5. Financials (Based on Availability)
- 6.2.2 STMicroelectronics Inc
- 6.2.2.1. Overview
- 6.2.2.2. Products
- 6.2.2.3. SWOT Analysis
- 6.2.2.4. Recent Developments
- 6.2.2.5. Financials (Based on Availability)
- 6.2.3 Honeywell International Inc
- 6.2.3.1. Overview
- 6.2.3.2. Products
- 6.2.3.3. SWOT Analysis
- 6.2.3.4. Recent Developments
- 6.2.3.5. Financials (Based on Availability)
- 6.2.4 Infineon Technologies AG
- 6.2.4.1. Overview
- 6.2.4.2. Products
- 6.2.4.3. SWOT Analysis
- 6.2.4.4. Recent Developments
- 6.2.4.5. Financials (Based on Availability)
- 6.2.5 TE Connectivity Inc
- 6.2.5.1. Overview
- 6.2.5.2. Products
- 6.2.5.3. SWOT Analysis
- 6.2.5.4. Recent Developments
- 6.2.5.5. Financials (Based on Availability)
- 6.2.6 Rockwell Automation Inc
- 6.2.6.1. Overview
- 6.2.6.2. Products
- 6.2.6.3. SWOT Analysis
- 6.2.6.4. Recent Developments
- 6.2.6.5. Financials (Based on Availability)
- 6.2.7 Bosch Sensortec GmbH
- 6.2.7.1. Overview
- 6.2.7.2. Products
- 6.2.7.3. SWOT Analysis
- 6.2.7.4. Recent Developments
- 6.2.7.5. Financials (Based on Availability)
- 6.2.8 Omega Engineering Inc
- 6.2.8.1. Overview
- 6.2.8.2. Products
- 6.2.8.3. SWOT Analysis
- 6.2.8.4. Recent Developments
- 6.2.8.5. Financials (Based on Availability)
- 6.2.9 Siemens AG
- 6.2.9.1. Overview
- 6.2.9.2. Products
- 6.2.9.3. SWOT Analysis
- 6.2.9.4. Recent Developments
- 6.2.9.5. Financials (Based on Availability)
- 6.2.10 ams OSRAM AG
- 6.2.10.1. Overview
- 6.2.10.2. Products
- 6.2.10.3. SWOT Analysis
- 6.2.10.4. Recent Developments
- 6.2.10.5. Financials (Based on Availability)
- 6.2.11 Sick AG
- 6.2.11.1. Overview
- 6.2.11.2. Products
- 6.2.11.3. SWOT Analysis
- 6.2.11.4. Recent Developments
- 6.2.11.5. Financials (Based on Availability)
- 6.2.12 ABB Limited
- 6.2.12.1. Overview
- 6.2.12.2. Products
- 6.2.12.3. SWOT Analysis
- 6.2.12.4. Recent Developments
- 6.2.12.5. Financials (Based on Availability)
- 6.2.13 Omron Corporation
- 6.2.13.1. Overview
- 6.2.13.2. Products
- 6.2.13.3. SWOT Analysis
- 6.2.13.4. Recent Developments
- 6.2.13.5. Financials (Based on Availability)
- 6.2.14 Allegro MicroSystems Inc
- 6.2.14.1. Overview
- 6.2.14.2. Products
- 6.2.14.3. SWOT Analysis
- 6.2.14.4. Recent Developments
- 6.2.14.5. Financials (Based on Availability)
- 6.2.1 Texas Instruments Incorporated
List of Figures
- Figure 1: United States Sensors Market Revenue Breakdown (Million, %) by Product 2025 & 2033
- Figure 2: United States Sensors Market Share (%) by Company 2025
List of Tables
- Table 1: United States Sensors Market Revenue Million Forecast, by Product Type 2020 & 2033
- Table 2: United States Sensors Market Volume Billion Forecast, by Product Type 2020 & 2033
- Table 3: United States Sensors Market Revenue Million Forecast, by Mode of Operation 2020 & 2033
- Table 4: United States Sensors Market Volume Billion Forecast, by Mode of Operation 2020 & 2033
- Table 5: United States Sensors Market Revenue Million Forecast, by End-user Industry 2020 & 2033
- Table 6: United States Sensors Market Volume Billion Forecast, by End-user Industry 2020 & 2033
- Table 7: United States Sensors Market Revenue Million Forecast, by Region 2020 & 2033
- Table 8: United States Sensors Market Volume Billion Forecast, by Region 2020 & 2033
- Table 9: United States Sensors Market Revenue Million Forecast, by Product Type 2020 & 2033
- Table 10: United States Sensors Market Volume Billion Forecast, by Product Type 2020 & 2033
- Table 11: United States Sensors Market Revenue Million Forecast, by Mode of Operation 2020 & 2033
- Table 12: United States Sensors Market Volume Billion Forecast, by Mode of Operation 2020 & 2033
- Table 13: United States Sensors Market Revenue Million Forecast, by End-user Industry 2020 & 2033
- Table 14: United States Sensors Market Volume Billion Forecast, by End-user Industry 2020 & 2033
- Table 15: United States Sensors Market Revenue Million Forecast, by Country 2020 & 2033
- Table 16: United States Sensors Market Volume Billion Forecast, by Country 2020 & 2033
Frequently Asked Questions
1. What is the projected Compound Annual Growth Rate (CAGR) of the United States Sensors Market?
The projected CAGR is approximately 7.79%.
2. Which companies are prominent players in the United States Sensors Market?
Key companies in the market include Texas Instruments Incorporated, STMicroelectronics Inc, Honeywell International Inc, Infineon Technologies AG, TE Connectivity Inc, Rockwell Automation Inc, Bosch Sensortec GmbH, Omega Engineering Inc, Siemens AG, ams OSRAM AG, Sick AG, ABB Limited, Omron Corporation, Allegro MicroSystems Inc.
3. What are the main segments of the United States Sensors Market?
The market segments include Product Type, Mode of Operation, End-user Industry.
4. Can you provide details about the market size?
The market size is estimated to be USD 28.93 Million as of 2022.
5. What are some drivers contributing to market growth?
Rising Demand for IoT and Connected Devices; Increasing Adoption of Advanced Sensor Technologies in Automotive Industry.
6. What are the notable trends driving market growth?
Environmental Sensors is Expected to Witness a Significant Growth.
7. Are there any restraints impacting market growth?
Rising Demand for IoT and Connected Devices; Increasing Adoption of Advanced Sensor Technologies in Automotive Industry.
8. Can you provide examples of recent developments in the market?
April 2024: TE Connectivity (TE) has expanded its product line by introducing two advanced wireless pressure sensors. The first, the 65xxN sensor, is tailored for short-range applications, while the second, the 69xxN sensor, is optimized for long-range coverage. Both sensors are crafted explicitly for periodic condition monitoring. Notably, the 65xxN sensor utilizes BLE (Bluetooth Low Energy) 5.3 technology, enabling seamless localized data collection and transmission. The 65xxN wireless pressure sensor leverages BLE technology for efficient battery performance and adaptability across diverse pressure conditions.
9. What pricing options are available for accessing the report?
Pricing options include single-user, multi-user, and enterprise licenses priced at USD 3800, USD 4500, and USD 5800 respectively.
10. Is the market size provided in terms of value or volume?
The market size is provided in terms of value, measured in Million and volume, measured in Billion.
11. Are there any specific market keywords associated with the report?
Yes, the market keyword associated with the report is "United States Sensors Market," which aids in identifying and referencing the specific market segment covered.
12. How do I determine which pricing option suits my needs best?
The pricing options vary based on user requirements and access needs. Individual users may opt for single-user licenses, while businesses requiring broader access may choose multi-user or enterprise licenses for cost-effective access to the report.
13. Are there any additional resources or data provided in the United States Sensors Market report?
While the report offers comprehensive insights, it's advisable to review the specific contents or supplementary materials provided to ascertain if additional resources or data are available.
14. How can I stay updated on further developments or reports in the United States Sensors Market?
To stay informed about further developments, trends, and reports in the United States Sensors Market, consider subscribing to industry newsletters, following relevant companies and organizations, or regularly checking reputable industry news sources and publications.
Methodology
Step 1 - Identification of Relevant Samples Size from Population Database


Step 2 - Approaches for Defining Global Market Size (Value, Volume* & Price*)

Note*: In applicable scenarios
Step 3 - Data Sources
Primary Research
- Web Analytics
- Survey Reports
- Research Institute
- Latest Research Reports
- Opinion Leaders
Secondary Research
- Annual Reports
- White Paper
- Latest Press Release
- Industry Association
- Paid Database
- Investor Presentations

Step 4 - Data Triangulation
Involves using different sources of information in order to increase the validity of a study
These sources are likely to be stakeholders in a program - participants, other researchers, program staff, other community members, and so on.
Then we put all data in single framework & apply various statistical tools to find out the dynamic on the market.
During the analysis stage, feedback from the stakeholder groups would be compared to determine areas of agreement as well as areas of divergence