

Key Insights
The global power amplifier market is projected for significant expansion, propelled by escalating demand for high-performance electronics across diverse industries. The market, valued at approximately 31.2 billion in the 2025 base year, is forecasted to grow at a compound annual growth rate (CAGR) of 6.2% from 2025 to 2033. This growth is underpinned by critical drivers: the widespread deployment of 5G infrastructure requiring efficient, high-power amplifiers in telecommunications; the rapid adoption of advanced driver-assistance systems (ADAS) and electric vehicles (EVs) within the automotive sector; and the increasing consumer appetite for high-fidelity audio and enhanced connectivity. Furthermore, industrial automation and the reliance on advanced instrumentation are substantial contributors to market growth. Leading companies like Infineon Technologies AG, Broadcom Limited, and NXP Semiconductor are spearheading innovation in power amplifier design and production.
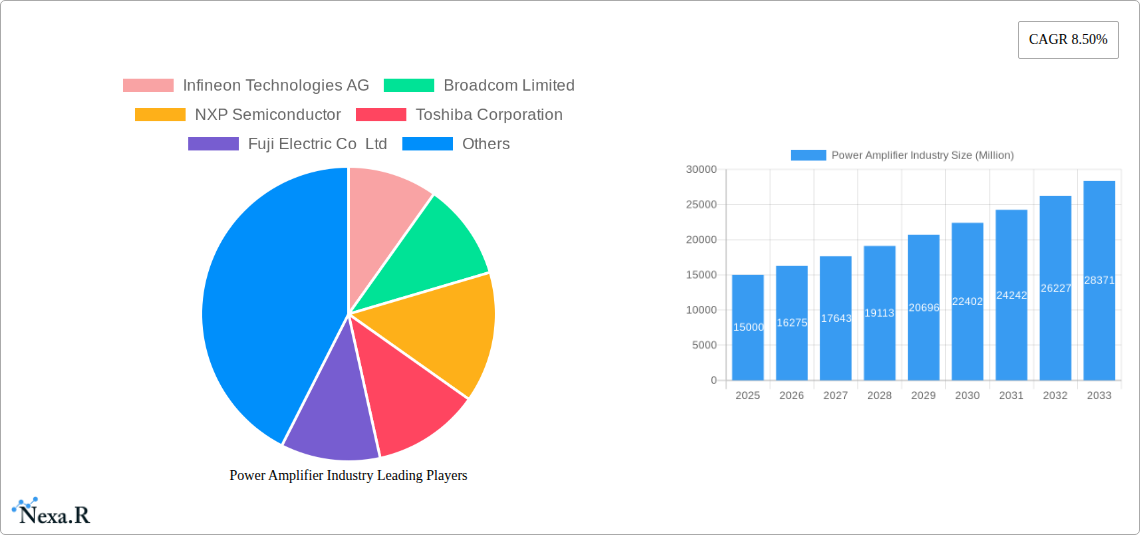
Power Amplifier Industry Market Size (In Billion)
Despite positive growth prospects, the market encounters hurdles. High research and development expenditures and stringent regulations concerning power efficiency and electromagnetic interference (EMI) present challenges. Intense competition from established entities and new market entrants may impact pricing and profitability. Nonetheless, the long-term trajectory of the power amplifier market remains optimistic, fueled by ongoing technological innovation, expanding application horizons, and increased investment in R&D to enhance efficiency and performance. Market segmentation indicates that consumer electronics and telecommunications currently lead, with automotive and industrial sectors poised for substantial growth. Geographically, North America and Asia Pacific represent the largest markets, with Asia Pacific, particularly China and other emerging economies, expected to drive continued robust growth.
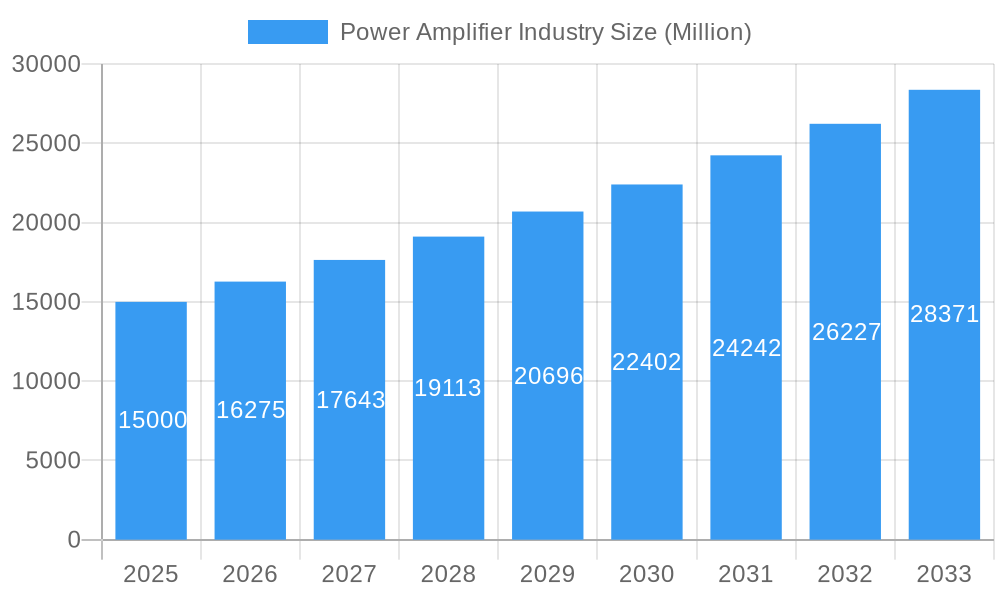
Power Amplifier Industry Company Market Share
Power Amplifier Industry Market Report: 2019-2033
This comprehensive report provides an in-depth analysis of the Power Amplifier industry, encompassing market dynamics, growth trends, regional segmentation, product landscape, and key players. The report covers the period 2019-2033, with a focus on the forecast period 2025-2033 and a base year of 2025. The analysis includes both parent market (Semiconductor industry) and child market (Power Amplifier) perspectives for a holistic understanding. Market size values are presented in million units.
Power Amplifier Industry Market Dynamics & Structure
The Power Amplifier market is characterized by a moderately concentrated landscape with several key players holding significant market share. Technological innovation, particularly in GaN and SiC technologies, is a major driver, pushing efficiency and performance improvements. Stringent regulatory frameworks regarding energy efficiency and electromagnetic interference (EMI) influence product development and adoption. Competitive pressures from substitute technologies (e.g., alternative amplification methods) necessitate continuous innovation. The market witnesses substantial M&A activity, reflecting consolidation efforts and expansion strategies. End-user demographics shift towards increased demand from the telecommunications and automotive sectors.
- Market Concentration: Top 5 players hold approximately xx% of the market share in 2025 (estimated).
- Technological Innovation: Significant investments in GaN and SiC power amplifier development.
- M&A Activity: xx major M&A deals recorded between 2019 and 2024.
- Regulatory Landscape: Compliance with energy efficiency standards (e.g., EU Ecodesign Directive) is crucial.
- Substitute Technologies: Competition from alternative amplification technologies is increasing, albeit slowly.
Power Amplifier Industry Growth Trends & Insights
The Power Amplifier market experienced significant growth during the historical period (2019-2024), driven by increasing demand across various industry verticals. The market size reached xx million units in 2024 and is projected to reach xx million units by 2033, exhibiting a CAGR of xx% during the forecast period. This growth is fueled by the rising adoption of 5G technology, the proliferation of smart devices, and the expansion of the automotive and industrial sectors. Technological disruptions, such as the adoption of GaN technology, are further accelerating market growth. Consumer behavior shifts towards higher power efficiency and improved performance are creating opportunities for advanced power amplifier solutions.
Dominant Regions, Countries, or Segments in Power Amplifier Industry
The Telecommunication segment currently holds the largest market share, driven by the rapid deployment of 5G networks globally. North America and Asia-Pacific are leading regional markets, with strong demand from both consumer electronics and telecommunications sectors. China is a key growth driver in Asia-Pacific, fueled by robust economic growth and government initiatives promoting technological advancement. Europe also shows steady growth, driven by the expanding automotive and industrial sectors.
- Key Drivers in Telecommunication Segment:
- Deployment of 5G networks.
- Increasing demand for high-speed data connectivity.
- Growth in smartphone and mobile device adoption.
- Key Drivers in North America:
- Strong investment in technological infrastructure.
- High adoption rates of advanced consumer electronics.
- Key Drivers in Asia-Pacific:
- Rapid economic growth and industrialization.
- Government support for technological development.
Power Amplifier Industry Product Landscape
Power amplifier technology is continuously evolving, with innovations focusing on enhanced efficiency, power output, and linearity. GaN and SiC-based power amplifiers are gaining traction due to their superior performance compared to traditional silicon-based solutions. These advancements cater to diverse applications, from mobile devices and base stations to automotive radar systems and industrial automation. Unique selling propositions (USPs) are centered around power efficiency, size reduction, and improved signal quality.
Key Drivers, Barriers & Challenges in Power Amplifier Industry
Key Drivers: The increasing demand for higher data rates and power efficiency in wireless communication systems, alongside the growing adoption of electric vehicles and smart devices, fuels market growth. Technological advancements in GaN and SiC are further accelerating the market. Government incentives promoting energy efficiency play a significant role.
Key Challenges: The high cost of GaN and SiC power amplifiers compared to silicon-based solutions presents a barrier to wider adoption. Supply chain disruptions and geopolitical factors can impact component availability. Stringent regulatory requirements related to safety and electromagnetic compatibility add to the complexity of product development. Intense competition among established players and emerging companies further challenges market participants.
Emerging Opportunities in Power Amplifier Industry
Emerging opportunities include the expansion into untapped markets (e.g., IoT devices, satellite communication), the development of highly integrated power amplifier modules, and the application of AI/ML for optimized power amplifier design and control. Growing consumer demand for energy-efficient and high-performance electronics creates further opportunities for advanced power amplifier solutions.
Growth Accelerators in the Power Amplifier Industry Industry
Technological breakthroughs in wide bandgap semiconductors (GaN, SiC) and advancements in packaging technologies are key growth catalysts. Strategic partnerships between semiconductor companies and equipment manufacturers are driving innovation. Market expansion into new applications such as renewable energy infrastructure and advanced driver-assistance systems (ADAS) is fuelling further growth.
Key Players Shaping the Power Amplifier Industry Market
Notable Milestones in Power Amplifier Industry Sector
- 2020: Introduction of the first commercially available GaN-based 5G power amplifier by xx company.
- 2021: Strategic partnership between xx and xx company to develop advanced power amplifier solutions for electric vehicles.
- 2022: Acquisition of xx company by xx company, expanding its portfolio in power amplifier technology.
- 2023: Launch of a new high-efficiency SiC-based power amplifier for industrial applications by xx company.
- 2024: Announcment of a new standard for power amplifier efficiency by the global standards organization xx.
In-Depth Power Amplifier Industry Market Outlook
The Power Amplifier market is poised for sustained growth driven by ongoing technological innovation, expanding applications across various sectors, and favorable regulatory frameworks promoting energy efficiency. The increased adoption of 5G, the growth of the electric vehicle market, and the rise of IoT applications will create significant opportunities for power amplifier manufacturers. Strategic partnerships, investments in R&D, and market diversification strategies will be crucial for players to capitalize on future market potential.
Power Amplifier Industry Segmentation
-
1. Industry Vertical
- 1.1. Consumer Electronics
- 1.2. Industrial
- 1.3. Telecommunication
- 1.4. Automotive
- 1.5. Other Industry Vertical
Power Amplifier Industry Segmentation By Geography
-
1. North America
- 1.1. United States
- 1.2. Canada
-
2. Europe
- 2.1. Germany
- 2.2. United Kingdom
- 2.3. France
- 2.4. Rest of Europe
-
3. Asia Pacific
- 3.1. China
- 3.2. Japan
- 3.3. South Korea
- 3.4. Rest of Asia Pacific
- 4. Rest of the World
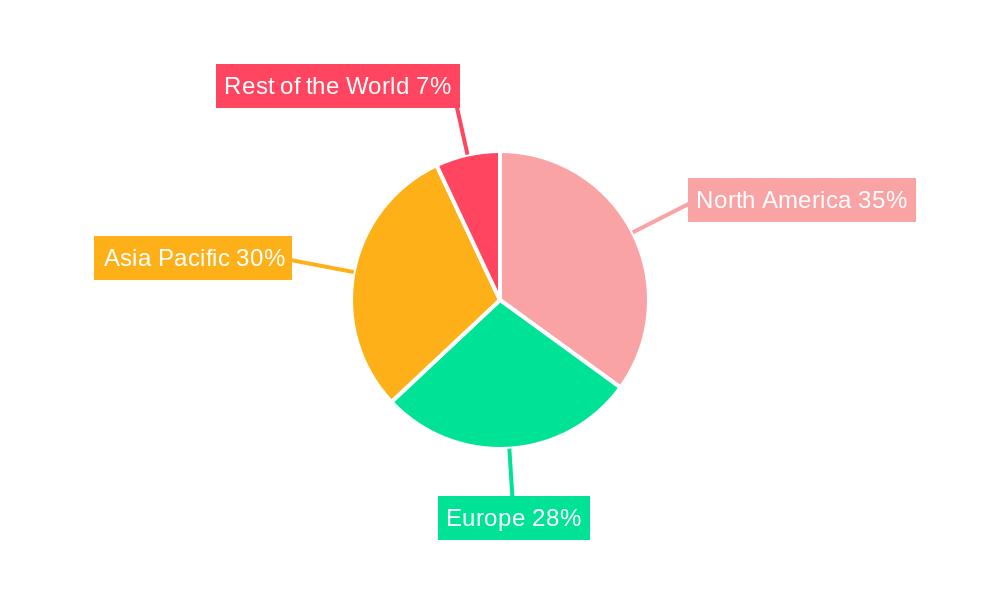
Power Amplifier Industry Regional Market Share
Geographic Coverage of Power Amplifier Industry
Power Amplifier Industry REPORT HIGHLIGHTS
| Aspects | Details |
|---|---|
| Study Period | 2020-2034 |
| Base Year | 2025 |
| Estimated Year | 2026 |
| Forecast Period | 2026-2034 |
| Historical Period | 2020-2025 |
| Growth Rate | CAGR of 6.2% from 2020-2034 |
| Segmentation |
|
Table of Contents
- 1. Introduction
- 1.1. Research Scope
- 1.2. Market Segmentation
- 1.3. Research Methodology
- 1.4. Definitions and Assumptions
- 2. Executive Summary
- 2.1. Introduction
- 3. Market Dynamics
- 3.1. Introduction
- 3.2. Market Drivers
- 3.2.1. ; Augmented Demand for Consumer Electronics; Growing Transition toward 5G and Long-term Evolution (LTE) Implementation
- 3.3. Market Restrains
- 3.3.1. ; Deminished Price Margin
- 3.4. Market Trends
- 3.4.1. Consumer Electronics Sector to Offer Potential Growth Opportunities
- 4. Market Factor Analysis
- 4.1. Porters Five Forces
- 4.2. Supply/Value Chain
- 4.3. PESTEL analysis
- 4.4. Market Entropy
- 4.5. Patent/Trademark Analysis
- 5. Global Power Amplifier Industry Analysis, Insights and Forecast, 2020-2032
- 5.1. Market Analysis, Insights and Forecast - by Industry Vertical
- 5.1.1. Consumer Electronics
- 5.1.2. Industrial
- 5.1.3. Telecommunication
- 5.1.4. Automotive
- 5.1.5. Other Industry Vertical
- 5.2. Market Analysis, Insights and Forecast - by Region
- 5.2.1. North America
- 5.2.2. Europe
- 5.2.3. Asia Pacific
- 5.2.4. Rest of the World
- 5.1. Market Analysis, Insights and Forecast - by Industry Vertical
- 6. North America Power Amplifier Industry Analysis, Insights and Forecast, 2020-2032
- 6.1. Market Analysis, Insights and Forecast - by Industry Vertical
- 6.1.1. Consumer Electronics
- 6.1.2. Industrial
- 6.1.3. Telecommunication
- 6.1.4. Automotive
- 6.1.5. Other Industry Vertical
- 6.1. Market Analysis, Insights and Forecast - by Industry Vertical
- 7. Europe Power Amplifier Industry Analysis, Insights and Forecast, 2020-2032
- 7.1. Market Analysis, Insights and Forecast - by Industry Vertical
- 7.1.1. Consumer Electronics
- 7.1.2. Industrial
- 7.1.3. Telecommunication
- 7.1.4. Automotive
- 7.1.5. Other Industry Vertical
- 7.1. Market Analysis, Insights and Forecast - by Industry Vertical
- 8. Asia Pacific Power Amplifier Industry Analysis, Insights and Forecast, 2020-2032
- 8.1. Market Analysis, Insights and Forecast - by Industry Vertical
- 8.1.1. Consumer Electronics
- 8.1.2. Industrial
- 8.1.3. Telecommunication
- 8.1.4. Automotive
- 8.1.5. Other Industry Vertical
- 8.1. Market Analysis, Insights and Forecast - by Industry Vertical
- 9. Rest of the World Power Amplifier Industry Analysis, Insights and Forecast, 2020-2032
- 9.1. Market Analysis, Insights and Forecast - by Industry Vertical
- 9.1.1. Consumer Electronics
- 9.1.2. Industrial
- 9.1.3. Telecommunication
- 9.1.4. Automotive
- 9.1.5. Other Industry Vertical
- 9.1. Market Analysis, Insights and Forecast - by Industry Vertical
- 10. Competitive Analysis
- 10.1. Global Market Share Analysis 2025
- 10.2. Company Profiles
- 10.2.1 Infineon Technologies AG
- 10.2.1.1. Overview
- 10.2.1.2. Products
- 10.2.1.3. SWOT Analysis
- 10.2.1.4. Recent Developments
- 10.2.1.5. Financials (Based on Availability)
- 10.2.2 Broadcom Limited
- 10.2.2.1. Overview
- 10.2.2.2. Products
- 10.2.2.3. SWOT Analysis
- 10.2.2.4. Recent Developments
- 10.2.2.5. Financials (Based on Availability)
- 10.2.3 NXP Semiconductor
- 10.2.3.1. Overview
- 10.2.3.2. Products
- 10.2.3.3. SWOT Analysis
- 10.2.3.4. Recent Developments
- 10.2.3.5. Financials (Based on Availability)
- 10.2.4 Toshiba Corporation
- 10.2.4.1. Overview
- 10.2.4.2. Products
- 10.2.4.3. SWOT Analysis
- 10.2.4.4. Recent Developments
- 10.2.4.5. Financials (Based on Availability)
- 10.2.5 Fuji Electric Co Ltd
- 10.2.5.1. Overview
- 10.2.5.2. Products
- 10.2.5.3. SWOT Analysis
- 10.2.5.4. Recent Developments
- 10.2.5.5. Financials (Based on Availability)
- 10.2.6 Maxim Integrated
- 10.2.6.1. Overview
- 10.2.6.2. Products
- 10.2.6.3. SWOT Analysis
- 10.2.6.4. Recent Developments
- 10.2.6.5. Financials (Based on Availability)
- 10.2.7 Murata Manufacturing Co Ltd*List Not Exhaustive
- 10.2.7.1. Overview
- 10.2.7.2. Products
- 10.2.7.3. SWOT Analysis
- 10.2.7.4. Recent Developments
- 10.2.7.5. Financials (Based on Availability)
- 10.2.8 Mitsubishi Electric Corporation
- 10.2.8.1. Overview
- 10.2.8.2. Products
- 10.2.8.3. SWOT Analysis
- 10.2.8.4. Recent Developments
- 10.2.8.5. Financials (Based on Availability)
- 10.2.9 Qorvo Inc
- 10.2.9.1. Overview
- 10.2.9.2. Products
- 10.2.9.3. SWOT Analysis
- 10.2.9.4. Recent Developments
- 10.2.9.5. Financials (Based on Availability)
- 10.2.10 Texas Instruments Incorporated
- 10.2.10.1. Overview
- 10.2.10.2. Products
- 10.2.10.3. SWOT Analysis
- 10.2.10.4. Recent Developments
- 10.2.10.5. Financials (Based on Availability)
- 10.2.11 Analog Devices Inc
- 10.2.11.1. Overview
- 10.2.11.2. Products
- 10.2.11.3. SWOT Analysis
- 10.2.11.4. Recent Developments
- 10.2.11.5. Financials (Based on Availability)
- 10.2.12 Stmicroelectronics NV
- 10.2.12.1. Overview
- 10.2.12.2. Products
- 10.2.12.3. SWOT Analysis
- 10.2.12.4. Recent Developments
- 10.2.12.5. Financials (Based on Availability)
- 10.2.1 Infineon Technologies AG
List of Figures
- Figure 1: Global Power Amplifier Industry Revenue Breakdown (billion, %) by Region 2025 & 2033
- Figure 2: North America Power Amplifier Industry Revenue (billion), by Industry Vertical 2025 & 2033
- Figure 3: North America Power Amplifier Industry Revenue Share (%), by Industry Vertical 2025 & 2033
- Figure 4: North America Power Amplifier Industry Revenue (billion), by Country 2025 & 2033
- Figure 5: North America Power Amplifier Industry Revenue Share (%), by Country 2025 & 2033
- Figure 6: Europe Power Amplifier Industry Revenue (billion), by Industry Vertical 2025 & 2033
- Figure 7: Europe Power Amplifier Industry Revenue Share (%), by Industry Vertical 2025 & 2033
- Figure 8: Europe Power Amplifier Industry Revenue (billion), by Country 2025 & 2033
- Figure 9: Europe Power Amplifier Industry Revenue Share (%), by Country 2025 & 2033
- Figure 10: Asia Pacific Power Amplifier Industry Revenue (billion), by Industry Vertical 2025 & 2033
- Figure 11: Asia Pacific Power Amplifier Industry Revenue Share (%), by Industry Vertical 2025 & 2033
- Figure 12: Asia Pacific Power Amplifier Industry Revenue (billion), by Country 2025 & 2033
- Figure 13: Asia Pacific Power Amplifier Industry Revenue Share (%), by Country 2025 & 2033
- Figure 14: Rest of the World Power Amplifier Industry Revenue (billion), by Industry Vertical 2025 & 2033
- Figure 15: Rest of the World Power Amplifier Industry Revenue Share (%), by Industry Vertical 2025 & 2033
- Figure 16: Rest of the World Power Amplifier Industry Revenue (billion), by Country 2025 & 2033
- Figure 17: Rest of the World Power Amplifier Industry Revenue Share (%), by Country 2025 & 2033
List of Tables
- Table 1: Global Power Amplifier Industry Revenue billion Forecast, by Industry Vertical 2020 & 2033
- Table 2: Global Power Amplifier Industry Revenue billion Forecast, by Region 2020 & 2033
- Table 3: Global Power Amplifier Industry Revenue billion Forecast, by Industry Vertical 2020 & 2033
- Table 4: Global Power Amplifier Industry Revenue billion Forecast, by Country 2020 & 2033
- Table 5: United States Power Amplifier Industry Revenue (billion) Forecast, by Application 2020 & 2033
- Table 6: Canada Power Amplifier Industry Revenue (billion) Forecast, by Application 2020 & 2033
- Table 7: Global Power Amplifier Industry Revenue billion Forecast, by Industry Vertical 2020 & 2033
- Table 8: Global Power Amplifier Industry Revenue billion Forecast, by Country 2020 & 2033
- Table 9: Germany Power Amplifier Industry Revenue (billion) Forecast, by Application 2020 & 2033
- Table 10: United Kingdom Power Amplifier Industry Revenue (billion) Forecast, by Application 2020 & 2033
- Table 11: France Power Amplifier Industry Revenue (billion) Forecast, by Application 2020 & 2033
- Table 12: Rest of Europe Power Amplifier Industry Revenue (billion) Forecast, by Application 2020 & 2033
- Table 13: Global Power Amplifier Industry Revenue billion Forecast, by Industry Vertical 2020 & 2033
- Table 14: Global Power Amplifier Industry Revenue billion Forecast, by Country 2020 & 2033
- Table 15: China Power Amplifier Industry Revenue (billion) Forecast, by Application 2020 & 2033
- Table 16: Japan Power Amplifier Industry Revenue (billion) Forecast, by Application 2020 & 2033
- Table 17: South Korea Power Amplifier Industry Revenue (billion) Forecast, by Application 2020 & 2033
- Table 18: Rest of Asia Pacific Power Amplifier Industry Revenue (billion) Forecast, by Application 2020 & 2033
- Table 19: Global Power Amplifier Industry Revenue billion Forecast, by Industry Vertical 2020 & 2033
- Table 20: Global Power Amplifier Industry Revenue billion Forecast, by Country 2020 & 2033
Frequently Asked Questions
1. What is the projected Compound Annual Growth Rate (CAGR) of the Power Amplifier Industry?
The projected CAGR is approximately 6.2%.
2. Which companies are prominent players in the Power Amplifier Industry?
Key companies in the market include Infineon Technologies AG, Broadcom Limited, NXP Semiconductor, Toshiba Corporation, Fuji Electric Co Ltd, Maxim Integrated, Murata Manufacturing Co Ltd*List Not Exhaustive, Mitsubishi Electric Corporation, Qorvo Inc, Texas Instruments Incorporated, Analog Devices Inc, Stmicroelectronics NV.
3. What are the main segments of the Power Amplifier Industry?
The market segments include Industry Vertical.
4. Can you provide details about the market size?
The market size is estimated to be USD 31.2 billion as of 2022.
5. What are some drivers contributing to market growth?
; Augmented Demand for Consumer Electronics; Growing Transition toward 5G and Long-term Evolution (LTE) Implementation.
6. What are the notable trends driving market growth?
Consumer Electronics Sector to Offer Potential Growth Opportunities.
7. Are there any restraints impacting market growth?
; Deminished Price Margin.
8. Can you provide examples of recent developments in the market?
N/A
9. What pricing options are available for accessing the report?
Pricing options include single-user, multi-user, and enterprise licenses priced at USD 4750, USD 5250, and USD 8750 respectively.
10. Is the market size provided in terms of value or volume?
The market size is provided in terms of value, measured in billion.
11. Are there any specific market keywords associated with the report?
Yes, the market keyword associated with the report is "Power Amplifier Industry," which aids in identifying and referencing the specific market segment covered.
12. How do I determine which pricing option suits my needs best?
The pricing options vary based on user requirements and access needs. Individual users may opt for single-user licenses, while businesses requiring broader access may choose multi-user or enterprise licenses for cost-effective access to the report.
13. Are there any additional resources or data provided in the Power Amplifier Industry report?
While the report offers comprehensive insights, it's advisable to review the specific contents or supplementary materials provided to ascertain if additional resources or data are available.
14. How can I stay updated on further developments or reports in the Power Amplifier Industry?
To stay informed about further developments, trends, and reports in the Power Amplifier Industry, consider subscribing to industry newsletters, following relevant companies and organizations, or regularly checking reputable industry news sources and publications.
Methodology
Step 1 - Identification of Relevant Samples Size from Population Database


Step 2 - Approaches for Defining Global Market Size (Value, Volume* & Price*)

Note*: In applicable scenarios
Step 3 - Data Sources
Primary Research
- Web Analytics
- Survey Reports
- Research Institute
- Latest Research Reports
- Opinion Leaders
Secondary Research
- Annual Reports
- White Paper
- Latest Press Release
- Industry Association
- Paid Database
- Investor Presentations

Step 4 - Data Triangulation
Involves using different sources of information in order to increase the validity of a study
These sources are likely to be stakeholders in a program - participants, other researchers, program staff, other community members, and so on.
Then we put all data in single framework & apply various statistical tools to find out the dynamic on the market.
During the analysis stage, feedback from the stakeholder groups would be compared to determine areas of agreement as well as areas of divergence