

Key Insights
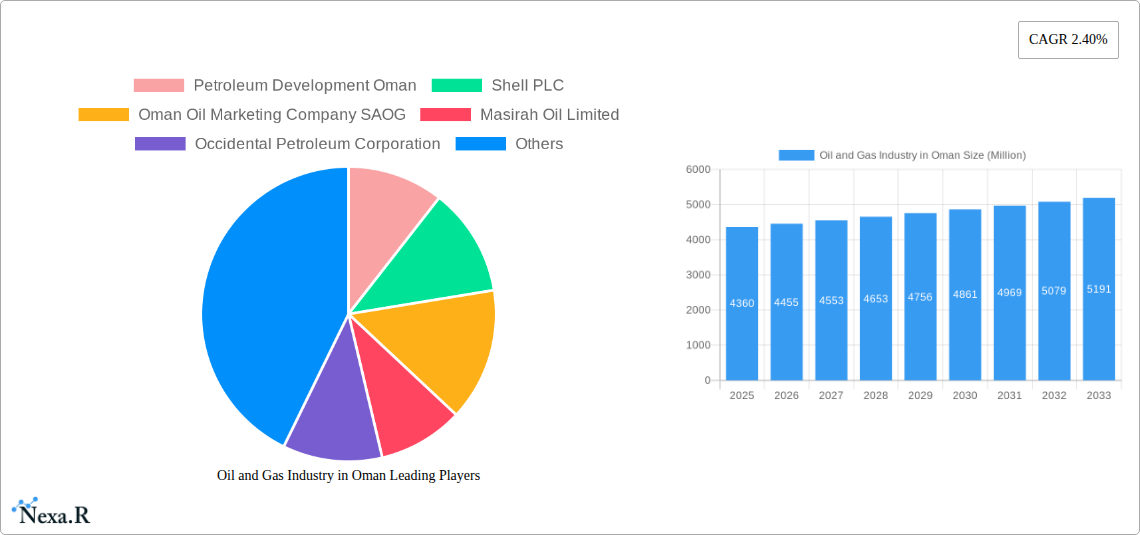
The Omani oil and gas industry, currently valued at $4.36 billion (2025), is projected to experience steady growth, driven by increasing global energy demand and Oman's strategic geographic location. The 2.40% CAGR (2025-2033) indicates a consistent, albeit moderate, expansion. Key drivers include ongoing exploration and production activities by major international players like Shell, BP, and TotalEnergies, coupled with investments in refining and petrochemical projects to enhance value addition. Government initiatives focused on diversifying the economy while ensuring energy security also contribute positively. However, the industry faces certain restraints, primarily the fluctuating global oil prices and the increasing pressure to transition towards renewable energy sources. This necessitates strategic adaptation by Omani companies, focusing on efficiency improvements, technological advancements (like enhanced oil recovery techniques), and exploring opportunities in the burgeoning carbon capture, utilization, and storage (CCUS) sector. Segmentation within the market comprises upstream (exploration and production), midstream (processing and transportation), and downstream (refining and marketing) activities, each contributing to the overall market value. The competitive landscape involves both international giants and national oil companies, creating a dynamic market environment.
The forecast period (2025-2033) suggests a gradual increase in market size, influenced by both global and regional factors. While the CAGR suggests a relatively stable growth trajectory, careful consideration needs to be given to external pressures, such as geopolitical instability and evolving international energy policies. The successful navigation of these challenges will be crucial in determining the long-term health and growth potential of the Omani oil and gas sector. Ongoing investments in infrastructure development and technological innovation will be vital to maintain competitiveness and secure Oman's position within the global energy market. Furthermore, the industry’s commitment to environmental sustainability and responsible practices will increasingly shape its future prospects.
Oil and Gas Industry in Oman: A Comprehensive Market Report (2019-2033)
This in-depth report provides a comprehensive analysis of the Oil and Gas Industry in Oman, covering market dynamics, growth trends, key players, and future outlook. The study period spans from 2019 to 2033, with a base year of 2025 and a forecast period from 2025 to 2033. This report is essential for industry professionals, investors, and policymakers seeking to understand the complexities and opportunities within Oman's energy sector.
Oil and Gas Industry in Oman Market Dynamics & Structure
This section analyzes the competitive landscape, technological advancements, regulatory environment, and market trends within Oman's oil and gas sector. The analysis considers both upstream (exploration and production) and downstream (refining, marketing, and distribution) segments.
Market Concentration: Oman's oil and gas market exhibits a mix of state-owned entities and international players. Petroleum Development Oman (PDO) holds a significant market share, while international oil companies like Shell PLC, BP PLC, and TotalEnergies SA, along with Eni SpA and Occidental Petroleum Corporation play crucial roles. The market share of PDO is estimated at xx% in 2025, while Shell PLC holds approximately xx%. The remaining share is distributed among other national and international players. This concentration is influenced by government licensing and concessions.
Technological Innovation: The industry is witnessing increased adoption of technologies such as enhanced oil recovery (EOR) techniques, digitalization for improved efficiency, and exploration using advanced seismic imaging. However, innovation faces challenges related to high capital investment and integration with existing infrastructure.
Regulatory Framework: Oman's Ministry of Energy and Minerals plays a central role, setting licensing rounds, defining production quotas, and ensuring environmental compliance. Regulatory stability is crucial for attracting foreign investment, but evolving regulations can sometimes create uncertainty.
Competitive Product Substitutes: Renewable energy sources present a growing challenge, although Oman's abundant hydrocarbon reserves ensure continued relevance of oil and gas in the energy mix for the foreseeable future. Natural gas is increasingly important as a fuel source and in power generation.
End-User Demographics: The primary end-users include domestic power generation, industrial sectors (e.g., petrochemicals, cement), and exports. The export market's dynamics significantly affect Oman's oil and gas industry.
M&A Trends: The number of M&A deals in the Omani oil and gas sector fluctuates depending on global market conditions and government policies. Over the historical period (2019-2024), approximately xx deals were recorded with a total value of xx Million. The forecast period (2025-2033) is expected to see xx deals, valued at xx Million, driven primarily by consolidation and strategic acquisitions.
- Key Insight: The interplay between government policies, technological advancements, and global energy markets significantly shapes the competitive dynamics of the Omani oil and gas sector.
Oil and Gas Industry in Oman Growth Trends & Insights
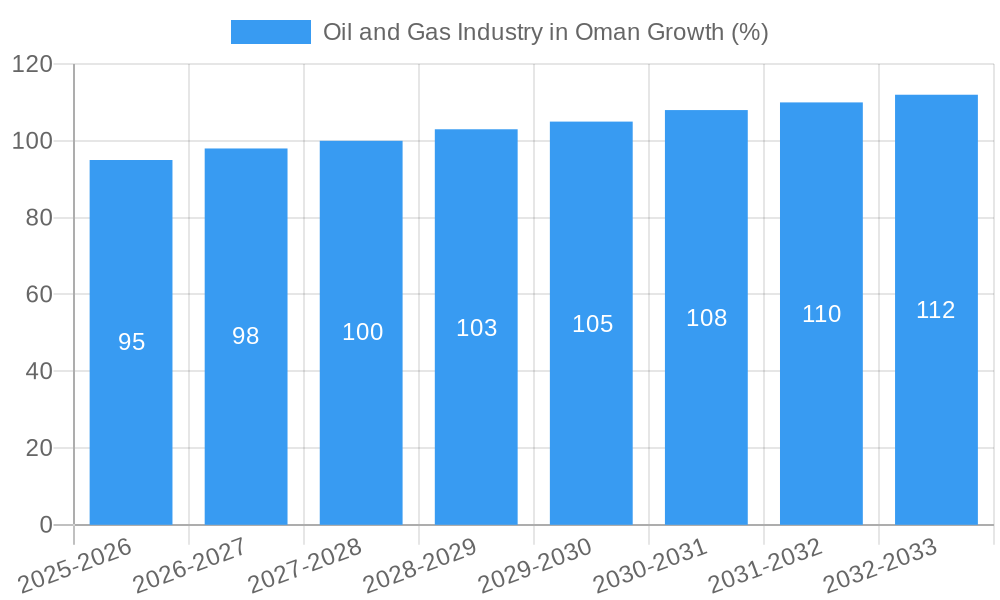
Oman's oil and gas industry has experienced fluctuating growth in the historical period (2019-2024), impacted by global oil price volatility and the COVID-19 pandemic. The market size (in Million units) witnessed a decline in 2020, followed by a moderate recovery in subsequent years. However, the long-term outlook remains positive, driven by consistent exploration efforts, infrastructure development, and expanding gas production for domestic consumption and export. The CAGR for the period 2019-2024 is estimated at xx%, while a forecast CAGR of xx% is projected for 2025-2033. Market penetration of gas in the power sector is expected to increase from xx% in 2024 to xx% by 2033. Technological disruptions, such as the integration of digital technologies, are driving efficiency improvements and reducing operational costs.
Consumer behavior shifts include increased awareness of environmental concerns, which, although not immediately impacting fuel consumption, puts pressure on the industry to enhance sustainability efforts. Government initiatives promoting diversification of the economy are also influencing the energy landscape.
- Key Insight: While global factors will continue to influence growth, Oman's strategic investments in exploration, infrastructure, and gas development will underpin the long-term growth trajectory.
Dominant Regions, Countries, or Segments in Oil and Gas Industry in Oman
The South and Central regions of Oman have historically held dominance in oil and gas production, owing to the concentration of major oil fields. However, exploration activities in other areas, including offshore blocks, indicate potential for geographic diversification of production in the coming years. The focus of the government on expanding gas production and its utilization in power generation and industrial applications is shifting the dynamics toward a greater prominence of gas in the overall market.
- Key Drivers:
- Abundant hydrocarbon reserves in specific geographical locations.
- Existing infrastructure (pipelines, refineries) concentrated in certain areas.
- Government policies and licensing rounds promoting exploration and development in strategically chosen regions.
- Investment in gas infrastructure to support domestic and export markets.
Dominance Factors:
The dominance of specific regions is a result of a combination of factors including geological potential, historical exploration and production, existing infrastructure, and government support. The market share of these dominant regions is constantly evolving, with new discoveries and infrastructural developments influencing future patterns. While the South and Central regions continue to hold a larger share, newer explorations in other regions are slowly challenging this status quo.
Growth Potential: While South and Central Oman have established infrastructure and significant reserves, exploration efforts in other regions represent a substantial growth opportunity. Offshore exploration has the potential to unlock new significant resources.
Key Insight: While established regions will maintain significance, targeted exploration and investment in other regions and in gas infrastructure will contribute to diversified regional growth in the Omani Oil and Gas Sector.
Oil and Gas Industry in Oman Product Landscape
The product landscape encompasses crude oil, natural gas, refined petroleum products (gasoline, diesel, jet fuel), and petrochemicals. Innovations are focused on improving the efficiency of extraction techniques like enhanced oil recovery (EOR) and advanced processing technologies to maximize output and minimize environmental impact. The industry's focus is shifting towards higher-value products, particularly petrochemicals, to diversify its revenue streams. Technological advancements are concentrated on reducing emissions and optimizing resource utilization in alignment with environmental regulations.
Key Drivers, Barriers & Challenges in Oil and Gas Industry in Oman
Key Drivers:
- Abundant hydrocarbon reserves.
- Government support for exploration and development.
- Strategic location for regional energy trade.
- Growing domestic demand for energy.
- Investment in gas infrastructure.
Key Challenges and Restraints:
- Global oil price volatility.
- Environmental concerns and the transition to cleaner energy sources.
- Limited skilled workforce (estimated shortfall of xx skilled workers by 2030).
- High capital expenditures required for exploration and development.
- Competition from renewable energy technologies, resulting in a potential revenue reduction of xx Million in the next decade.
Emerging Opportunities in Oil and Gas Industry in Oman
- Expanding gas production and infrastructure: Significant opportunities exist in developing gas resources for domestic consumption and export. Oman's strategic location makes it a potential regional gas hub.
- Investment in Carbon Capture, Utilization, and Storage (CCUS) technologies: CCUS projects offer opportunities to reduce emissions and enhance environmental sustainability.
- Deepwater exploration: Offshore exploration holds significant potential for new discoveries.
- Petrochemical sector development: Expanding the petrochemical sector can generate higher-value products and diversify the economy.
Growth Accelerators in the Oil and Gas Industry in Oman Industry
Technological advancements in EOR techniques, digitalization of operations, and the development of gas infrastructure are key growth drivers. Strategic partnerships between international and national companies are facilitating knowledge transfer and investment. Government initiatives promoting exploration and export capabilities are also bolstering growth.
Key Players Shaping the Oil and Gas Industry in Oman Market
- Petroleum Development Oman
- Shell PLC
- Oman Oil Marketing Company SAOG
- Masirah Oil Limited
- Occidental Petroleum Corporation
- Eni SpA
- BP PLC
- TotalEnergies SE
- China National Petroleum Corporation
Notable Milestones in Oil and Gas Industry in Oman Sector
- January 2023: Shell Integrated Gas Oman BV commenced gas production from the Mabrouk North East field in Block 10, aiming for 0.5 bscf/d by mid-2024. This significantly boosts domestic gas supply.
- March 2023: The Omani Ministry of Energy & Minerals launched a licensing round offering blocks 15, 36, and 54 for oil and gas exploration, attracting both domestic and international investment. This indicates a commitment to expanding exploration activities.
- April 2023: Masirah Oil announced plans to explore its Block 50 asset, aiming for production increases and a comprehensive exploration review. This signifies increased activity in offshore exploration.
In-Depth Oil and Gas Industry in Oman Market Outlook
The Omani oil and gas industry is poised for sustained growth, driven by ongoing exploration activities, investment in gas infrastructure, and government support. Strategic partnerships and technological advancements will play critical roles in enhancing efficiency and sustainability. The focus on gas development and diversification into higher-value products presents substantial opportunities for growth and economic diversification. The forecast period (2025-2033) suggests significant potential, contingent upon maintaining a stable regulatory environment and adapting to global energy market dynamics.
Oil and Gas Industry in Oman Segmentation
-
1. Upstream
-
1.1. Onshore
- 1.1.1. Overview
- 1.1.2. Key Upcoming and Existing Projects
- 1.2. Offshore
-
1.1. Onshore
-
2. Midstream
-
2.1. Crude Transportation
- 2.1.1. Overview
- 2.1.2. Key Upcoming and Existing Projects
- 2.2. LNG Terminal and Storage
-
2.1. Crude Transportation
-
3. Downstream
-
3.1. Refineries
- 3.1.1. Overview
- 3.1.2. Key Upcoming and Existing Projects
- 3.2. Petrochemical Plants
-
3.1. Refineries
Oil and Gas Industry in Oman Segmentation By Geography
-
1. North America
- 1.1. United States
- 1.2. Canada
- 1.3. Mexico
-
2. South America
- 2.1. Brazil
- 2.2. Argentina
- 2.3. Rest of South America
-
3. Europe
- 3.1. United Kingdom
- 3.2. Germany
- 3.3. France
- 3.4. Italy
- 3.5. Spain
- 3.6. Russia
- 3.7. Benelux
- 3.8. Nordics
- 3.9. Rest of Europe
-
4. Middle East & Africa
- 4.1. Turkey
- 4.2. Israel
- 4.3. GCC
- 4.4. North Africa
- 4.5. South Africa
- 4.6. Rest of Middle East & Africa
-
5. Asia Pacific
- 5.1. China
- 5.2. India
- 5.3. Japan
- 5.4. South Korea
- 5.5. ASEAN
- 5.6. Oceania
- 5.7. Rest of Asia Pacific
Oil and Gas Industry in Oman REPORT HIGHLIGHTS
| Aspects | Details |
|---|---|
| Study Period | 2019-2033 |
| Base Year | 2024 |
| Estimated Year | 2025 |
| Forecast Period | 2025-2033 |
| Historical Period | 2019-2024 |
| Growth Rate | CAGR of 2.40% from 2019-2033 |
| Segmentation |
|
Table of Contents
- 1. Introduction
- 1.1. Research Scope
- 1.2. Market Segmentation
- 1.3. Research Methodology
- 1.4. Definitions and Assumptions
- 2. Executive Summary
- 2.1. Introduction
- 3. Market Dynamics
- 3.1. Introduction
- 3.2. Market Drivers
- 3.2.1. 4.; Increasing Gas Production and Infrastructure4.; Increasing Exploration and Production Activities
- 3.3. Market Restrains
- 3.3.1. 4.; Increasing Gas Production and Infrastructure4.; Increasing Exploration and Production Activities
- 3.4. Market Trends
- 3.4.1. Upstream Sector to Dominate the Market
- 4. Market Factor Analysis
- 4.1. Porters Five Forces
- 4.2. Supply/Value Chain
- 4.3. PESTEL analysis
- 4.4. Market Entropy
- 4.5. Patent/Trademark Analysis
- 5. Global Oil and Gas Industry in Oman Analysis, Insights and Forecast, 2019-2031
- 5.1. Market Analysis, Insights and Forecast - by Upstream
- 5.1.1. Onshore
- 5.1.1.1. Overview
- 5.1.1.2. Key Upcoming and Existing Projects
- 5.1.2. Offshore
- 5.1.1. Onshore
- 5.2. Market Analysis, Insights and Forecast - by Midstream
- 5.2.1. Crude Transportation
- 5.2.1.1. Overview
- 5.2.1.2. Key Upcoming and Existing Projects
- 5.2.2. LNG Terminal and Storage
- 5.2.1. Crude Transportation
- 5.3. Market Analysis, Insights and Forecast - by Downstream
- 5.3.1. Refineries
- 5.3.1.1. Overview
- 5.3.1.2. Key Upcoming and Existing Projects
- 5.3.2. Petrochemical Plants
- 5.3.1. Refineries
- 5.4. Market Analysis, Insights and Forecast - by Region
- 5.4.1. North America
- 5.4.2. South America
- 5.4.3. Europe
- 5.4.4. Middle East & Africa
- 5.4.5. Asia Pacific
- 5.1. Market Analysis, Insights and Forecast - by Upstream
- 6. North America Oil and Gas Industry in Oman Analysis, Insights and Forecast, 2019-2031
- 6.1. Market Analysis, Insights and Forecast - by Upstream
- 6.1.1. Onshore
- 6.1.1.1. Overview
- 6.1.1.2. Key Upcoming and Existing Projects
- 6.1.2. Offshore
- 6.1.1. Onshore
- 6.2. Market Analysis, Insights and Forecast - by Midstream
- 6.2.1. Crude Transportation
- 6.2.1.1. Overview
- 6.2.1.2. Key Upcoming and Existing Projects
- 6.2.2. LNG Terminal and Storage
- 6.2.1. Crude Transportation
- 6.3. Market Analysis, Insights and Forecast - by Downstream
- 6.3.1. Refineries
- 6.3.1.1. Overview
- 6.3.1.2. Key Upcoming and Existing Projects
- 6.3.2. Petrochemical Plants
- 6.3.1. Refineries
- 6.1. Market Analysis, Insights and Forecast - by Upstream
- 7. South America Oil and Gas Industry in Oman Analysis, Insights and Forecast, 2019-2031
- 7.1. Market Analysis, Insights and Forecast - by Upstream
- 7.1.1. Onshore
- 7.1.1.1. Overview
- 7.1.1.2. Key Upcoming and Existing Projects
- 7.1.2. Offshore
- 7.1.1. Onshore
- 7.2. Market Analysis, Insights and Forecast - by Midstream
- 7.2.1. Crude Transportation
- 7.2.1.1. Overview
- 7.2.1.2. Key Upcoming and Existing Projects
- 7.2.2. LNG Terminal and Storage
- 7.2.1. Crude Transportation
- 7.3. Market Analysis, Insights and Forecast - by Downstream
- 7.3.1. Refineries
- 7.3.1.1. Overview
- 7.3.1.2. Key Upcoming and Existing Projects
- 7.3.2. Petrochemical Plants
- 7.3.1. Refineries
- 7.1. Market Analysis, Insights and Forecast - by Upstream
- 8. Europe Oil and Gas Industry in Oman Analysis, Insights and Forecast, 2019-2031
- 8.1. Market Analysis, Insights and Forecast - by Upstream
- 8.1.1. Onshore
- 8.1.1.1. Overview
- 8.1.1.2. Key Upcoming and Existing Projects
- 8.1.2. Offshore
- 8.1.1. Onshore
- 8.2. Market Analysis, Insights and Forecast - by Midstream
- 8.2.1. Crude Transportation
- 8.2.1.1. Overview
- 8.2.1.2. Key Upcoming and Existing Projects
- 8.2.2. LNG Terminal and Storage
- 8.2.1. Crude Transportation
- 8.3. Market Analysis, Insights and Forecast - by Downstream
- 8.3.1. Refineries
- 8.3.1.1. Overview
- 8.3.1.2. Key Upcoming and Existing Projects
- 8.3.2. Petrochemical Plants
- 8.3.1. Refineries
- 8.1. Market Analysis, Insights and Forecast - by Upstream
- 9. Middle East & Africa Oil and Gas Industry in Oman Analysis, Insights and Forecast, 2019-2031
- 9.1. Market Analysis, Insights and Forecast - by Upstream
- 9.1.1. Onshore
- 9.1.1.1. Overview
- 9.1.1.2. Key Upcoming and Existing Projects
- 9.1.2. Offshore
- 9.1.1. Onshore
- 9.2. Market Analysis, Insights and Forecast - by Midstream
- 9.2.1. Crude Transportation
- 9.2.1.1. Overview
- 9.2.1.2. Key Upcoming and Existing Projects
- 9.2.2. LNG Terminal and Storage
- 9.2.1. Crude Transportation
- 9.3. Market Analysis, Insights and Forecast - by Downstream
- 9.3.1. Refineries
- 9.3.1.1. Overview
- 9.3.1.2. Key Upcoming and Existing Projects
- 9.3.2. Petrochemical Plants
- 9.3.1. Refineries
- 9.1. Market Analysis, Insights and Forecast - by Upstream
- 10. Asia Pacific Oil and Gas Industry in Oman Analysis, Insights and Forecast, 2019-2031
- 10.1. Market Analysis, Insights and Forecast - by Upstream
- 10.1.1. Onshore
- 10.1.1.1. Overview
- 10.1.1.2. Key Upcoming and Existing Projects
- 10.1.2. Offshore
- 10.1.1. Onshore
- 10.2. Market Analysis, Insights and Forecast - by Midstream
- 10.2.1. Crude Transportation
- 10.2.1.1. Overview
- 10.2.1.2. Key Upcoming and Existing Projects
- 10.2.2. LNG Terminal and Storage
- 10.2.1. Crude Transportation
- 10.3. Market Analysis, Insights and Forecast - by Downstream
- 10.3.1. Refineries
- 10.3.1.1. Overview
- 10.3.1.2. Key Upcoming and Existing Projects
- 10.3.2. Petrochemical Plants
- 10.3.1. Refineries
- 10.1. Market Analysis, Insights and Forecast - by Upstream
- 11. Competitive Analysis
- 11.1. Global Market Share Analysis 2024
- 11.2. Company Profiles
- 11.2.1 Petroleum Development Oman
- 11.2.1.1. Overview
- 11.2.1.2. Products
- 11.2.1.3. SWOT Analysis
- 11.2.1.4. Recent Developments
- 11.2.1.5. Financials (Based on Availability)
- 11.2.2 Shell PLC
- 11.2.2.1. Overview
- 11.2.2.2. Products
- 11.2.2.3. SWOT Analysis
- 11.2.2.4. Recent Developments
- 11.2.2.5. Financials (Based on Availability)
- 11.2.3 Oman Oil Marketing Company SAOG
- 11.2.3.1. Overview
- 11.2.3.2. Products
- 11.2.3.3. SWOT Analysis
- 11.2.3.4. Recent Developments
- 11.2.3.5. Financials (Based on Availability)
- 11.2.4 Masirah Oil Limited
- 11.2.4.1. Overview
- 11.2.4.2. Products
- 11.2.4.3. SWOT Analysis
- 11.2.4.4. Recent Developments
- 11.2.4.5. Financials (Based on Availability)
- 11.2.5 Occidental Petroleum Corporation
- 11.2.5.1. Overview
- 11.2.5.2. Products
- 11.2.5.3. SWOT Analysis
- 11.2.5.4. Recent Developments
- 11.2.5.5. Financials (Based on Availability)
- 11.2.6 Eni SpA
- 11.2.6.1. Overview
- 11.2.6.2. Products
- 11.2.6.3. SWOT Analysis
- 11.2.6.4. Recent Developments
- 11.2.6.5. Financials (Based on Availability)
- 11.2.7 BP PLC
- 11.2.7.1. Overview
- 11.2.7.2. Products
- 11.2.7.3. SWOT Analysis
- 11.2.7.4. Recent Developments
- 11.2.7.5. Financials (Based on Availability)
- 11.2.8 Total SA
- 11.2.8.1. Overview
- 11.2.8.2. Products
- 11.2.8.3. SWOT Analysis
- 11.2.8.4. Recent Developments
- 11.2.8.5. Financials (Based on Availability)
- 11.2.9 China National Petroleum Corporation*List Not Exhaustive
- 11.2.9.1. Overview
- 11.2.9.2. Products
- 11.2.9.3. SWOT Analysis
- 11.2.9.4. Recent Developments
- 11.2.9.5. Financials (Based on Availability)
- 11.2.1 Petroleum Development Oman
List of Figures
- Figure 1: Global Oil and Gas Industry in Oman Revenue Breakdown (Million, %) by Region 2024 & 2032
- Figure 2: Global Oil and Gas Industry in Oman Volume Breakdown (Billion, %) by Region 2024 & 2032
- Figure 3: North America Oil and Gas Industry in Oman Revenue (Million), by Upstream 2024 & 2032
- Figure 4: North America Oil and Gas Industry in Oman Volume (Billion), by Upstream 2024 & 2032
- Figure 5: North America Oil and Gas Industry in Oman Revenue Share (%), by Upstream 2024 & 2032
- Figure 6: North America Oil and Gas Industry in Oman Volume Share (%), by Upstream 2024 & 2032
- Figure 7: North America Oil and Gas Industry in Oman Revenue (Million), by Midstream 2024 & 2032
- Figure 8: North America Oil and Gas Industry in Oman Volume (Billion), by Midstream 2024 & 2032
- Figure 9: North America Oil and Gas Industry in Oman Revenue Share (%), by Midstream 2024 & 2032
- Figure 10: North America Oil and Gas Industry in Oman Volume Share (%), by Midstream 2024 & 2032
- Figure 11: North America Oil and Gas Industry in Oman Revenue (Million), by Downstream 2024 & 2032
- Figure 12: North America Oil and Gas Industry in Oman Volume (Billion), by Downstream 2024 & 2032
- Figure 13: North America Oil and Gas Industry in Oman Revenue Share (%), by Downstream 2024 & 2032
- Figure 14: North America Oil and Gas Industry in Oman Volume Share (%), by Downstream 2024 & 2032
- Figure 15: North America Oil and Gas Industry in Oman Revenue (Million), by Country 2024 & 2032
- Figure 16: North America Oil and Gas Industry in Oman Volume (Billion), by Country 2024 & 2032
- Figure 17: North America Oil and Gas Industry in Oman Revenue Share (%), by Country 2024 & 2032
- Figure 18: North America Oil and Gas Industry in Oman Volume Share (%), by Country 2024 & 2032
- Figure 19: South America Oil and Gas Industry in Oman Revenue (Million), by Upstream 2024 & 2032
- Figure 20: South America Oil and Gas Industry in Oman Volume (Billion), by Upstream 2024 & 2032
- Figure 21: South America Oil and Gas Industry in Oman Revenue Share (%), by Upstream 2024 & 2032
- Figure 22: South America Oil and Gas Industry in Oman Volume Share (%), by Upstream 2024 & 2032
- Figure 23: South America Oil and Gas Industry in Oman Revenue (Million), by Midstream 2024 & 2032
- Figure 24: South America Oil and Gas Industry in Oman Volume (Billion), by Midstream 2024 & 2032
- Figure 25: South America Oil and Gas Industry in Oman Revenue Share (%), by Midstream 2024 & 2032
- Figure 26: South America Oil and Gas Industry in Oman Volume Share (%), by Midstream 2024 & 2032
- Figure 27: South America Oil and Gas Industry in Oman Revenue (Million), by Downstream 2024 & 2032
- Figure 28: South America Oil and Gas Industry in Oman Volume (Billion), by Downstream 2024 & 2032
- Figure 29: South America Oil and Gas Industry in Oman Revenue Share (%), by Downstream 2024 & 2032
- Figure 30: South America Oil and Gas Industry in Oman Volume Share (%), by Downstream 2024 & 2032
- Figure 31: South America Oil and Gas Industry in Oman Revenue (Million), by Country 2024 & 2032
- Figure 32: South America Oil and Gas Industry in Oman Volume (Billion), by Country 2024 & 2032
- Figure 33: South America Oil and Gas Industry in Oman Revenue Share (%), by Country 2024 & 2032
- Figure 34: South America Oil and Gas Industry in Oman Volume Share (%), by Country 2024 & 2032
- Figure 35: Europe Oil and Gas Industry in Oman Revenue (Million), by Upstream 2024 & 2032
- Figure 36: Europe Oil and Gas Industry in Oman Volume (Billion), by Upstream 2024 & 2032
- Figure 37: Europe Oil and Gas Industry in Oman Revenue Share (%), by Upstream 2024 & 2032
- Figure 38: Europe Oil and Gas Industry in Oman Volume Share (%), by Upstream 2024 & 2032
- Figure 39: Europe Oil and Gas Industry in Oman Revenue (Million), by Midstream 2024 & 2032
- Figure 40: Europe Oil and Gas Industry in Oman Volume (Billion), by Midstream 2024 & 2032
- Figure 41: Europe Oil and Gas Industry in Oman Revenue Share (%), by Midstream 2024 & 2032
- Figure 42: Europe Oil and Gas Industry in Oman Volume Share (%), by Midstream 2024 & 2032
- Figure 43: Europe Oil and Gas Industry in Oman Revenue (Million), by Downstream 2024 & 2032
- Figure 44: Europe Oil and Gas Industry in Oman Volume (Billion), by Downstream 2024 & 2032
- Figure 45: Europe Oil and Gas Industry in Oman Revenue Share (%), by Downstream 2024 & 2032
- Figure 46: Europe Oil and Gas Industry in Oman Volume Share (%), by Downstream 2024 & 2032
- Figure 47: Europe Oil and Gas Industry in Oman Revenue (Million), by Country 2024 & 2032
- Figure 48: Europe Oil and Gas Industry in Oman Volume (Billion), by Country 2024 & 2032
- Figure 49: Europe Oil and Gas Industry in Oman Revenue Share (%), by Country 2024 & 2032
- Figure 50: Europe Oil and Gas Industry in Oman Volume Share (%), by Country 2024 & 2032
- Figure 51: Middle East & Africa Oil and Gas Industry in Oman Revenue (Million), by Upstream 2024 & 2032
- Figure 52: Middle East & Africa Oil and Gas Industry in Oman Volume (Billion), by Upstream 2024 & 2032
- Figure 53: Middle East & Africa Oil and Gas Industry in Oman Revenue Share (%), by Upstream 2024 & 2032
- Figure 54: Middle East & Africa Oil and Gas Industry in Oman Volume Share (%), by Upstream 2024 & 2032
- Figure 55: Middle East & Africa Oil and Gas Industry in Oman Revenue (Million), by Midstream 2024 & 2032
- Figure 56: Middle East & Africa Oil and Gas Industry in Oman Volume (Billion), by Midstream 2024 & 2032
- Figure 57: Middle East & Africa Oil and Gas Industry in Oman Revenue Share (%), by Midstream 2024 & 2032
- Figure 58: Middle East & Africa Oil and Gas Industry in Oman Volume Share (%), by Midstream 2024 & 2032
- Figure 59: Middle East & Africa Oil and Gas Industry in Oman Revenue (Million), by Downstream 2024 & 2032
- Figure 60: Middle East & Africa Oil and Gas Industry in Oman Volume (Billion), by Downstream 2024 & 2032
- Figure 61: Middle East & Africa Oil and Gas Industry in Oman Revenue Share (%), by Downstream 2024 & 2032
- Figure 62: Middle East & Africa Oil and Gas Industry in Oman Volume Share (%), by Downstream 2024 & 2032
- Figure 63: Middle East & Africa Oil and Gas Industry in Oman Revenue (Million), by Country 2024 & 2032
- Figure 64: Middle East & Africa Oil and Gas Industry in Oman Volume (Billion), by Country 2024 & 2032
- Figure 65: Middle East & Africa Oil and Gas Industry in Oman Revenue Share (%), by Country 2024 & 2032
- Figure 66: Middle East & Africa Oil and Gas Industry in Oman Volume Share (%), by Country 2024 & 2032
- Figure 67: Asia Pacific Oil and Gas Industry in Oman Revenue (Million), by Upstream 2024 & 2032
- Figure 68: Asia Pacific Oil and Gas Industry in Oman Volume (Billion), by Upstream 2024 & 2032
- Figure 69: Asia Pacific Oil and Gas Industry in Oman Revenue Share (%), by Upstream 2024 & 2032
- Figure 70: Asia Pacific Oil and Gas Industry in Oman Volume Share (%), by Upstream 2024 & 2032
- Figure 71: Asia Pacific Oil and Gas Industry in Oman Revenue (Million), by Midstream 2024 & 2032
- Figure 72: Asia Pacific Oil and Gas Industry in Oman Volume (Billion), by Midstream 2024 & 2032
- Figure 73: Asia Pacific Oil and Gas Industry in Oman Revenue Share (%), by Midstream 2024 & 2032
- Figure 74: Asia Pacific Oil and Gas Industry in Oman Volume Share (%), by Midstream 2024 & 2032
- Figure 75: Asia Pacific Oil and Gas Industry in Oman Revenue (Million), by Downstream 2024 & 2032
- Figure 76: Asia Pacific Oil and Gas Industry in Oman Volume (Billion), by Downstream 2024 & 2032
- Figure 77: Asia Pacific Oil and Gas Industry in Oman Revenue Share (%), by Downstream 2024 & 2032
- Figure 78: Asia Pacific Oil and Gas Industry in Oman Volume Share (%), by Downstream 2024 & 2032
- Figure 79: Asia Pacific Oil and Gas Industry in Oman Revenue (Million), by Country 2024 & 2032
- Figure 80: Asia Pacific Oil and Gas Industry in Oman Volume (Billion), by Country 2024 & 2032
- Figure 81: Asia Pacific Oil and Gas Industry in Oman Revenue Share (%), by Country 2024 & 2032
- Figure 82: Asia Pacific Oil and Gas Industry in Oman Volume Share (%), by Country 2024 & 2032
List of Tables
- Table 1: Global Oil and Gas Industry in Oman Revenue Million Forecast, by Region 2019 & 2032
- Table 2: Global Oil and Gas Industry in Oman Volume Billion Forecast, by Region 2019 & 2032
- Table 3: Global Oil and Gas Industry in Oman Revenue Million Forecast, by Upstream 2019 & 2032
- Table 4: Global Oil and Gas Industry in Oman Volume Billion Forecast, by Upstream 2019 & 2032
- Table 5: Global Oil and Gas Industry in Oman Revenue Million Forecast, by Midstream 2019 & 2032
- Table 6: Global Oil and Gas Industry in Oman Volume Billion Forecast, by Midstream 2019 & 2032
- Table 7: Global Oil and Gas Industry in Oman Revenue Million Forecast, by Downstream 2019 & 2032
- Table 8: Global Oil and Gas Industry in Oman Volume Billion Forecast, by Downstream 2019 & 2032
- Table 9: Global Oil and Gas Industry in Oman Revenue Million Forecast, by Region 2019 & 2032
- Table 10: Global Oil and Gas Industry in Oman Volume Billion Forecast, by Region 2019 & 2032
- Table 11: Global Oil and Gas Industry in Oman Revenue Million Forecast, by Upstream 2019 & 2032
- Table 12: Global Oil and Gas Industry in Oman Volume Billion Forecast, by Upstream 2019 & 2032
- Table 13: Global Oil and Gas Industry in Oman Revenue Million Forecast, by Midstream 2019 & 2032
- Table 14: Global Oil and Gas Industry in Oman Volume Billion Forecast, by Midstream 2019 & 2032
- Table 15: Global Oil and Gas Industry in Oman Revenue Million Forecast, by Downstream 2019 & 2032
- Table 16: Global Oil and Gas Industry in Oman Volume Billion Forecast, by Downstream 2019 & 2032
- Table 17: Global Oil and Gas Industry in Oman Revenue Million Forecast, by Country 2019 & 2032
- Table 18: Global Oil and Gas Industry in Oman Volume Billion Forecast, by Country 2019 & 2032
- Table 19: United States Oil and Gas Industry in Oman Revenue (Million) Forecast, by Application 2019 & 2032
- Table 20: United States Oil and Gas Industry in Oman Volume (Billion) Forecast, by Application 2019 & 2032
- Table 21: Canada Oil and Gas Industry in Oman Revenue (Million) Forecast, by Application 2019 & 2032
- Table 22: Canada Oil and Gas Industry in Oman Volume (Billion) Forecast, by Application 2019 & 2032
- Table 23: Mexico Oil and Gas Industry in Oman Revenue (Million) Forecast, by Application 2019 & 2032
- Table 24: Mexico Oil and Gas Industry in Oman Volume (Billion) Forecast, by Application 2019 & 2032
- Table 25: Global Oil and Gas Industry in Oman Revenue Million Forecast, by Upstream 2019 & 2032
- Table 26: Global Oil and Gas Industry in Oman Volume Billion Forecast, by Upstream 2019 & 2032
- Table 27: Global Oil and Gas Industry in Oman Revenue Million Forecast, by Midstream 2019 & 2032
- Table 28: Global Oil and Gas Industry in Oman Volume Billion Forecast, by Midstream 2019 & 2032
- Table 29: Global Oil and Gas Industry in Oman Revenue Million Forecast, by Downstream 2019 & 2032
- Table 30: Global Oil and Gas Industry in Oman Volume Billion Forecast, by Downstream 2019 & 2032
- Table 31: Global Oil and Gas Industry in Oman Revenue Million Forecast, by Country 2019 & 2032
- Table 32: Global Oil and Gas Industry in Oman Volume Billion Forecast, by Country 2019 & 2032
- Table 33: Brazil Oil and Gas Industry in Oman Revenue (Million) Forecast, by Application 2019 & 2032
- Table 34: Brazil Oil and Gas Industry in Oman Volume (Billion) Forecast, by Application 2019 & 2032
- Table 35: Argentina Oil and Gas Industry in Oman Revenue (Million) Forecast, by Application 2019 & 2032
- Table 36: Argentina Oil and Gas Industry in Oman Volume (Billion) Forecast, by Application 2019 & 2032
- Table 37: Rest of South America Oil and Gas Industry in Oman Revenue (Million) Forecast, by Application 2019 & 2032
- Table 38: Rest of South America Oil and Gas Industry in Oman Volume (Billion) Forecast, by Application 2019 & 2032
- Table 39: Global Oil and Gas Industry in Oman Revenue Million Forecast, by Upstream 2019 & 2032
- Table 40: Global Oil and Gas Industry in Oman Volume Billion Forecast, by Upstream 2019 & 2032
- Table 41: Global Oil and Gas Industry in Oman Revenue Million Forecast, by Midstream 2019 & 2032
- Table 42: Global Oil and Gas Industry in Oman Volume Billion Forecast, by Midstream 2019 & 2032
- Table 43: Global Oil and Gas Industry in Oman Revenue Million Forecast, by Downstream 2019 & 2032
- Table 44: Global Oil and Gas Industry in Oman Volume Billion Forecast, by Downstream 2019 & 2032
- Table 45: Global Oil and Gas Industry in Oman Revenue Million Forecast, by Country 2019 & 2032
- Table 46: Global Oil and Gas Industry in Oman Volume Billion Forecast, by Country 2019 & 2032
- Table 47: United Kingdom Oil and Gas Industry in Oman Revenue (Million) Forecast, by Application 2019 & 2032
- Table 48: United Kingdom Oil and Gas Industry in Oman Volume (Billion) Forecast, by Application 2019 & 2032
- Table 49: Germany Oil and Gas Industry in Oman Revenue (Million) Forecast, by Application 2019 & 2032
- Table 50: Germany Oil and Gas Industry in Oman Volume (Billion) Forecast, by Application 2019 & 2032
- Table 51: France Oil and Gas Industry in Oman Revenue (Million) Forecast, by Application 2019 & 2032
- Table 52: France Oil and Gas Industry in Oman Volume (Billion) Forecast, by Application 2019 & 2032
- Table 53: Italy Oil and Gas Industry in Oman Revenue (Million) Forecast, by Application 2019 & 2032
- Table 54: Italy Oil and Gas Industry in Oman Volume (Billion) Forecast, by Application 2019 & 2032
- Table 55: Spain Oil and Gas Industry in Oman Revenue (Million) Forecast, by Application 2019 & 2032
- Table 56: Spain Oil and Gas Industry in Oman Volume (Billion) Forecast, by Application 2019 & 2032
- Table 57: Russia Oil and Gas Industry in Oman Revenue (Million) Forecast, by Application 2019 & 2032
- Table 58: Russia Oil and Gas Industry in Oman Volume (Billion) Forecast, by Application 2019 & 2032
- Table 59: Benelux Oil and Gas Industry in Oman Revenue (Million) Forecast, by Application 2019 & 2032
- Table 60: Benelux Oil and Gas Industry in Oman Volume (Billion) Forecast, by Application 2019 & 2032
- Table 61: Nordics Oil and Gas Industry in Oman Revenue (Million) Forecast, by Application 2019 & 2032
- Table 62: Nordics Oil and Gas Industry in Oman Volume (Billion) Forecast, by Application 2019 & 2032
- Table 63: Rest of Europe Oil and Gas Industry in Oman Revenue (Million) Forecast, by Application 2019 & 2032
- Table 64: Rest of Europe Oil and Gas Industry in Oman Volume (Billion) Forecast, by Application 2019 & 2032
- Table 65: Global Oil and Gas Industry in Oman Revenue Million Forecast, by Upstream 2019 & 2032
- Table 66: Global Oil and Gas Industry in Oman Volume Billion Forecast, by Upstream 2019 & 2032
- Table 67: Global Oil and Gas Industry in Oman Revenue Million Forecast, by Midstream 2019 & 2032
- Table 68: Global Oil and Gas Industry in Oman Volume Billion Forecast, by Midstream 2019 & 2032
- Table 69: Global Oil and Gas Industry in Oman Revenue Million Forecast, by Downstream 2019 & 2032
- Table 70: Global Oil and Gas Industry in Oman Volume Billion Forecast, by Downstream 2019 & 2032
- Table 71: Global Oil and Gas Industry in Oman Revenue Million Forecast, by Country 2019 & 2032
- Table 72: Global Oil and Gas Industry in Oman Volume Billion Forecast, by Country 2019 & 2032
- Table 73: Turkey Oil and Gas Industry in Oman Revenue (Million) Forecast, by Application 2019 & 2032
- Table 74: Turkey Oil and Gas Industry in Oman Volume (Billion) Forecast, by Application 2019 & 2032
- Table 75: Israel Oil and Gas Industry in Oman Revenue (Million) Forecast, by Application 2019 & 2032
- Table 76: Israel Oil and Gas Industry in Oman Volume (Billion) Forecast, by Application 2019 & 2032
- Table 77: GCC Oil and Gas Industry in Oman Revenue (Million) Forecast, by Application 2019 & 2032
- Table 78: GCC Oil and Gas Industry in Oman Volume (Billion) Forecast, by Application 2019 & 2032
- Table 79: North Africa Oil and Gas Industry in Oman Revenue (Million) Forecast, by Application 2019 & 2032
- Table 80: North Africa Oil and Gas Industry in Oman Volume (Billion) Forecast, by Application 2019 & 2032
- Table 81: South Africa Oil and Gas Industry in Oman Revenue (Million) Forecast, by Application 2019 & 2032
- Table 82: South Africa Oil and Gas Industry in Oman Volume (Billion) Forecast, by Application 2019 & 2032
- Table 83: Rest of Middle East & Africa Oil and Gas Industry in Oman Revenue (Million) Forecast, by Application 2019 & 2032
- Table 84: Rest of Middle East & Africa Oil and Gas Industry in Oman Volume (Billion) Forecast, by Application 2019 & 2032
- Table 85: Global Oil and Gas Industry in Oman Revenue Million Forecast, by Upstream 2019 & 2032
- Table 86: Global Oil and Gas Industry in Oman Volume Billion Forecast, by Upstream 2019 & 2032
- Table 87: Global Oil and Gas Industry in Oman Revenue Million Forecast, by Midstream 2019 & 2032
- Table 88: Global Oil and Gas Industry in Oman Volume Billion Forecast, by Midstream 2019 & 2032
- Table 89: Global Oil and Gas Industry in Oman Revenue Million Forecast, by Downstream 2019 & 2032
- Table 90: Global Oil and Gas Industry in Oman Volume Billion Forecast, by Downstream 2019 & 2032
- Table 91: Global Oil and Gas Industry in Oman Revenue Million Forecast, by Country 2019 & 2032
- Table 92: Global Oil and Gas Industry in Oman Volume Billion Forecast, by Country 2019 & 2032
- Table 93: China Oil and Gas Industry in Oman Revenue (Million) Forecast, by Application 2019 & 2032
- Table 94: China Oil and Gas Industry in Oman Volume (Billion) Forecast, by Application 2019 & 2032
- Table 95: India Oil and Gas Industry in Oman Revenue (Million) Forecast, by Application 2019 & 2032
- Table 96: India Oil and Gas Industry in Oman Volume (Billion) Forecast, by Application 2019 & 2032
- Table 97: Japan Oil and Gas Industry in Oman Revenue (Million) Forecast, by Application 2019 & 2032
- Table 98: Japan Oil and Gas Industry in Oman Volume (Billion) Forecast, by Application 2019 & 2032
- Table 99: South Korea Oil and Gas Industry in Oman Revenue (Million) Forecast, by Application 2019 & 2032
- Table 100: South Korea Oil and Gas Industry in Oman Volume (Billion) Forecast, by Application 2019 & 2032
- Table 101: ASEAN Oil and Gas Industry in Oman Revenue (Million) Forecast, by Application 2019 & 2032
- Table 102: ASEAN Oil and Gas Industry in Oman Volume (Billion) Forecast, by Application 2019 & 2032
- Table 103: Oceania Oil and Gas Industry in Oman Revenue (Million) Forecast, by Application 2019 & 2032
- Table 104: Oceania Oil and Gas Industry in Oman Volume (Billion) Forecast, by Application 2019 & 2032
- Table 105: Rest of Asia Pacific Oil and Gas Industry in Oman Revenue (Million) Forecast, by Application 2019 & 2032
- Table 106: Rest of Asia Pacific Oil and Gas Industry in Oman Volume (Billion) Forecast, by Application 2019 & 2032
Frequently Asked Questions
1. What is the projected Compound Annual Growth Rate (CAGR) of the Oil and Gas Industry in Oman?
The projected CAGR is approximately 2.40%.
2. Which companies are prominent players in the Oil and Gas Industry in Oman?
Key companies in the market include Petroleum Development Oman, Shell PLC, Oman Oil Marketing Company SAOG, Masirah Oil Limited, Occidental Petroleum Corporation, Eni SpA, BP PLC, Total SA, China National Petroleum Corporation*List Not Exhaustive.
3. What are the main segments of the Oil and Gas Industry in Oman?
The market segments include Upstream, Midstream, Downstream.
4. Can you provide details about the market size?
The market size is estimated to be USD 4.36 Million as of 2022.
5. What are some drivers contributing to market growth?
4.; Increasing Gas Production and Infrastructure4.; Increasing Exploration and Production Activities.
6. What are the notable trends driving market growth?
Upstream Sector to Dominate the Market.
7. Are there any restraints impacting market growth?
4.; Increasing Gas Production and Infrastructure4.; Increasing Exploration and Production Activities.
8. Can you provide examples of recent developments in the market?
April 2023: Masirah Oil, a subsidiary of Singapore-headquartered independent Rex International, announced to explore its flagship asset offshore Oman, with its sights set on a production boost from the block 50 purchases. In addition, a block-wide review of exploration potential would be performed. Based on the results of an exploration review at Block 50, planning for acquiring additional targeted seismic would be implemented.
9. What pricing options are available for accessing the report?
Pricing options include single-user, multi-user, and enterprise licenses priced at USD 3800, USD 4500, and USD 5800 respectively.
10. Is the market size provided in terms of value or volume?
The market size is provided in terms of value, measured in Million and volume, measured in Billion.
11. Are there any specific market keywords associated with the report?
Yes, the market keyword associated with the report is "Oil and Gas Industry in Oman," which aids in identifying and referencing the specific market segment covered.
12. How do I determine which pricing option suits my needs best?
The pricing options vary based on user requirements and access needs. Individual users may opt for single-user licenses, while businesses requiring broader access may choose multi-user or enterprise licenses for cost-effective access to the report.
13. Are there any additional resources or data provided in the Oil and Gas Industry in Oman report?
While the report offers comprehensive insights, it's advisable to review the specific contents or supplementary materials provided to ascertain if additional resources or data are available.
14. How can I stay updated on further developments or reports in the Oil and Gas Industry in Oman?
To stay informed about further developments, trends, and reports in the Oil and Gas Industry in Oman, consider subscribing to industry newsletters, following relevant companies and organizations, or regularly checking reputable industry news sources and publications.
Methodology
Step 1 - Identification of Relevant Samples Size from Population Database


Step 2 - Approaches for Defining Global Market Size (Value, Volume* & Price*)

Note*: In applicable scenarios
Step 3 - Data Sources
Primary Research
- Web Analytics
- Survey Reports
- Research Institute
- Latest Research Reports
- Opinion Leaders
Secondary Research
- Annual Reports
- White Paper
- Latest Press Release
- Industry Association
- Paid Database
- Investor Presentations

Step 4 - Data Triangulation
Involves using different sources of information in order to increase the validity of a study
These sources are likely to be stakeholders in a program - participants, other researchers, program staff, other community members, and so on.
Then we put all data in single framework & apply various statistical tools to find out the dynamic on the market.
During the analysis stage, feedback from the stakeholder groups would be compared to determine areas of agreement as well as areas of divergence
