

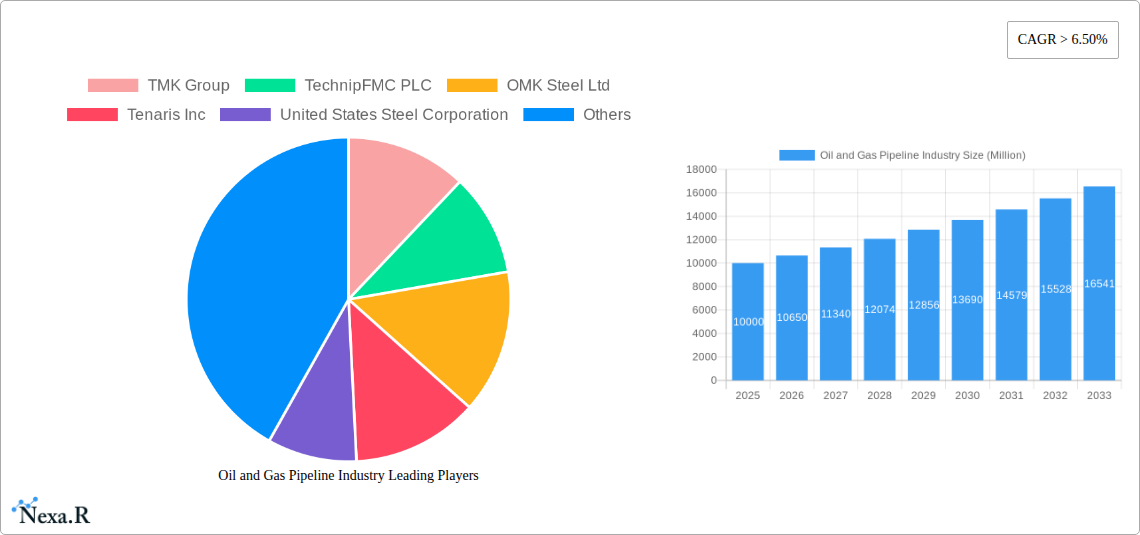
Key Insights
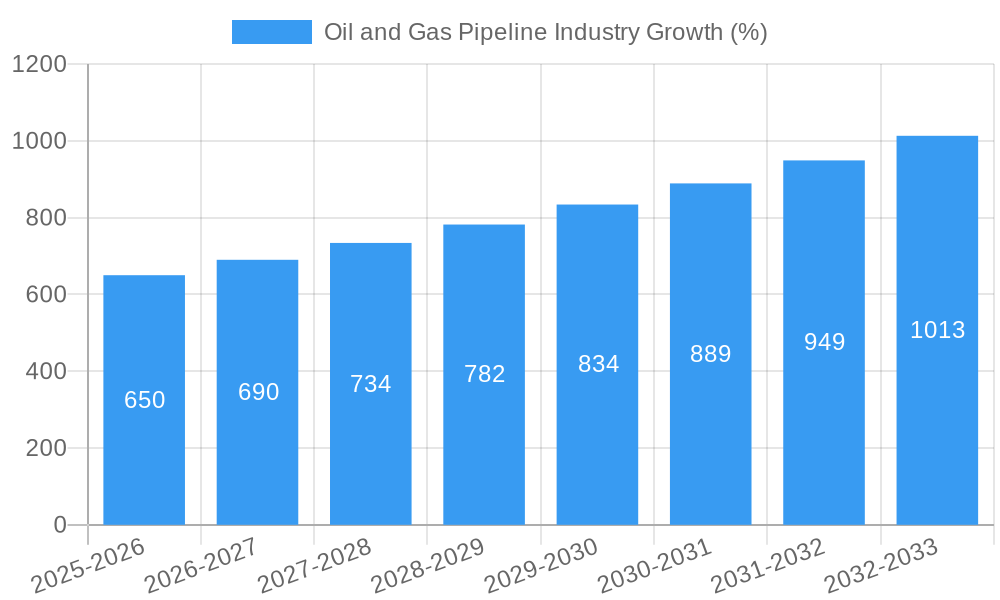
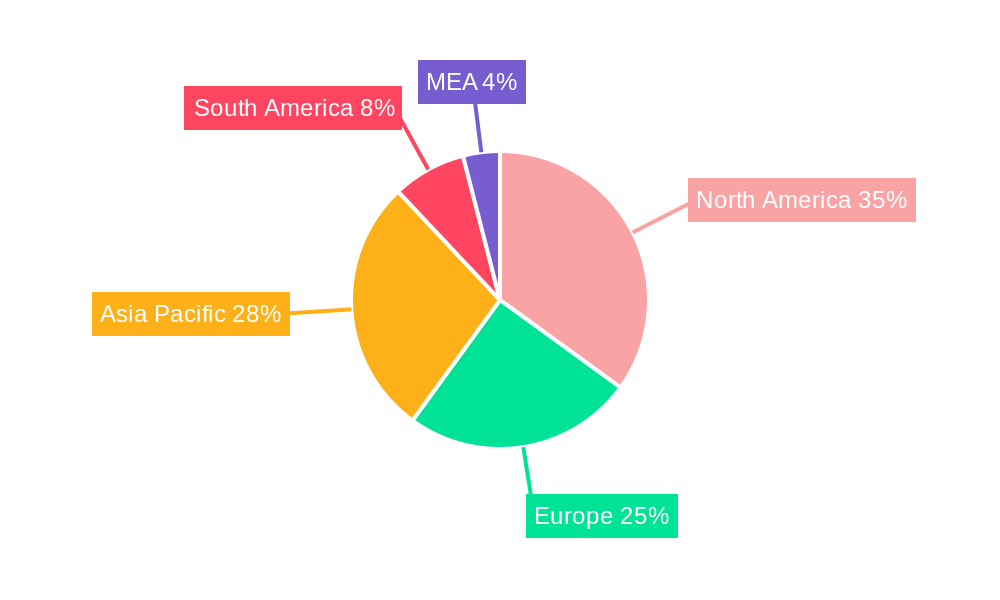
The oil and gas pipeline industry is experiencing robust growth, driven by increasing global energy demand and the need for efficient hydrocarbon transportation. A compound annual growth rate (CAGR) exceeding 6.50% indicates a significant expansion of the market, projected to reach substantial value in the coming years. Several key factors contribute to this positive trajectory. Firstly, the ongoing development of new oil and gas fields, particularly in regions with substantial reserves like North America, the Middle East, and Asia-Pacific, necessitates extensive pipeline infrastructure. Secondly, the shift toward cleaner energy sources is not diminishing demand for pipelines in the near term; existing infrastructure needs modernization and expansion, while the transportation of natural gas remains critical for electricity generation and industrial applications. Finally, governments are increasingly investing in infrastructure projects to support economic growth, further bolstering the pipeline industry. Onshore pipelines currently dominate the market share due to their relatively lower installation costs compared to offshore counterparts. However, offshore pipelines are witnessing a steady rise in demand, fueled by offshore oil and gas exploration activities. Crude oil pipelines maintain a larger market share than gas pipelines, reflecting the global dependence on crude oil for various energy applications. Competition among major players like TMK Group, TechnipFMC PLC, and Tenaris Inc. is intensifying, driving innovation in pipeline technology and construction techniques.
Despite the positive growth outlook, several challenges hinder market expansion. These include fluctuating crude oil and natural gas prices, environmental concerns related to pipeline construction and operation, and regulatory hurdles surrounding pipeline safety and environmental impact assessments. Furthermore, geopolitical instability in certain regions can disrupt pipeline projects and investment flows. Nevertheless, the long-term outlook remains positive, with continued investments in pipeline infrastructure expected to offset these challenges. Regional growth varies, with North America and Asia-Pacific projected as leading markets due to their substantial energy production and consumption. Europe and the Middle East also hold significant potential, driven by existing and planned infrastructure development. The industry's future hinges on technological advancements, sustainable practices, and effective regulatory frameworks to ensure both economic progress and environmental stewardship.
Oil & Gas Pipeline Industry Market Report: 2019-2033
This comprehensive report provides an in-depth analysis of the global oil and gas pipeline industry, encompassing market dynamics, growth trends, competitive landscape, and future outlook. The study period covers 2019-2033, with a base year of 2025 and a forecast period of 2025-2033. This report is crucial for industry professionals, investors, and strategic decision-makers seeking to understand and capitalize on opportunities within this vital sector. The report analyzes both parent markets (Oil & Gas Infrastructure) and child markets (Onshore/Offshore Pipelines, Crude Oil/Gas Pipelines).
Oil and Gas Pipeline Industry Market Dynamics & Structure
The oil and gas pipeline industry is characterized by moderate market concentration, with a few major players holding significant market share. Technological innovation, driven by the need for enhanced efficiency, safety, and sustainability, is a key driver. Stringent regulatory frameworks and environmental concerns influence industry practices and investment decisions. Competitive pressures from alternative energy sources and transportation methods exist, yet pipelines retain a crucial role in energy distribution. M&A activity is relatively frequent, particularly among companies seeking to expand geographical reach or enhance technological capabilities. The global market size in 2024 was estimated at xx Million.
- Market Concentration: Top 5 players hold approximately xx% market share (2024).
- Technological Innovation: Focus on smart pipelines, advanced materials, and leak detection technologies.
- Regulatory Framework: Emphasis on safety, environmental compliance, and pipeline integrity management.
- Competitive Substitutes: Rail, road, and maritime transport; renewable energy sources.
- M&A Trends: xx major deals concluded in the last 5 years, with a total value of approximately xx Million.
- Innovation Barriers: High initial investment costs, stringent regulatory approvals, and technological complexity.
Oil and Gas Pipeline Industry Growth Trends & Insights
The oil and gas pipeline industry experienced steady growth during the historical period (2019-2024), driven by increasing global energy demand and infrastructural development in emerging economies. However, growth rates fluctuated due to factors such as oil price volatility and geopolitical events. The adoption of advanced technologies is accelerating, improving operational efficiency and reducing environmental impact. Consumer behavior, specifically the rising demand for natural gas and liquefied natural gas (LNG), is also positively impacting market growth. The CAGR from 2019-2024 is estimated at xx%, with market penetration reaching xx% in key regions. The forecast period (2025-2033) projects continued growth, albeit at a moderated pace, fueled by sustained energy demand and ongoing infrastructural investments. Technological disruptions, such as the adoption of digital twins and predictive maintenance, will further optimize pipeline operations.
Dominant Regions, Countries, or Segments in Oil and Gas Pipeline Industry
North America and Asia-Pacific regions currently dominate the oil and gas pipeline market, driven by robust energy demand and substantial infrastructural development. Onshore pipelines currently hold the largest market share due to established infrastructure and lower installation costs compared to offshore deployments. However, offshore pipeline deployments are projected to experience significant growth, particularly in regions with substantial offshore oil and gas reserves. The crude oil pipeline segment holds a larger market share than gas pipelines, largely driven by the global demand for crude oil.
- Key Drivers: Robust economic growth in key regions, government policies supporting energy infrastructure development, and increased energy consumption.
- North America: Significant investments in pipeline infrastructure modernization and expansion.
- Asia-Pacific: Rapid industrialization and urbanization driving demand for energy infrastructure.
- Onshore Pipelines: Lower installation costs, established infrastructure, and ease of maintenance.
- Offshore Pipelines: High growth potential, driven by increasing exploration and production activities in offshore fields.
- Crude Oil Pipelines: Larger market share, reflecting global crude oil consumption patterns.
Oil and Gas Pipeline Industry Product Landscape
The oil and gas pipeline industry offers a wide range of products, including pipes manufactured from various materials (steel, polyethylene), coatings, and specialized equipment for pipeline construction, maintenance, and monitoring. Technological advancements focus on improving pipe strength, corrosion resistance, and leak detection capabilities. Unique selling propositions include enhanced durability, longer lifespans, and improved safety features. Smart pipeline technologies, integrating sensors and data analytics, are gaining traction, enabling predictive maintenance and optimized operations. The market value in 2024 was approximately xx Million.
Key Drivers, Barriers & Challenges in Oil and Gas Pipeline Industry
Key Drivers:
- Increasing global energy demand
- Expansion of oil and gas exploration and production activities
- Government initiatives promoting energy infrastructure development.
Key Challenges:
- High capital expenditure for pipeline construction and maintenance
- Stringent regulatory approvals and environmental concerns
- Geopolitical risks and disruptions to supply chains
- Competition from alternative energy sources and transportation modes. Estimated impact on market growth in 2025: xx% reduction due to supply chain challenges.
Emerging Opportunities in Oil and Gas Pipeline Industry
- Expansion into untapped markets, particularly in developing economies.
- Development of smart pipeline technologies and digital solutions.
- Growing demand for natural gas and LNG pipelines.
- Increased focus on pipeline integrity management and safety.
Growth Accelerators in the Oil and Gas Pipeline Industry
Technological breakthroughs, particularly in materials science and digitalization, are accelerating market growth. Strategic partnerships between pipeline operators, technology providers, and engineering firms are fostering innovation and efficiency improvements. Expansion into new geographic markets, including regions with significant untapped oil and gas resources, is creating significant growth opportunities.
Key Players Shaping the Oil and Gas Pipeline Industry Market
- TMK Group
- TechnipFMC PLC
- OMK Steel Ltd
- Tenaris Inc
- United States Steel Corporation
- Nippon Steel Corporation
- ChelPipe Group
- Shengli Oil & Gas Pipe Holdings Limited
- Mott Macdonald Group Ltd
Notable Milestones in Oil and Gas Pipeline Industry Sector
- June 2022: Kalpataru Power Transmission Limited (KPTL) awarded a contract for the Mumbai-Nagpur pipeline project (India), signifying growth in the Asian market.
- December 2022: Argentina secured USD 689 Million financing for a natural gas pipeline expansion in the Vaca Muerta shale region, highlighting investment in South American energy infrastructure.
In-Depth Oil and Gas Pipeline Industry Market Outlook
The oil and gas pipeline industry is poised for continued growth driven by consistent global energy demand and ongoing infrastructural development. Strategic opportunities exist for companies focusing on technological innovation, sustainable practices, and expansion into emerging markets. The focus on enhancing pipeline safety, reliability, and environmental performance will continue to shape industry trends. The projected market size in 2033 is estimated at xx Million, representing a significant expansion from the 2024 levels.
Oil and Gas Pipeline Industry Segmentation
-
1. Location of Deployment
- 1.1. Onshore
- 1.2. Offshore
-
2. Type
- 2.1. Crude Oil Pipeline
- 2.2. Gas Pipeline
Oil and Gas Pipeline Industry Segmentation By Geography
- 1. North America
- 2. Europe
- 3. Asia Pacific
- 4. South America
- 5. Middle East and Africa
Oil and Gas Pipeline Industry REPORT HIGHLIGHTS
| Aspects | Details |
|---|---|
| Study Period | 2019-2033 |
| Base Year | 2024 |
| Estimated Year | 2025 |
| Forecast Period | 2025-2033 |
| Historical Period | 2019-2024 |
| Growth Rate | CAGR of > 6.50% from 2019-2033 |
| Segmentation |
|
Table of Contents
- 1. Introduction
- 1.1. Research Scope
- 1.2. Market Segmentation
- 1.3. Research Methodology
- 1.4. Definitions and Assumptions
- 2. Executive Summary
- 2.1. Introduction
- 3. Market Dynamics
- 3.1. Introduction
- 3.2. Market Drivers
- 3.2.1. 4.; Rising Demand for Increaing Refinening Capacity4.; Increasing Investment in Downstream Sector
- 3.3. Market Restrains
- 3.3.1. 4.; Fluctuating Price of Crude Oil May Impede the Development of the Downstream Sector
- 3.4. Market Trends
- 3.4.1. The Gas Pipeline Segment to Dominate the Market
- 4. Market Factor Analysis
- 4.1. Porters Five Forces
- 4.2. Supply/Value Chain
- 4.3. PESTEL analysis
- 4.4. Market Entropy
- 4.5. Patent/Trademark Analysis
- 5. Global Oil and Gas Pipeline Industry Analysis, Insights and Forecast, 2019-2031
- 5.1. Market Analysis, Insights and Forecast - by Location of Deployment
- 5.1.1. Onshore
- 5.1.2. Offshore
- 5.2. Market Analysis, Insights and Forecast - by Type
- 5.2.1. Crude Oil Pipeline
- 5.2.2. Gas Pipeline
- 5.3. Market Analysis, Insights and Forecast - by Region
- 5.3.1. North America
- 5.3.2. Europe
- 5.3.3. Asia Pacific
- 5.3.4. South America
- 5.3.5. Middle East and Africa
- 5.1. Market Analysis, Insights and Forecast - by Location of Deployment
- 6. North America Oil and Gas Pipeline Industry Analysis, Insights and Forecast, 2019-2031
- 6.1. Market Analysis, Insights and Forecast - by Location of Deployment
- 6.1.1. Onshore
- 6.1.2. Offshore
- 6.2. Market Analysis, Insights and Forecast - by Type
- 6.2.1. Crude Oil Pipeline
- 6.2.2. Gas Pipeline
- 6.1. Market Analysis, Insights and Forecast - by Location of Deployment
- 7. Europe Oil and Gas Pipeline Industry Analysis, Insights and Forecast, 2019-2031
- 7.1. Market Analysis, Insights and Forecast - by Location of Deployment
- 7.1.1. Onshore
- 7.1.2. Offshore
- 7.2. Market Analysis, Insights and Forecast - by Type
- 7.2.1. Crude Oil Pipeline
- 7.2.2. Gas Pipeline
- 7.1. Market Analysis, Insights and Forecast - by Location of Deployment
- 8. Asia Pacific Oil and Gas Pipeline Industry Analysis, Insights and Forecast, 2019-2031
- 8.1. Market Analysis, Insights and Forecast - by Location of Deployment
- 8.1.1. Onshore
- 8.1.2. Offshore
- 8.2. Market Analysis, Insights and Forecast - by Type
- 8.2.1. Crude Oil Pipeline
- 8.2.2. Gas Pipeline
- 8.1. Market Analysis, Insights and Forecast - by Location of Deployment
- 9. South America Oil and Gas Pipeline Industry Analysis, Insights and Forecast, 2019-2031
- 9.1. Market Analysis, Insights and Forecast - by Location of Deployment
- 9.1.1. Onshore
- 9.1.2. Offshore
- 9.2. Market Analysis, Insights and Forecast - by Type
- 9.2.1. Crude Oil Pipeline
- 9.2.2. Gas Pipeline
- 9.1. Market Analysis, Insights and Forecast - by Location of Deployment
- 10. Middle East and Africa Oil and Gas Pipeline Industry Analysis, Insights and Forecast, 2019-2031
- 10.1. Market Analysis, Insights and Forecast - by Location of Deployment
- 10.1.1. Onshore
- 10.1.2. Offshore
- 10.2. Market Analysis, Insights and Forecast - by Type
- 10.2.1. Crude Oil Pipeline
- 10.2.2. Gas Pipeline
- 10.1. Market Analysis, Insights and Forecast - by Location of Deployment
- 11. North America Oil and Gas Pipeline Industry Analysis, Insights and Forecast, 2019-2031
- 11.1. Market Analysis, Insights and Forecast - By Country/Sub-region
- 11.1.1 United States
- 11.1.2 Canada
- 11.1.3 Mexico
- 12. Europe Oil and Gas Pipeline Industry Analysis, Insights and Forecast, 2019-2031
- 12.1. Market Analysis, Insights and Forecast - By Country/Sub-region
- 12.1.1 Germany
- 12.1.2 United Kingdom
- 12.1.3 France
- 12.1.4 Spain
- 12.1.5 Italy
- 12.1.6 Spain
- 12.1.7 Belgium
- 12.1.8 Netherland
- 12.1.9 Nordics
- 12.1.10 Rest of Europe
- 13. Asia Pacific Oil and Gas Pipeline Industry Analysis, Insights and Forecast, 2019-2031
- 13.1. Market Analysis, Insights and Forecast - By Country/Sub-region
- 13.1.1 China
- 13.1.2 Japan
- 13.1.3 India
- 13.1.4 South Korea
- 13.1.5 Southeast Asia
- 13.1.6 Australia
- 13.1.7 Indonesia
- 13.1.8 Phillipes
- 13.1.9 Singapore
- 13.1.10 Thailandc
- 13.1.11 Rest of Asia Pacific
- 14. South America Oil and Gas Pipeline Industry Analysis, Insights and Forecast, 2019-2031
- 14.1. Market Analysis, Insights and Forecast - By Country/Sub-region
- 14.1.1 Brazil
- 14.1.2 Argentina
- 14.1.3 Peru
- 14.1.4 Chile
- 14.1.5 Colombia
- 14.1.6 Ecuador
- 14.1.7 Venezuela
- 14.1.8 Rest of South America
- 15. MEA Oil and Gas Pipeline Industry Analysis, Insights and Forecast, 2019-2031
- 15.1. Market Analysis, Insights and Forecast - By Country/Sub-region
- 15.1.1 United Arab Emirates
- 15.1.2 Saudi Arabia
- 15.1.3 South Africa
- 15.1.4 Rest of Middle East and Africa
- 16. Competitive Analysis
- 16.1. Global Market Share Analysis 2024
- 16.2. Company Profiles
- 16.2.1 TMK Group
- 16.2.1.1. Overview
- 16.2.1.2. Products
- 16.2.1.3. SWOT Analysis
- 16.2.1.4. Recent Developments
- 16.2.1.5. Financials (Based on Availability)
- 16.2.2 TechnipFMC PLC
- 16.2.2.1. Overview
- 16.2.2.2. Products
- 16.2.2.3. SWOT Analysis
- 16.2.2.4. Recent Developments
- 16.2.2.5. Financials (Based on Availability)
- 16.2.3 OMK Steel Ltd
- 16.2.3.1. Overview
- 16.2.3.2. Products
- 16.2.3.3. SWOT Analysis
- 16.2.3.4. Recent Developments
- 16.2.3.5. Financials (Based on Availability)
- 16.2.4 Tenaris Inc
- 16.2.4.1. Overview
- 16.2.4.2. Products
- 16.2.4.3. SWOT Analysis
- 16.2.4.4. Recent Developments
- 16.2.4.5. Financials (Based on Availability)
- 16.2.5 United States Steel Corporation
- 16.2.5.1. Overview
- 16.2.5.2. Products
- 16.2.5.3. SWOT Analysis
- 16.2.5.4. Recent Developments
- 16.2.5.5. Financials (Based on Availability)
- 16.2.6 Nippon Steel Corporation
- 16.2.6.1. Overview
- 16.2.6.2. Products
- 16.2.6.3. SWOT Analysis
- 16.2.6.4. Recent Developments
- 16.2.6.5. Financials (Based on Availability)
- 16.2.7 ChelPipe Group
- 16.2.7.1. Overview
- 16.2.7.2. Products
- 16.2.7.3. SWOT Analysis
- 16.2.7.4. Recent Developments
- 16.2.7.5. Financials (Based on Availability)
- 16.2.8 Shengli Oil & Gas Pipe Holdings Limited
- 16.2.8.1. Overview
- 16.2.8.2. Products
- 16.2.8.3. SWOT Analysis
- 16.2.8.4. Recent Developments
- 16.2.8.5. Financials (Based on Availability)
- 16.2.9 Mott Macdonald Group Ltd
- 16.2.9.1. Overview
- 16.2.9.2. Products
- 16.2.9.3. SWOT Analysis
- 16.2.9.4. Recent Developments
- 16.2.9.5. Financials (Based on Availability)
- 16.2.1 TMK Group
List of Figures
- Figure 1: Global Oil and Gas Pipeline Industry Revenue Breakdown (Million, %) by Region 2024 & 2032
- Figure 2: North America Oil and Gas Pipeline Industry Revenue (Million), by Country 2024 & 2032
- Figure 3: North America Oil and Gas Pipeline Industry Revenue Share (%), by Country 2024 & 2032
- Figure 4: Europe Oil and Gas Pipeline Industry Revenue (Million), by Country 2024 & 2032
- Figure 5: Europe Oil and Gas Pipeline Industry Revenue Share (%), by Country 2024 & 2032
- Figure 6: Asia Pacific Oil and Gas Pipeline Industry Revenue (Million), by Country 2024 & 2032
- Figure 7: Asia Pacific Oil and Gas Pipeline Industry Revenue Share (%), by Country 2024 & 2032
- Figure 8: South America Oil and Gas Pipeline Industry Revenue (Million), by Country 2024 & 2032
- Figure 9: South America Oil and Gas Pipeline Industry Revenue Share (%), by Country 2024 & 2032
- Figure 10: MEA Oil and Gas Pipeline Industry Revenue (Million), by Country 2024 & 2032
- Figure 11: MEA Oil and Gas Pipeline Industry Revenue Share (%), by Country 2024 & 2032
- Figure 12: North America Oil and Gas Pipeline Industry Revenue (Million), by Location of Deployment 2024 & 2032
- Figure 13: North America Oil and Gas Pipeline Industry Revenue Share (%), by Location of Deployment 2024 & 2032
- Figure 14: North America Oil and Gas Pipeline Industry Revenue (Million), by Type 2024 & 2032
- Figure 15: North America Oil and Gas Pipeline Industry Revenue Share (%), by Type 2024 & 2032
- Figure 16: North America Oil and Gas Pipeline Industry Revenue (Million), by Country 2024 & 2032
- Figure 17: North America Oil and Gas Pipeline Industry Revenue Share (%), by Country 2024 & 2032
- Figure 18: Europe Oil and Gas Pipeline Industry Revenue (Million), by Location of Deployment 2024 & 2032
- Figure 19: Europe Oil and Gas Pipeline Industry Revenue Share (%), by Location of Deployment 2024 & 2032
- Figure 20: Europe Oil and Gas Pipeline Industry Revenue (Million), by Type 2024 & 2032
- Figure 21: Europe Oil and Gas Pipeline Industry Revenue Share (%), by Type 2024 & 2032
- Figure 22: Europe Oil and Gas Pipeline Industry Revenue (Million), by Country 2024 & 2032
- Figure 23: Europe Oil and Gas Pipeline Industry Revenue Share (%), by Country 2024 & 2032
- Figure 24: Asia Pacific Oil and Gas Pipeline Industry Revenue (Million), by Location of Deployment 2024 & 2032
- Figure 25: Asia Pacific Oil and Gas Pipeline Industry Revenue Share (%), by Location of Deployment 2024 & 2032
- Figure 26: Asia Pacific Oil and Gas Pipeline Industry Revenue (Million), by Type 2024 & 2032
- Figure 27: Asia Pacific Oil and Gas Pipeline Industry Revenue Share (%), by Type 2024 & 2032
- Figure 28: Asia Pacific Oil and Gas Pipeline Industry Revenue (Million), by Country 2024 & 2032
- Figure 29: Asia Pacific Oil and Gas Pipeline Industry Revenue Share (%), by Country 2024 & 2032
- Figure 30: South America Oil and Gas Pipeline Industry Revenue (Million), by Location of Deployment 2024 & 2032
- Figure 31: South America Oil and Gas Pipeline Industry Revenue Share (%), by Location of Deployment 2024 & 2032
- Figure 32: South America Oil and Gas Pipeline Industry Revenue (Million), by Type 2024 & 2032
- Figure 33: South America Oil and Gas Pipeline Industry Revenue Share (%), by Type 2024 & 2032
- Figure 34: South America Oil and Gas Pipeline Industry Revenue (Million), by Country 2024 & 2032
- Figure 35: South America Oil and Gas Pipeline Industry Revenue Share (%), by Country 2024 & 2032
- Figure 36: Middle East and Africa Oil and Gas Pipeline Industry Revenue (Million), by Location of Deployment 2024 & 2032
- Figure 37: Middle East and Africa Oil and Gas Pipeline Industry Revenue Share (%), by Location of Deployment 2024 & 2032
- Figure 38: Middle East and Africa Oil and Gas Pipeline Industry Revenue (Million), by Type 2024 & 2032
- Figure 39: Middle East and Africa Oil and Gas Pipeline Industry Revenue Share (%), by Type 2024 & 2032
- Figure 40: Middle East and Africa Oil and Gas Pipeline Industry Revenue (Million), by Country 2024 & 2032
- Figure 41: Middle East and Africa Oil and Gas Pipeline Industry Revenue Share (%), by Country 2024 & 2032
List of Tables
- Table 1: Global Oil and Gas Pipeline Industry Revenue Million Forecast, by Region 2019 & 2032
- Table 2: Global Oil and Gas Pipeline Industry Revenue Million Forecast, by Location of Deployment 2019 & 2032
- Table 3: Global Oil and Gas Pipeline Industry Revenue Million Forecast, by Type 2019 & 2032
- Table 4: Global Oil and Gas Pipeline Industry Revenue Million Forecast, by Region 2019 & 2032
- Table 5: Global Oil and Gas Pipeline Industry Revenue Million Forecast, by Country 2019 & 2032
- Table 6: United States Oil and Gas Pipeline Industry Revenue (Million) Forecast, by Application 2019 & 2032
- Table 7: Canada Oil and Gas Pipeline Industry Revenue (Million) Forecast, by Application 2019 & 2032
- Table 8: Mexico Oil and Gas Pipeline Industry Revenue (Million) Forecast, by Application 2019 & 2032
- Table 9: Global Oil and Gas Pipeline Industry Revenue Million Forecast, by Country 2019 & 2032
- Table 10: Germany Oil and Gas Pipeline Industry Revenue (Million) Forecast, by Application 2019 & 2032
- Table 11: United Kingdom Oil and Gas Pipeline Industry Revenue (Million) Forecast, by Application 2019 & 2032
- Table 12: France Oil and Gas Pipeline Industry Revenue (Million) Forecast, by Application 2019 & 2032
- Table 13: Spain Oil and Gas Pipeline Industry Revenue (Million) Forecast, by Application 2019 & 2032
- Table 14: Italy Oil and Gas Pipeline Industry Revenue (Million) Forecast, by Application 2019 & 2032
- Table 15: Spain Oil and Gas Pipeline Industry Revenue (Million) Forecast, by Application 2019 & 2032
- Table 16: Belgium Oil and Gas Pipeline Industry Revenue (Million) Forecast, by Application 2019 & 2032
- Table 17: Netherland Oil and Gas Pipeline Industry Revenue (Million) Forecast, by Application 2019 & 2032
- Table 18: Nordics Oil and Gas Pipeline Industry Revenue (Million) Forecast, by Application 2019 & 2032
- Table 19: Rest of Europe Oil and Gas Pipeline Industry Revenue (Million) Forecast, by Application 2019 & 2032
- Table 20: Global Oil and Gas Pipeline Industry Revenue Million Forecast, by Country 2019 & 2032
- Table 21: China Oil and Gas Pipeline Industry Revenue (Million) Forecast, by Application 2019 & 2032
- Table 22: Japan Oil and Gas Pipeline Industry Revenue (Million) Forecast, by Application 2019 & 2032
- Table 23: India Oil and Gas Pipeline Industry Revenue (Million) Forecast, by Application 2019 & 2032
- Table 24: South Korea Oil and Gas Pipeline Industry Revenue (Million) Forecast, by Application 2019 & 2032
- Table 25: Southeast Asia Oil and Gas Pipeline Industry Revenue (Million) Forecast, by Application 2019 & 2032
- Table 26: Australia Oil and Gas Pipeline Industry Revenue (Million) Forecast, by Application 2019 & 2032
- Table 27: Indonesia Oil and Gas Pipeline Industry Revenue (Million) Forecast, by Application 2019 & 2032
- Table 28: Phillipes Oil and Gas Pipeline Industry Revenue (Million) Forecast, by Application 2019 & 2032
- Table 29: Singapore Oil and Gas Pipeline Industry Revenue (Million) Forecast, by Application 2019 & 2032
- Table 30: Thailandc Oil and Gas Pipeline Industry Revenue (Million) Forecast, by Application 2019 & 2032
- Table 31: Rest of Asia Pacific Oil and Gas Pipeline Industry Revenue (Million) Forecast, by Application 2019 & 2032
- Table 32: Global Oil and Gas Pipeline Industry Revenue Million Forecast, by Country 2019 & 2032
- Table 33: Brazil Oil and Gas Pipeline Industry Revenue (Million) Forecast, by Application 2019 & 2032
- Table 34: Argentina Oil and Gas Pipeline Industry Revenue (Million) Forecast, by Application 2019 & 2032
- Table 35: Peru Oil and Gas Pipeline Industry Revenue (Million) Forecast, by Application 2019 & 2032
- Table 36: Chile Oil and Gas Pipeline Industry Revenue (Million) Forecast, by Application 2019 & 2032
- Table 37: Colombia Oil and Gas Pipeline Industry Revenue (Million) Forecast, by Application 2019 & 2032
- Table 38: Ecuador Oil and Gas Pipeline Industry Revenue (Million) Forecast, by Application 2019 & 2032
- Table 39: Venezuela Oil and Gas Pipeline Industry Revenue (Million) Forecast, by Application 2019 & 2032
- Table 40: Rest of South America Oil and Gas Pipeline Industry Revenue (Million) Forecast, by Application 2019 & 2032
- Table 41: Global Oil and Gas Pipeline Industry Revenue Million Forecast, by Country 2019 & 2032
- Table 42: United Arab Emirates Oil and Gas Pipeline Industry Revenue (Million) Forecast, by Application 2019 & 2032
- Table 43: Saudi Arabia Oil and Gas Pipeline Industry Revenue (Million) Forecast, by Application 2019 & 2032
- Table 44: South Africa Oil and Gas Pipeline Industry Revenue (Million) Forecast, by Application 2019 & 2032
- Table 45: Rest of Middle East and Africa Oil and Gas Pipeline Industry Revenue (Million) Forecast, by Application 2019 & 2032
- Table 46: Global Oil and Gas Pipeline Industry Revenue Million Forecast, by Location of Deployment 2019 & 2032
- Table 47: Global Oil and Gas Pipeline Industry Revenue Million Forecast, by Type 2019 & 2032
- Table 48: Global Oil and Gas Pipeline Industry Revenue Million Forecast, by Country 2019 & 2032
- Table 49: Global Oil and Gas Pipeline Industry Revenue Million Forecast, by Location of Deployment 2019 & 2032
- Table 50: Global Oil and Gas Pipeline Industry Revenue Million Forecast, by Type 2019 & 2032
- Table 51: Global Oil and Gas Pipeline Industry Revenue Million Forecast, by Country 2019 & 2032
- Table 52: Global Oil and Gas Pipeline Industry Revenue Million Forecast, by Location of Deployment 2019 & 2032
- Table 53: Global Oil and Gas Pipeline Industry Revenue Million Forecast, by Type 2019 & 2032
- Table 54: Global Oil and Gas Pipeline Industry Revenue Million Forecast, by Country 2019 & 2032
- Table 55: Global Oil and Gas Pipeline Industry Revenue Million Forecast, by Location of Deployment 2019 & 2032
- Table 56: Global Oil and Gas Pipeline Industry Revenue Million Forecast, by Type 2019 & 2032
- Table 57: Global Oil and Gas Pipeline Industry Revenue Million Forecast, by Country 2019 & 2032
- Table 58: Global Oil and Gas Pipeline Industry Revenue Million Forecast, by Location of Deployment 2019 & 2032
- Table 59: Global Oil and Gas Pipeline Industry Revenue Million Forecast, by Type 2019 & 2032
- Table 60: Global Oil and Gas Pipeline Industry Revenue Million Forecast, by Country 2019 & 2032
Frequently Asked Questions
1. What is the projected Compound Annual Growth Rate (CAGR) of the Oil and Gas Pipeline Industry?
The projected CAGR is approximately > 6.50%.
2. Which companies are prominent players in the Oil and Gas Pipeline Industry?
Key companies in the market include TMK Group, TechnipFMC PLC, OMK Steel Ltd, Tenaris Inc, United States Steel Corporation, Nippon Steel Corporation, ChelPipe Group, Shengli Oil & Gas Pipe Holdings Limited, Mott Macdonald Group Ltd.
3. What are the main segments of the Oil and Gas Pipeline Industry?
The market segments include Location of Deployment, Type.
4. Can you provide details about the market size?
The market size is estimated to be USD XX Million as of 2022.
5. What are some drivers contributing to market growth?
4.; Rising Demand for Increaing Refinening Capacity4.; Increasing Investment in Downstream Sector.
6. What are the notable trends driving market growth?
The Gas Pipeline Segment to Dominate the Market.
7. Are there any restraints impacting market growth?
4.; Fluctuating Price of Crude Oil May Impede the Development of the Downstream Sector.
8. Can you provide examples of recent developments in the market?
June 2022: Kalpataru Power Transmission Limited (KPTL) was awarded the laying & construction of a steel gas pipeline and terminals along with associated facilities for Section II of the Mumbai - Nagpur Pipeline Project (Part A) for GAIL (India) Ltd.
9. What pricing options are available for accessing the report?
Pricing options include single-user, multi-user, and enterprise licenses priced at USD 4750, USD 5250, and USD 8750 respectively.
10. Is the market size provided in terms of value or volume?
The market size is provided in terms of value, measured in Million.
11. Are there any specific market keywords associated with the report?
Yes, the market keyword associated with the report is "Oil and Gas Pipeline Industry," which aids in identifying and referencing the specific market segment covered.
12. How do I determine which pricing option suits my needs best?
The pricing options vary based on user requirements and access needs. Individual users may opt for single-user licenses, while businesses requiring broader access may choose multi-user or enterprise licenses for cost-effective access to the report.
13. Are there any additional resources or data provided in the Oil and Gas Pipeline Industry report?
While the report offers comprehensive insights, it's advisable to review the specific contents or supplementary materials provided to ascertain if additional resources or data are available.
14. How can I stay updated on further developments or reports in the Oil and Gas Pipeline Industry?
To stay informed about further developments, trends, and reports in the Oil and Gas Pipeline Industry, consider subscribing to industry newsletters, following relevant companies and organizations, or regularly checking reputable industry news sources and publications.
Methodology
Step 1 - Identification of Relevant Samples Size from Population Database


Step 2 - Approaches for Defining Global Market Size (Value, Volume* & Price*)

Note*: In applicable scenarios
Step 3 - Data Sources
Primary Research
- Web Analytics
- Survey Reports
- Research Institute
- Latest Research Reports
- Opinion Leaders
Secondary Research
- Annual Reports
- White Paper
- Latest Press Release
- Industry Association
- Paid Database
- Investor Presentations

Step 4 - Data Triangulation
Involves using different sources of information in order to increase the validity of a study
These sources are likely to be stakeholders in a program - participants, other researchers, program staff, other community members, and so on.
Then we put all data in single framework & apply various statistical tools to find out the dynamic on the market.
During the analysis stage, feedback from the stakeholder groups would be compared to determine areas of agreement as well as areas of divergence
