

Key Insights
The oligonucleotide therapeutics market is poised for substantial expansion, fueled by technological innovations, a rising incidence of genetic disorders, and the increasing adoption of personalized medicine. With a projected CAGR of 19.7%, the market is anticipated to reach 7.19 billion by 2025. Key drivers include the successful commercialization of oligonucleotide-based drugs for conditions such as cancer and rare genetic diseases, validating their therapeutic potential. Continuous R&D efforts are yielding novel therapeutics with enhanced efficacy and reduced side effects. Significant investments from pharmaceutical and biotechnology firms, alongside supportive regulatory policies, further propel market growth.
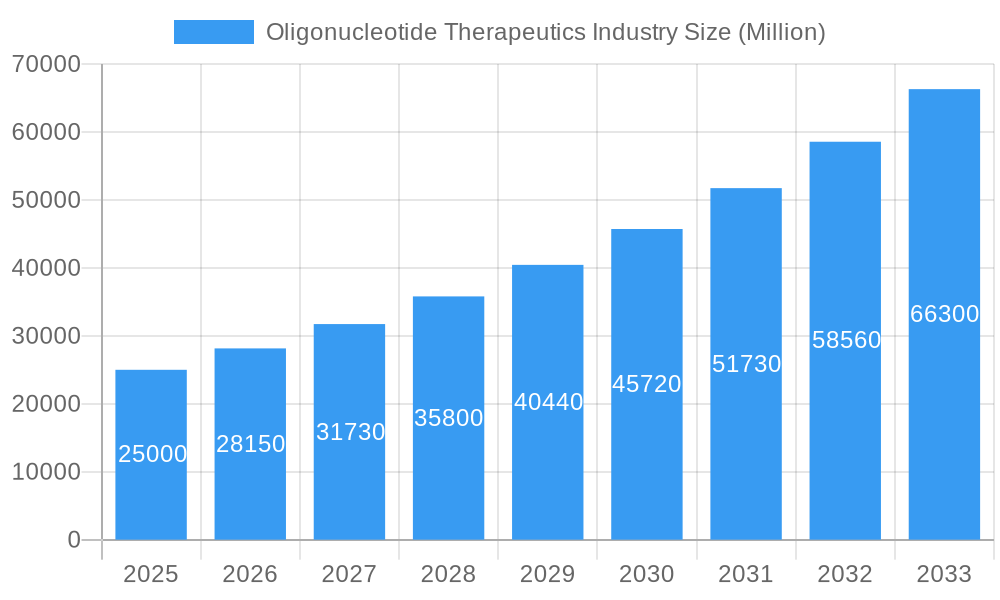
Oligonucleotide Therapeutics Industry Market Size (In Billion)
Market segmentation highlights significant opportunities. The therapeutics application segment is expected to lead, driven by an expanding portfolio of FDA-approved oligonucleotide drugs and a robust pipeline in clinical trials. Pharmaceutical and biotechnology companies are pivotal end-users, actively engaged in research, development, and commercialization. Geographically, North America and Europe currently dominate, supported by advanced healthcare infrastructure and research capabilities. The Asia-Pacific region, however, presents a high-growth opportunity, attributed to increasing healthcare expenditure and a growing prevalence of genetic diseases. The competitive landscape features both established multinational corporations and specialized biotechnology firms, fostering innovation. Despite regulatory complexities and high development costs, the market outlook remains optimistic, propelled by ongoing technological advancements and unmet medical needs.
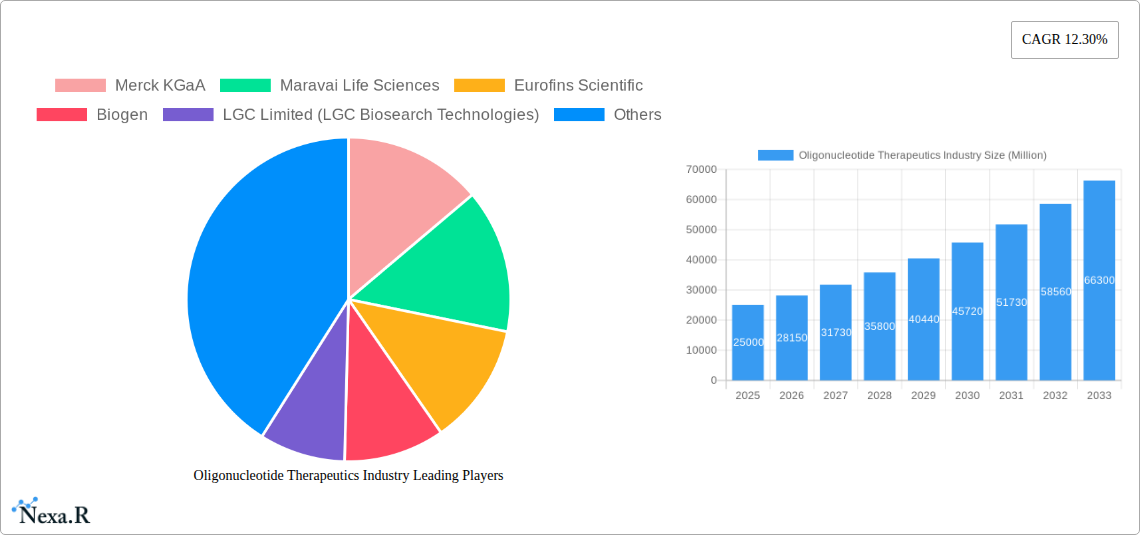
Oligonucleotide Therapeutics Industry Company Market Share
Oligonucleotide Therapeutics Industry: Market Report 2019-2033
This comprehensive report provides a detailed analysis of the oligonucleotide therapeutics industry, encompassing market dynamics, growth trends, key players, and future outlook. With a focus on the parent market of therapeutic agents and child markets within oligonucleotide therapeutics, this report is an essential resource for industry professionals, investors, and researchers seeking to understand this rapidly evolving sector. The study period covers 2019-2033, with 2025 as the base and estimated year. The forecast period extends from 2025 to 2033, while the historical period spans 2019-2024. The market size is presented in million units.
Oligonucleotide Therapeutics Industry Market Dynamics & Structure
The oligonucleotide therapeutics market is characterized by a moderately concentrated structure, with several key players holding significant market share. Technological innovation, particularly in areas like mRNA therapeutics and gene editing, is a major driver of growth. Stringent regulatory frameworks influence product development and market access, while the emergence of competitive substitutes, such as other targeted therapies, presents ongoing challenges. End-user demographics show significant demand from pharmaceutical and biotechnology companies, followed by academic research institutes and hospital & diagnostic laboratories. The industry has witnessed a moderate level of M&A activity in recent years, driven by the desire for companies to expand their product portfolios and geographic reach.
- Market Concentration: Moderately concentrated, with top 10 players holding approximately xx% market share in 2024.
- Technological Innovation: Significant advancements in mRNA technology, CRISPR-Cas9 gene editing, and antisense oligonucleotide (ASO) therapies are driving innovation.
- Regulatory Framework: Stringent regulatory approvals and clinical trial processes present challenges and influence market entry.
- Competitive Substitutes: Emerging targeted therapies and other treatment modalities pose competitive pressure.
- M&A Activity: Approximately xx M&A deals occurred between 2019-2024, with a focus on expanding therapeutic areas and manufacturing capabilities.
- End-User Demographics: Pharmaceutical and biotechnology companies account for approximately xx% of market demand, followed by academic research institutes (xx%) and hospital & diagnostic laboratories (xx%).
Oligonucleotide Therapeutics Industry Growth Trends & Insights
The oligonucleotide therapeutics market is experiencing substantial growth, driven by the increasing prevalence of chronic diseases, technological advancements leading to improved efficacy and safety profiles of oligonucleotide-based therapies, and rising investments in research and development. The market size is projected to grow at a Compound Annual Growth Rate (CAGR) of xx% from 2025 to 2033, reaching an estimated value of xx million units by 2033. Market penetration is steadily increasing, particularly in oncology, rare diseases, and neurological disorders. Technological disruptions, such as the development of novel delivery systems and improved synthesis methods, are further propelling market expansion. Consumer behavior shifts towards personalized medicine and targeted therapies are creating favorable market conditions.
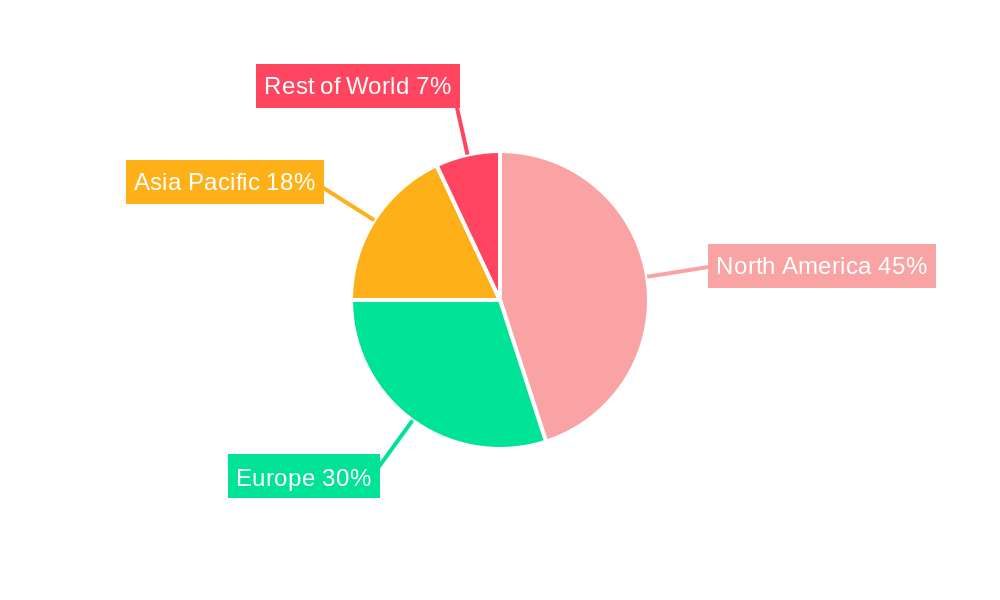
Dominant Regions, Countries, or Segments in Oligonucleotide Therapeutics Industry
North America currently holds the largest market share in the oligonucleotide therapeutics industry, driven by robust R&D investments, advanced healthcare infrastructure, and the presence of major pharmaceutical and biotechnology companies. Europe follows closely, exhibiting significant growth potential due to increasing government funding for research and a rising prevalence of chronic diseases. Within product types, Synthesized Oligonucleotide Products command the largest market segment. The Therapeutics application segment exhibits the fastest growth rate due to the increasing adoption of oligonucleotide-based therapies for treating various diseases.
- Leading Region: North America (xx% market share in 2024)
- Key Drivers: Robust R&D investment (North America), increasing prevalence of chronic diseases (Europe), supportive government policies (various regions).
- Product Type Dominance: Synthesized Oligonucleotide Products (xx% market share)
- Fastest Growing Segment (Application): Therapeutics (xx% CAGR)
- High Growth Potential: Asia-Pacific, driven by increasing healthcare expenditure and growing awareness of oligonucleotide-based treatments.
Oligonucleotide Therapeutics Industry Product Landscape
The oligonucleotide therapeutics product landscape is constantly evolving, with ongoing innovation in product design, manufacturing processes, and delivery systems. Products range from synthesized oligonucleotide products for research applications to specialized reagents and equipment used in oligonucleotide synthesis and analysis. Key advancements include the development of novel conjugation chemistries, enabling targeted drug delivery, and the improvement of manufacturing scalability to meet growing demand. Companies are focused on creating unique selling propositions through enhanced efficacy, improved safety profiles, and more convenient administration methods.
Key Drivers, Barriers & Challenges in Oligonucleotide Therapeutics Industry
Key Drivers:
- Technological advancements in oligonucleotide synthesis and delivery.
- Growing prevalence of chronic and genetic diseases.
- Increased investments in R&D by pharmaceutical companies.
- Favorable regulatory landscape for innovative therapies.
Key Barriers & Challenges:
- High cost of production and drug development.
- Complex regulatory approval process for new therapies.
- Potential for off-target effects and immunogenicity.
- Competition from other therapeutic modalities. The high cost of oligonucleotide production leads to a xx% higher price point compared to conventional drugs impacting market access for a subset of patients (xx% reduction in market access due to pricing).
Emerging Opportunities in Oligonucleotide Therapeutics Industry
- Expanding applications into new therapeutic areas such as infectious diseases and autoimmune disorders.
- Development of novel oligonucleotide-based therapies for unmet medical needs.
- Growing interest in using oligonucleotides for gene editing and gene therapy.
- Expansion into emerging markets with high disease burden.
Growth Accelerators in the Oligonucleotide Therapeutics Industry
The long-term growth of the oligonucleotide therapeutics industry is fueled by ongoing technological breakthroughs in delivery systems and synthesis methods, leading to improved efficacy and reduced side effects. Strategic partnerships between pharmaceutical companies and biotech firms are accelerating product development and market entry. The expansion of oligonucleotide therapies into new therapeutic areas, and the growing adoption of personalized medicine further contribute to the industry's sustained growth.
Key Players Shaping the Oligonucleotide Therapeutics Market
- Merck KGaA
- Maravai Life Sciences
- Eurofins Scientific
- Biogen
- LGC Limited (LGC Biosearch Technologies)
- Danaher Corporation
- GenScript
- Sarepta Therapeutics Inc
- Thermo Fisher Scientific
- Bio-Synthesis Inc
- Agilent Technologies
- Kaneka Corporation (Eurogentec)
Notable Milestones in Oligonucleotide Therapeutics Industry Sector
- July 2022: WuXi STA launches a new large-scale oligonucleotide and peptide manufacturing facility, significantly increasing global manufacturing capacity.
- April 2022: Bachem partners with Eli Lilly & Company to develop and manufacture oligonucleotide-based active pharmaceutical ingredients, signifying significant investment in this therapeutic class.
In-Depth Oligonucleotide Therapeutics Industry Market Outlook
The oligonucleotide therapeutics market is poised for significant growth over the next decade, driven by ongoing technological advancements, strategic partnerships, and an expanding pipeline of new therapies. The continued focus on personalized medicine and the increasing prevalence of chronic diseases will further stimulate market demand. Companies with a strong R&D pipeline, robust manufacturing capabilities, and a focus on innovative delivery systems are well-positioned to capitalize on the significant opportunities presented by this dynamic market.
Oligonucleotide Therapeutics Industry Segmentation
-
1. Product Type
- 1.1. Synthesized Oligonucleotide Products
- 1.2. Reagents
- 1.3. Equipment
- 1.4. Services
-
2. Application
- 2.1. Research
- 2.2. Diagnostics
- 2.3. Therapeutics
-
3. End-user
- 3.1. Academic Research Institutes
- 3.2. Pharmaceutical and Biotechnology Companies
- 3.3. Hospital and Diagnostic Laboratories
Oligonucleotide Therapeutics Industry Segmentation By Geography
-
1. North America
- 1.1. United States
- 1.2. Canada
- 1.3. Mexico
-
2. Europe
- 2.1. Germany
- 2.2. United Kingdom
- 2.3. France
- 2.4. Italy
- 2.5. Spain
- 2.6. Rest of Europe
-
3. Asia Pacific
- 3.1. China
- 3.2. Japan
- 3.3. India
- 3.4. Australia
- 3.5. South Korea
- 3.6. Rest of Asia Pacific
-
4. Middle East and Africa
- 4.1. GCC
- 4.2. South Africa
- 4.3. Rest of Middle East and Africa
-
5. South America
- 5.1. Brazil
- 5.2. Argentina
- 5.3. Rest of South America
Oligonucleotide Therapeutics Industry Regional Market Share
Geographic Coverage of Oligonucleotide Therapeutics Industry
Oligonucleotide Therapeutics Industry REPORT HIGHLIGHTS
| Aspects | Details |
|---|---|
| Study Period | 2020-2034 |
| Base Year | 2025 |
| Estimated Year | 2026 |
| Forecast Period | 2026-2034 |
| Historical Period | 2020-2025 |
| Growth Rate | CAGR of 19.7% from 2020-2034 |
| Segmentation |
|
Table of Contents
- 1. Introduction
- 1.1. Research Scope
- 1.2. Market Segmentation
- 1.3. Research Objective
- 1.4. Definitions and Assumptions
- 2. Executive Summary
- 2.1. Market Snapshot
- 3. Market Dynamics
- 3.1. Market Drivers
- 3.2. Market Restrains
- 3.3. Market Trends
- 3.4. Market Opportunities
- 4. Market Factor Analysis
- 4.1. Porters Five Forces
- 4.1.1. Bargaining Power of Suppliers
- 4.1.2. Bargaining Power of Buyers
- 4.1.3. Threat of New Entrants
- 4.1.4. Threat of Substitutes
- 4.1.5. Competitive Rivalry
- 4.2. PESTEL analysis
- 4.3. BCG Analysis
- 4.3.1. Stars (High Growth, High Market Share)
- 4.3.2. Cash Cows (Low Growth, High Market Share)
- 4.3.3. Question Mark (High Growth, Low Market Share)
- 4.3.4. Dogs (Low Growth, Low Market Share)
- 4.4. Ansoff Matrix Analysis
- 4.5. Supply Chain Analysis
- 4.6. Regulatory Landscape
- 4.7. Current Market Potential and Opportunity Assessment (TAM–SAM–SOM Framework)
- 4.8. NRP Analyst Note
- 4.1. Porters Five Forces
- 5. Market Analysis, Insights and Forecast 2021-2033
- 5.1. Market Analysis, Insights and Forecast - by Product Type
- 5.1.1. Synthesized Oligonucleotide Products
- 5.1.2. Reagents
- 5.1.3. Equipment
- 5.1.4. Services
- 5.2. Market Analysis, Insights and Forecast - by Application
- 5.2.1. Research
- 5.2.2. Diagnostics
- 5.2.3. Therapeutics
- 5.3. Market Analysis, Insights and Forecast - by End-user
- 5.3.1. Academic Research Institutes
- 5.3.2. Pharmaceutical and Biotechnology Companies
- 5.3.3. Hospital and Diagnostic Laboratories
- 5.4. Market Analysis, Insights and Forecast - by Region
- 5.4.1. North America
- 5.4.2. Europe
- 5.4.3. Asia Pacific
- 5.4.4. Middle East and Africa
- 5.4.5. South America
- 5.1. Market Analysis, Insights and Forecast - by Product Type
- 6. Global Oligonucleotide Therapeutics Industry Analysis, Insights and Forecast, 2021-2033
- 6.1. Market Analysis, Insights and Forecast - by Product Type
- 6.1.1. Synthesized Oligonucleotide Products
- 6.1.2. Reagents
- 6.1.3. Equipment
- 6.1.4. Services
- 6.2. Market Analysis, Insights and Forecast - by Application
- 6.2.1. Research
- 6.2.2. Diagnostics
- 6.2.3. Therapeutics
- 6.3. Market Analysis, Insights and Forecast - by End-user
- 6.3.1. Academic Research Institutes
- 6.3.2. Pharmaceutical and Biotechnology Companies
- 6.3.3. Hospital and Diagnostic Laboratories
- 6.1. Market Analysis, Insights and Forecast - by Product Type
- 7. North America Oligonucleotide Therapeutics Industry Analysis, Insights and Forecast, 2020-2032
- 7.1. Market Analysis, Insights and Forecast - by Product Type
- 7.1.1. Synthesized Oligonucleotide Products
- 7.1.2. Reagents
- 7.1.3. Equipment
- 7.1.4. Services
- 7.2. Market Analysis, Insights and Forecast - by Application
- 7.2.1. Research
- 7.2.2. Diagnostics
- 7.2.3. Therapeutics
- 7.3. Market Analysis, Insights and Forecast - by End-user
- 7.3.1. Academic Research Institutes
- 7.3.2. Pharmaceutical and Biotechnology Companies
- 7.3.3. Hospital and Diagnostic Laboratories
- 7.1. Market Analysis, Insights and Forecast - by Product Type
- 8. Europe Oligonucleotide Therapeutics Industry Analysis, Insights and Forecast, 2020-2032
- 8.1. Market Analysis, Insights and Forecast - by Product Type
- 8.1.1. Synthesized Oligonucleotide Products
- 8.1.2. Reagents
- 8.1.3. Equipment
- 8.1.4. Services
- 8.2. Market Analysis, Insights and Forecast - by Application
- 8.2.1. Research
- 8.2.2. Diagnostics
- 8.2.3. Therapeutics
- 8.3. Market Analysis, Insights and Forecast - by End-user
- 8.3.1. Academic Research Institutes
- 8.3.2. Pharmaceutical and Biotechnology Companies
- 8.3.3. Hospital and Diagnostic Laboratories
- 8.1. Market Analysis, Insights and Forecast - by Product Type
- 9. Asia Pacific Oligonucleotide Therapeutics Industry Analysis, Insights and Forecast, 2020-2032
- 9.1. Market Analysis, Insights and Forecast - by Product Type
- 9.1.1. Synthesized Oligonucleotide Products
- 9.1.2. Reagents
- 9.1.3. Equipment
- 9.1.4. Services
- 9.2. Market Analysis, Insights and Forecast - by Application
- 9.2.1. Research
- 9.2.2. Diagnostics
- 9.2.3. Therapeutics
- 9.3. Market Analysis, Insights and Forecast - by End-user
- 9.3.1. Academic Research Institutes
- 9.3.2. Pharmaceutical and Biotechnology Companies
- 9.3.3. Hospital and Diagnostic Laboratories
- 9.1. Market Analysis, Insights and Forecast - by Product Type
- 10. Middle East and Africa Oligonucleotide Therapeutics Industry Analysis, Insights and Forecast, 2020-2032
- 10.1. Market Analysis, Insights and Forecast - by Product Type
- 10.1.1. Synthesized Oligonucleotide Products
- 10.1.2. Reagents
- 10.1.3. Equipment
- 10.1.4. Services
- 10.2. Market Analysis, Insights and Forecast - by Application
- 10.2.1. Research
- 10.2.2. Diagnostics
- 10.2.3. Therapeutics
- 10.3. Market Analysis, Insights and Forecast - by End-user
- 10.3.1. Academic Research Institutes
- 10.3.2. Pharmaceutical and Biotechnology Companies
- 10.3.3. Hospital and Diagnostic Laboratories
- 10.1. Market Analysis, Insights and Forecast - by Product Type
- 11. South America Oligonucleotide Therapeutics Industry Analysis, Insights and Forecast, 2020-2032
- 11.1. Market Analysis, Insights and Forecast - by Product Type
- 11.1.1. Synthesized Oligonucleotide Products
- 11.1.2. Reagents
- 11.1.3. Equipment
- 11.1.4. Services
- 11.2. Market Analysis, Insights and Forecast - by Application
- 11.2.1. Research
- 11.2.2. Diagnostics
- 11.2.3. Therapeutics
- 11.3. Market Analysis, Insights and Forecast - by End-user
- 11.3.1. Academic Research Institutes
- 11.3.2. Pharmaceutical and Biotechnology Companies
- 11.3.3. Hospital and Diagnostic Laboratories
- 11.1. Market Analysis, Insights and Forecast - by Product Type
- 12. Competitive Analysis
- 12.1. Company Profiles
- 12.1.1 Merck KGaA
- 12.1.1.1. Company Overview
- 12.1.1.2. Products
- 12.1.1.3. Company Financials
- 12.1.1.4. SWOT Analysis
- 12.1.2 Maravai Life Sciences
- 12.1.2.1. Company Overview
- 12.1.2.2. Products
- 12.1.2.3. Company Financials
- 12.1.2.4. SWOT Analysis
- 12.1.3 Eurofins Scientific
- 12.1.3.1. Company Overview
- 12.1.3.2. Products
- 12.1.3.3. Company Financials
- 12.1.3.4. SWOT Analysis
- 12.1.4 Biogen
- 12.1.4.1. Company Overview
- 12.1.4.2. Products
- 12.1.4.3. Company Financials
- 12.1.4.4. SWOT Analysis
- 12.1.5 LGC Limited (LGC Biosearch Technologies)
- 12.1.5.1. Company Overview
- 12.1.5.2. Products
- 12.1.5.3. Company Financials
- 12.1.5.4. SWOT Analysis
- 12.1.6 Danaher Corporation
- 12.1.6.1. Company Overview
- 12.1.6.2. Products
- 12.1.6.3. Company Financials
- 12.1.6.4. SWOT Analysis
- 12.1.7 GenScript
- 12.1.7.1. Company Overview
- 12.1.7.2. Products
- 12.1.7.3. Company Financials
- 12.1.7.4. SWOT Analysis
- 12.1.8 Sarepta Therapeutics Inc
- 12.1.8.1. Company Overview
- 12.1.8.2. Products
- 12.1.8.3. Company Financials
- 12.1.8.4. SWOT Analysis
- 12.1.9 Thermo Fisher Scientific
- 12.1.9.1. Company Overview
- 12.1.9.2. Products
- 12.1.9.3. Company Financials
- 12.1.9.4. SWOT Analysis
- 12.1.10 Bio-Synthesis Inc
- 12.1.10.1. Company Overview
- 12.1.10.2. Products
- 12.1.10.3. Company Financials
- 12.1.10.4. SWOT Analysis
- 12.1.11 Agilent Technologies
- 12.1.11.1. Company Overview
- 12.1.11.2. Products
- 12.1.11.3. Company Financials
- 12.1.11.4. SWOT Analysis
- 12.1.12 Kaneka Corporation (Eurogentec)
- 12.1.12.1. Company Overview
- 12.1.12.2. Products
- 12.1.12.3. Company Financials
- 12.1.12.4. SWOT Analysis
- 12.1.1 Merck KGaA
- 12.2. Market Entropy
- 12.2.1 Company's Key Areas Served
- 12.2.2 Recent Developments
- 12.3. Company Market Share Analysis 2025
- 12.3.1 Top 5 Companies Market Share Analysis
- 12.3.2 Top 3 Companies Market Share Analysis
- 12.4. List of Potential Customers
- 13. Research Methodology
List of Figures
- Figure 1: Global Oligonucleotide Therapeutics Industry Revenue Breakdown (billion, %) by Region 2025 & 2033
- Figure 2: Global Oligonucleotide Therapeutics Industry Volume Breakdown (K Unit, %) by Region 2025 & 2033
- Figure 3: North America Oligonucleotide Therapeutics Industry Revenue (billion), by Product Type 2025 & 2033
- Figure 4: North America Oligonucleotide Therapeutics Industry Volume (K Unit), by Product Type 2025 & 2033
- Figure 5: North America Oligonucleotide Therapeutics Industry Revenue Share (%), by Product Type 2025 & 2033
- Figure 6: North America Oligonucleotide Therapeutics Industry Volume Share (%), by Product Type 2025 & 2033
- Figure 7: North America Oligonucleotide Therapeutics Industry Revenue (billion), by Application 2025 & 2033
- Figure 8: North America Oligonucleotide Therapeutics Industry Volume (K Unit), by Application 2025 & 2033
- Figure 9: North America Oligonucleotide Therapeutics Industry Revenue Share (%), by Application 2025 & 2033
- Figure 10: North America Oligonucleotide Therapeutics Industry Volume Share (%), by Application 2025 & 2033
- Figure 11: North America Oligonucleotide Therapeutics Industry Revenue (billion), by End-user 2025 & 2033
- Figure 12: North America Oligonucleotide Therapeutics Industry Volume (K Unit), by End-user 2025 & 2033
- Figure 13: North America Oligonucleotide Therapeutics Industry Revenue Share (%), by End-user 2025 & 2033
- Figure 14: North America Oligonucleotide Therapeutics Industry Volume Share (%), by End-user 2025 & 2033
- Figure 15: North America Oligonucleotide Therapeutics Industry Revenue (billion), by Country 2025 & 2033
- Figure 16: North America Oligonucleotide Therapeutics Industry Volume (K Unit), by Country 2025 & 2033
- Figure 17: North America Oligonucleotide Therapeutics Industry Revenue Share (%), by Country 2025 & 2033
- Figure 18: North America Oligonucleotide Therapeutics Industry Volume Share (%), by Country 2025 & 2033
- Figure 19: Europe Oligonucleotide Therapeutics Industry Revenue (billion), by Product Type 2025 & 2033
- Figure 20: Europe Oligonucleotide Therapeutics Industry Volume (K Unit), by Product Type 2025 & 2033
- Figure 21: Europe Oligonucleotide Therapeutics Industry Revenue Share (%), by Product Type 2025 & 2033
- Figure 22: Europe Oligonucleotide Therapeutics Industry Volume Share (%), by Product Type 2025 & 2033
- Figure 23: Europe Oligonucleotide Therapeutics Industry Revenue (billion), by Application 2025 & 2033
- Figure 24: Europe Oligonucleotide Therapeutics Industry Volume (K Unit), by Application 2025 & 2033
- Figure 25: Europe Oligonucleotide Therapeutics Industry Revenue Share (%), by Application 2025 & 2033
- Figure 26: Europe Oligonucleotide Therapeutics Industry Volume Share (%), by Application 2025 & 2033
- Figure 27: Europe Oligonucleotide Therapeutics Industry Revenue (billion), by End-user 2025 & 2033
- Figure 28: Europe Oligonucleotide Therapeutics Industry Volume (K Unit), by End-user 2025 & 2033
- Figure 29: Europe Oligonucleotide Therapeutics Industry Revenue Share (%), by End-user 2025 & 2033
- Figure 30: Europe Oligonucleotide Therapeutics Industry Volume Share (%), by End-user 2025 & 2033
- Figure 31: Europe Oligonucleotide Therapeutics Industry Revenue (billion), by Country 2025 & 2033
- Figure 32: Europe Oligonucleotide Therapeutics Industry Volume (K Unit), by Country 2025 & 2033
- Figure 33: Europe Oligonucleotide Therapeutics Industry Revenue Share (%), by Country 2025 & 2033
- Figure 34: Europe Oligonucleotide Therapeutics Industry Volume Share (%), by Country 2025 & 2033
- Figure 35: Asia Pacific Oligonucleotide Therapeutics Industry Revenue (billion), by Product Type 2025 & 2033
- Figure 36: Asia Pacific Oligonucleotide Therapeutics Industry Volume (K Unit), by Product Type 2025 & 2033
- Figure 37: Asia Pacific Oligonucleotide Therapeutics Industry Revenue Share (%), by Product Type 2025 & 2033
- Figure 38: Asia Pacific Oligonucleotide Therapeutics Industry Volume Share (%), by Product Type 2025 & 2033
- Figure 39: Asia Pacific Oligonucleotide Therapeutics Industry Revenue (billion), by Application 2025 & 2033
- Figure 40: Asia Pacific Oligonucleotide Therapeutics Industry Volume (K Unit), by Application 2025 & 2033
- Figure 41: Asia Pacific Oligonucleotide Therapeutics Industry Revenue Share (%), by Application 2025 & 2033
- Figure 42: Asia Pacific Oligonucleotide Therapeutics Industry Volume Share (%), by Application 2025 & 2033
- Figure 43: Asia Pacific Oligonucleotide Therapeutics Industry Revenue (billion), by End-user 2025 & 2033
- Figure 44: Asia Pacific Oligonucleotide Therapeutics Industry Volume (K Unit), by End-user 2025 & 2033
- Figure 45: Asia Pacific Oligonucleotide Therapeutics Industry Revenue Share (%), by End-user 2025 & 2033
- Figure 46: Asia Pacific Oligonucleotide Therapeutics Industry Volume Share (%), by End-user 2025 & 2033
- Figure 47: Asia Pacific Oligonucleotide Therapeutics Industry Revenue (billion), by Country 2025 & 2033
- Figure 48: Asia Pacific Oligonucleotide Therapeutics Industry Volume (K Unit), by Country 2025 & 2033
- Figure 49: Asia Pacific Oligonucleotide Therapeutics Industry Revenue Share (%), by Country 2025 & 2033
- Figure 50: Asia Pacific Oligonucleotide Therapeutics Industry Volume Share (%), by Country 2025 & 2033
- Figure 51: Middle East and Africa Oligonucleotide Therapeutics Industry Revenue (billion), by Product Type 2025 & 2033
- Figure 52: Middle East and Africa Oligonucleotide Therapeutics Industry Volume (K Unit), by Product Type 2025 & 2033
- Figure 53: Middle East and Africa Oligonucleotide Therapeutics Industry Revenue Share (%), by Product Type 2025 & 2033
- Figure 54: Middle East and Africa Oligonucleotide Therapeutics Industry Volume Share (%), by Product Type 2025 & 2033
- Figure 55: Middle East and Africa Oligonucleotide Therapeutics Industry Revenue (billion), by Application 2025 & 2033
- Figure 56: Middle East and Africa Oligonucleotide Therapeutics Industry Volume (K Unit), by Application 2025 & 2033
- Figure 57: Middle East and Africa Oligonucleotide Therapeutics Industry Revenue Share (%), by Application 2025 & 2033
- Figure 58: Middle East and Africa Oligonucleotide Therapeutics Industry Volume Share (%), by Application 2025 & 2033
- Figure 59: Middle East and Africa Oligonucleotide Therapeutics Industry Revenue (billion), by End-user 2025 & 2033
- Figure 60: Middle East and Africa Oligonucleotide Therapeutics Industry Volume (K Unit), by End-user 2025 & 2033
- Figure 61: Middle East and Africa Oligonucleotide Therapeutics Industry Revenue Share (%), by End-user 2025 & 2033
- Figure 62: Middle East and Africa Oligonucleotide Therapeutics Industry Volume Share (%), by End-user 2025 & 2033
- Figure 63: Middle East and Africa Oligonucleotide Therapeutics Industry Revenue (billion), by Country 2025 & 2033
- Figure 64: Middle East and Africa Oligonucleotide Therapeutics Industry Volume (K Unit), by Country 2025 & 2033
- Figure 65: Middle East and Africa Oligonucleotide Therapeutics Industry Revenue Share (%), by Country 2025 & 2033
- Figure 66: Middle East and Africa Oligonucleotide Therapeutics Industry Volume Share (%), by Country 2025 & 2033
- Figure 67: South America Oligonucleotide Therapeutics Industry Revenue (billion), by Product Type 2025 & 2033
- Figure 68: South America Oligonucleotide Therapeutics Industry Volume (K Unit), by Product Type 2025 & 2033
- Figure 69: South America Oligonucleotide Therapeutics Industry Revenue Share (%), by Product Type 2025 & 2033
- Figure 70: South America Oligonucleotide Therapeutics Industry Volume Share (%), by Product Type 2025 & 2033
- Figure 71: South America Oligonucleotide Therapeutics Industry Revenue (billion), by Application 2025 & 2033
- Figure 72: South America Oligonucleotide Therapeutics Industry Volume (K Unit), by Application 2025 & 2033
- Figure 73: South America Oligonucleotide Therapeutics Industry Revenue Share (%), by Application 2025 & 2033
- Figure 74: South America Oligonucleotide Therapeutics Industry Volume Share (%), by Application 2025 & 2033
- Figure 75: South America Oligonucleotide Therapeutics Industry Revenue (billion), by End-user 2025 & 2033
- Figure 76: South America Oligonucleotide Therapeutics Industry Volume (K Unit), by End-user 2025 & 2033
- Figure 77: South America Oligonucleotide Therapeutics Industry Revenue Share (%), by End-user 2025 & 2033
- Figure 78: South America Oligonucleotide Therapeutics Industry Volume Share (%), by End-user 2025 & 2033
- Figure 79: South America Oligonucleotide Therapeutics Industry Revenue (billion), by Country 2025 & 2033
- Figure 80: South America Oligonucleotide Therapeutics Industry Volume (K Unit), by Country 2025 & 2033
- Figure 81: South America Oligonucleotide Therapeutics Industry Revenue Share (%), by Country 2025 & 2033
- Figure 82: South America Oligonucleotide Therapeutics Industry Volume Share (%), by Country 2025 & 2033
List of Tables
- Table 1: Global Oligonucleotide Therapeutics Industry Revenue billion Forecast, by Product Type 2020 & 2033
- Table 2: Global Oligonucleotide Therapeutics Industry Volume K Unit Forecast, by Product Type 2020 & 2033
- Table 3: Global Oligonucleotide Therapeutics Industry Revenue billion Forecast, by Application 2020 & 2033
- Table 4: Global Oligonucleotide Therapeutics Industry Volume K Unit Forecast, by Application 2020 & 2033
- Table 5: Global Oligonucleotide Therapeutics Industry Revenue billion Forecast, by End-user 2020 & 2033
- Table 6: Global Oligonucleotide Therapeutics Industry Volume K Unit Forecast, by End-user 2020 & 2033
- Table 7: Global Oligonucleotide Therapeutics Industry Revenue billion Forecast, by Region 2020 & 2033
- Table 8: Global Oligonucleotide Therapeutics Industry Volume K Unit Forecast, by Region 2020 & 2033
- Table 9: Global Oligonucleotide Therapeutics Industry Revenue billion Forecast, by Product Type 2020 & 2033
- Table 10: Global Oligonucleotide Therapeutics Industry Volume K Unit Forecast, by Product Type 2020 & 2033
- Table 11: Global Oligonucleotide Therapeutics Industry Revenue billion Forecast, by Application 2020 & 2033
- Table 12: Global Oligonucleotide Therapeutics Industry Volume K Unit Forecast, by Application 2020 & 2033
- Table 13: Global Oligonucleotide Therapeutics Industry Revenue billion Forecast, by End-user 2020 & 2033
- Table 14: Global Oligonucleotide Therapeutics Industry Volume K Unit Forecast, by End-user 2020 & 2033
- Table 15: Global Oligonucleotide Therapeutics Industry Revenue billion Forecast, by Country 2020 & 2033
- Table 16: Global Oligonucleotide Therapeutics Industry Volume K Unit Forecast, by Country 2020 & 2033
- Table 17: United States Oligonucleotide Therapeutics Industry Revenue (billion) Forecast, by Application 2020 & 2033
- Table 18: United States Oligonucleotide Therapeutics Industry Volume (K Unit) Forecast, by Application 2020 & 2033
- Table 19: Canada Oligonucleotide Therapeutics Industry Revenue (billion) Forecast, by Application 2020 & 2033
- Table 20: Canada Oligonucleotide Therapeutics Industry Volume (K Unit) Forecast, by Application 2020 & 2033
- Table 21: Mexico Oligonucleotide Therapeutics Industry Revenue (billion) Forecast, by Application 2020 & 2033
- Table 22: Mexico Oligonucleotide Therapeutics Industry Volume (K Unit) Forecast, by Application 2020 & 2033
- Table 23: Global Oligonucleotide Therapeutics Industry Revenue billion Forecast, by Product Type 2020 & 2033
- Table 24: Global Oligonucleotide Therapeutics Industry Volume K Unit Forecast, by Product Type 2020 & 2033
- Table 25: Global Oligonucleotide Therapeutics Industry Revenue billion Forecast, by Application 2020 & 2033
- Table 26: Global Oligonucleotide Therapeutics Industry Volume K Unit Forecast, by Application 2020 & 2033
- Table 27: Global Oligonucleotide Therapeutics Industry Revenue billion Forecast, by End-user 2020 & 2033
- Table 28: Global Oligonucleotide Therapeutics Industry Volume K Unit Forecast, by End-user 2020 & 2033
- Table 29: Global Oligonucleotide Therapeutics Industry Revenue billion Forecast, by Country 2020 & 2033
- Table 30: Global Oligonucleotide Therapeutics Industry Volume K Unit Forecast, by Country 2020 & 2033
- Table 31: Germany Oligonucleotide Therapeutics Industry Revenue (billion) Forecast, by Application 2020 & 2033
- Table 32: Germany Oligonucleotide Therapeutics Industry Volume (K Unit) Forecast, by Application 2020 & 2033
- Table 33: United Kingdom Oligonucleotide Therapeutics Industry Revenue (billion) Forecast, by Application 2020 & 2033
- Table 34: United Kingdom Oligonucleotide Therapeutics Industry Volume (K Unit) Forecast, by Application 2020 & 2033
- Table 35: France Oligonucleotide Therapeutics Industry Revenue (billion) Forecast, by Application 2020 & 2033
- Table 36: France Oligonucleotide Therapeutics Industry Volume (K Unit) Forecast, by Application 2020 & 2033
- Table 37: Italy Oligonucleotide Therapeutics Industry Revenue (billion) Forecast, by Application 2020 & 2033
- Table 38: Italy Oligonucleotide Therapeutics Industry Volume (K Unit) Forecast, by Application 2020 & 2033
- Table 39: Spain Oligonucleotide Therapeutics Industry Revenue (billion) Forecast, by Application 2020 & 2033
- Table 40: Spain Oligonucleotide Therapeutics Industry Volume (K Unit) Forecast, by Application 2020 & 2033
- Table 41: Rest of Europe Oligonucleotide Therapeutics Industry Revenue (billion) Forecast, by Application 2020 & 2033
- Table 42: Rest of Europe Oligonucleotide Therapeutics Industry Volume (K Unit) Forecast, by Application 2020 & 2033
- Table 43: Global Oligonucleotide Therapeutics Industry Revenue billion Forecast, by Product Type 2020 & 2033
- Table 44: Global Oligonucleotide Therapeutics Industry Volume K Unit Forecast, by Product Type 2020 & 2033
- Table 45: Global Oligonucleotide Therapeutics Industry Revenue billion Forecast, by Application 2020 & 2033
- Table 46: Global Oligonucleotide Therapeutics Industry Volume K Unit Forecast, by Application 2020 & 2033
- Table 47: Global Oligonucleotide Therapeutics Industry Revenue billion Forecast, by End-user 2020 & 2033
- Table 48: Global Oligonucleotide Therapeutics Industry Volume K Unit Forecast, by End-user 2020 & 2033
- Table 49: Global Oligonucleotide Therapeutics Industry Revenue billion Forecast, by Country 2020 & 2033
- Table 50: Global Oligonucleotide Therapeutics Industry Volume K Unit Forecast, by Country 2020 & 2033
- Table 51: China Oligonucleotide Therapeutics Industry Revenue (billion) Forecast, by Application 2020 & 2033
- Table 52: China Oligonucleotide Therapeutics Industry Volume (K Unit) Forecast, by Application 2020 & 2033
- Table 53: Japan Oligonucleotide Therapeutics Industry Revenue (billion) Forecast, by Application 2020 & 2033
- Table 54: Japan Oligonucleotide Therapeutics Industry Volume (K Unit) Forecast, by Application 2020 & 2033
- Table 55: India Oligonucleotide Therapeutics Industry Revenue (billion) Forecast, by Application 2020 & 2033
- Table 56: India Oligonucleotide Therapeutics Industry Volume (K Unit) Forecast, by Application 2020 & 2033
- Table 57: Australia Oligonucleotide Therapeutics Industry Revenue (billion) Forecast, by Application 2020 & 2033
- Table 58: Australia Oligonucleotide Therapeutics Industry Volume (K Unit) Forecast, by Application 2020 & 2033
- Table 59: South Korea Oligonucleotide Therapeutics Industry Revenue (billion) Forecast, by Application 2020 & 2033
- Table 60: South Korea Oligonucleotide Therapeutics Industry Volume (K Unit) Forecast, by Application 2020 & 2033
- Table 61: Rest of Asia Pacific Oligonucleotide Therapeutics Industry Revenue (billion) Forecast, by Application 2020 & 2033
- Table 62: Rest of Asia Pacific Oligonucleotide Therapeutics Industry Volume (K Unit) Forecast, by Application 2020 & 2033
- Table 63: Global Oligonucleotide Therapeutics Industry Revenue billion Forecast, by Product Type 2020 & 2033
- Table 64: Global Oligonucleotide Therapeutics Industry Volume K Unit Forecast, by Product Type 2020 & 2033
- Table 65: Global Oligonucleotide Therapeutics Industry Revenue billion Forecast, by Application 2020 & 2033
- Table 66: Global Oligonucleotide Therapeutics Industry Volume K Unit Forecast, by Application 2020 & 2033
- Table 67: Global Oligonucleotide Therapeutics Industry Revenue billion Forecast, by End-user 2020 & 2033
- Table 68: Global Oligonucleotide Therapeutics Industry Volume K Unit Forecast, by End-user 2020 & 2033
- Table 69: Global Oligonucleotide Therapeutics Industry Revenue billion Forecast, by Country 2020 & 2033
- Table 70: Global Oligonucleotide Therapeutics Industry Volume K Unit Forecast, by Country 2020 & 2033
- Table 71: GCC Oligonucleotide Therapeutics Industry Revenue (billion) Forecast, by Application 2020 & 2033
- Table 72: GCC Oligonucleotide Therapeutics Industry Volume (K Unit) Forecast, by Application 2020 & 2033
- Table 73: South Africa Oligonucleotide Therapeutics Industry Revenue (billion) Forecast, by Application 2020 & 2033
- Table 74: South Africa Oligonucleotide Therapeutics Industry Volume (K Unit) Forecast, by Application 2020 & 2033
- Table 75: Rest of Middle East and Africa Oligonucleotide Therapeutics Industry Revenue (billion) Forecast, by Application 2020 & 2033
- Table 76: Rest of Middle East and Africa Oligonucleotide Therapeutics Industry Volume (K Unit) Forecast, by Application 2020 & 2033
- Table 77: Global Oligonucleotide Therapeutics Industry Revenue billion Forecast, by Product Type 2020 & 2033
- Table 78: Global Oligonucleotide Therapeutics Industry Volume K Unit Forecast, by Product Type 2020 & 2033
- Table 79: Global Oligonucleotide Therapeutics Industry Revenue billion Forecast, by Application 2020 & 2033
- Table 80: Global Oligonucleotide Therapeutics Industry Volume K Unit Forecast, by Application 2020 & 2033
- Table 81: Global Oligonucleotide Therapeutics Industry Revenue billion Forecast, by End-user 2020 & 2033
- Table 82: Global Oligonucleotide Therapeutics Industry Volume K Unit Forecast, by End-user 2020 & 2033
- Table 83: Global Oligonucleotide Therapeutics Industry Revenue billion Forecast, by Country 2020 & 2033
- Table 84: Global Oligonucleotide Therapeutics Industry Volume K Unit Forecast, by Country 2020 & 2033
- Table 85: Brazil Oligonucleotide Therapeutics Industry Revenue (billion) Forecast, by Application 2020 & 2033
- Table 86: Brazil Oligonucleotide Therapeutics Industry Volume (K Unit) Forecast, by Application 2020 & 2033
- Table 87: Argentina Oligonucleotide Therapeutics Industry Revenue (billion) Forecast, by Application 2020 & 2033
- Table 88: Argentina Oligonucleotide Therapeutics Industry Volume (K Unit) Forecast, by Application 2020 & 2033
- Table 89: Rest of South America Oligonucleotide Therapeutics Industry Revenue (billion) Forecast, by Application 2020 & 2033
- Table 90: Rest of South America Oligonucleotide Therapeutics Industry Volume (K Unit) Forecast, by Application 2020 & 2033
Frequently Asked Questions
1. What is the projected Compound Annual Growth Rate (CAGR) of the Oligonucleotide Therapeutics Industry?
The projected CAGR is approximately 19.7%.
2. Which companies are prominent players in the Oligonucleotide Therapeutics Industry?
Key companies in the market include Merck KGaA, Maravai Life Sciences, Eurofins Scientific, Biogen, LGC Limited (LGC Biosearch Technologies), Danaher Corporation, GenScript, Sarepta Therapeutics Inc , Thermo Fisher Scientific, Bio-Synthesis Inc, Agilent Technologies, Kaneka Corporation (Eurogentec).
3. What are the main segments of the Oligonucleotide Therapeutics Industry?
The market segments include Product Type, Application, End-user.
4. Can you provide details about the market size?
The market size is estimated to be USD 7.19 billion as of 2022.
5. What are some drivers contributing to market growth?
Increasing Government Investments and R&D Expenditure in Pharmaceutical and Biotechnology Companies; The Use of Synthesized Oligonucleotides in Molecular Diagnostics and Clinical Applications.
6. What are the notable trends driving market growth?
Therapeutic Segment Expected to Register a High CAGR.
7. Are there any restraints impacting market growth?
High Treatment Cost of Oligonucleotides; Lack of Skilled Professionals and Research Support in Undeveloped Countries.
8. Can you provide examples of recent developments in the market?
July 2022: WuXi STA, a subsidiary of WuXi AppTec, launched a new large-scale oligonucleotide and peptide manufacturing facility at its Changzhou campus. This new launch enhances its capacity and capability to meet the fast-growing customer needs for oligonucleotide and peptide therapeutics development and manufacturing worldwide.
9. What pricing options are available for accessing the report?
Pricing options include single-user, multi-user, and enterprise licenses priced at USD 4750, USD 5250, and USD 8750 respectively.
10. Is the market size provided in terms of value or volume?
The market size is provided in terms of value, measured in billion and volume, measured in K Unit.
11. Are there any specific market keywords associated with the report?
Yes, the market keyword associated with the report is "Oligonucleotide Therapeutics Industry," which aids in identifying and referencing the specific market segment covered.
12. How do I determine which pricing option suits my needs best?
The pricing options vary based on user requirements and access needs. Individual users may opt for single-user licenses, while businesses requiring broader access may choose multi-user or enterprise licenses for cost-effective access to the report.
13. Are there any additional resources or data provided in the Oligonucleotide Therapeutics Industry report?
While the report offers comprehensive insights, it's advisable to review the specific contents or supplementary materials provided to ascertain if additional resources or data are available.
14. How can I stay updated on further developments or reports in the Oligonucleotide Therapeutics Industry?
To stay informed about further developments, trends, and reports in the Oligonucleotide Therapeutics Industry, consider subscribing to industry newsletters, following relevant companies and organizations, or regularly checking reputable industry news sources and publications.
Methodology
Step 1 - Identification of Relevant Samples Size from Population Database


Step 2 - Approaches for Defining Global Market Size (Value, Volume* & Price*)

Note*: In applicable scenarios
Step 3 - Data Sources
Primary Research
- Web Analytics
- Survey Reports
- Research Institute
- Latest Research Reports
- Opinion Leaders
Secondary Research
- Annual Reports
- White Paper
- Latest Press Release
- Industry Association
- Paid Database
- Investor Presentations

Step 4 - Data Triangulation
Involves using different sources of information in order to increase the validity of a study
These sources are likely to be stakeholders in a program - participants, other researchers, program staff, other community members, and so on.
Then we put all data in single framework & apply various statistical tools to find out the dynamic on the market.
During the analysis stage, feedback from the stakeholder groups would be compared to determine areas of agreement as well as areas of divergence