

Key Insights
The global Oncology Information Systems (OIS) market is experiencing substantial growth, propelled by rising cancer incidence, therapeutic advancements, and the escalating need for efficient healthcare data management. With a projected Compound Annual Growth Rate (CAGR) of 7.56%, the market is expected to reach a size of 963.88 million by 2025. Key growth drivers include the demand for streamlined workflows, enhanced patient care through data-driven insights, and the widespread adoption of Electronic Health Records (EHRs) integrated with OIS. The market is segmented by end-user (hospitals, research centers, specialty clinics), product & service (software, service), and application (medical, radiation, surgical oncology). Software solutions lead the product segment due to their robust capabilities in managing extensive datasets, optimizing treatment planning, and supporting clinical trials. North America currently dominates, driven by advanced healthcare infrastructure and significant investment, while the Asia-Pacific region is poised for considerable expansion due to increasing healthcare expenditure and cancer rates. Challenges include implementation costs, maintenance, and stringent data security requirements. Nonetheless, the market presents significant opportunities for vendors offering innovative solutions tailored to evolving oncology practices.
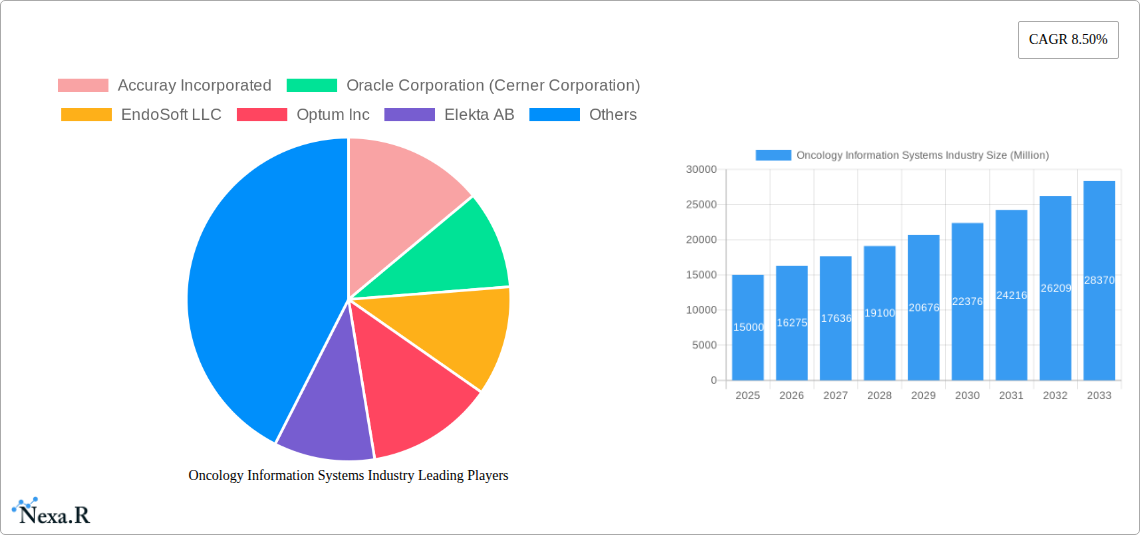
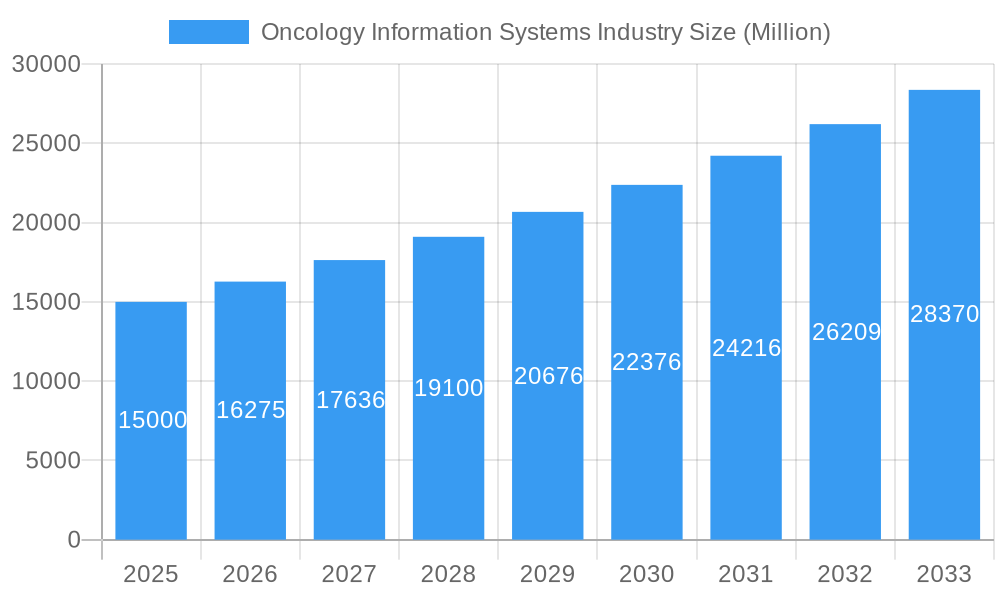
Oncology Information Systems Industry Market Size (In Million)
The competitive landscape features established leaders such as Accuray Incorporated, Oracle Corporation (Cerner Corporation), and Siemens Healthineers AG (Varian Medical Systems), alongside specialized emerging players. Strategic collaborations, mergers, and acquisitions are anticipated to shape market dynamics. Future expansion will be fueled by the adoption of cloud-based OIS, advancements in AI for oncology diagnostics and treatment, and seamless integration with other healthcare IT systems. A growing emphasis on personalized medicine and precision oncology will drive further innovation and market development. The market size for 2025 is estimated at 963.88 million, with a projected CAGR of 7.56%.
Oncology Information Systems Industry Company Market Share
Oncology Information Systems Market Report: 2019-2033
This comprehensive report provides a detailed analysis of the Oncology Information Systems market, encompassing market dynamics, growth trends, regional insights, product landscapes, and key players. The study period covers 2019-2033, with 2025 as the base year and a forecast period of 2025-2033. The report focuses on the parent market of Healthcare IT and the child market of Oncology Information Systems, offering invaluable insights for industry professionals, investors, and stakeholders. The market size is presented in million units.
Oncology Information Systems Industry Market Dynamics & Structure
The Oncology Information Systems market is characterized by a moderately concentrated landscape, with a few major players holding significant market share. Technological innovation, particularly in AI and machine learning for improved diagnostics and treatment planning, is a key driver. Regulatory frameworks, such as HIPAA in the US and GDPR in Europe, significantly influence data security and privacy practices. Competitive pressure stems from both established players and emerging companies offering specialized solutions. The end-user demographic is diverse, including hospitals, research centers, and specialty clinics, each with unique IT needs. M&A activity has been steadily increasing, with larger companies acquiring smaller firms to expand their product portfolios and geographic reach. The historical period (2019-2024) witnessed xx M&A deals, while the forecast period (2025-2033) is projected to see xx deals, representing a xx% increase.
- Market Concentration: Moderately concentrated, with top 5 players holding xx% market share in 2025.
- Technological Innovation: AI, machine learning, and cloud computing are driving efficiency and accuracy.
- Regulatory Landscape: HIPAA, GDPR, and other regulations impact data security and interoperability.
- Competitive Substitutes: Limited direct substitutes, but competition exists from general-purpose healthcare IT solutions.
- End-User Demographics: Hospitals (xx%), Research Centers (xx%), Specialty Clinics (xx%).
- M&A Trends: Increasing consolidation, with larger players driving acquisitions.
Oncology Information Systems Industry Growth Trends & Insights
The Oncology Information Systems market has experienced significant growth over the past years, driven by factors such as rising cancer incidence, increasing adoption of electronic health records (EHRs), and the demand for improved patient care. The market size was valued at xx million units in 2024 and is projected to reach xx million units by 2033, exhibiting a CAGR of xx% during the forecast period. This growth is fueled by technological advancements, such as the integration of AI and big data analytics to improve treatment outcomes, and the growing adoption of cloud-based solutions for enhanced accessibility and scalability. Consumer behavior shifts toward personalized medicine and remote patient monitoring are also impacting market growth. Market penetration is currently at xx%, expected to reach xx% by 2033.
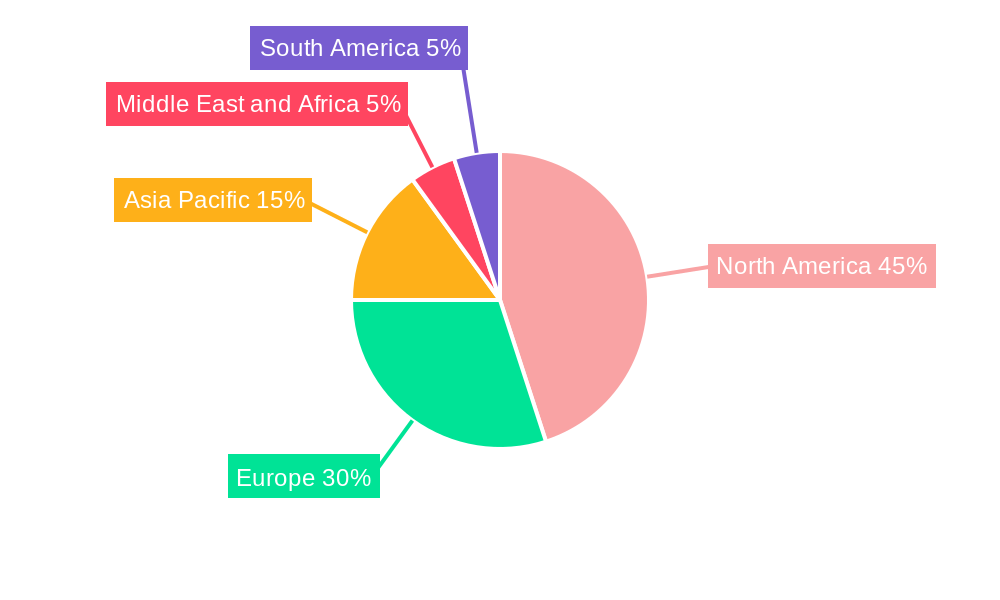
Dominant Regions, Countries, or Segments in Oncology Information Systems Industry
North America currently dominates the Oncology Information Systems market, driven by high healthcare expenditure, advanced healthcare infrastructure, and early adoption of new technologies. Within North America, the United States holds the largest market share. The Hospitals segment holds the largest market share among end-users, due to their high demand for comprehensive information systems. The Software segment dominates in terms of product and service offerings, reflecting the increasing reliance on software solutions for various aspects of oncology care. Within applications, Medical Oncology holds the largest segment share due to its broader applications compared to radiation and surgical oncology.
- Key Drivers (North America): High healthcare spending, advanced infrastructure, early adoption of technologies.
- Key Drivers (Hospitals Segment): Need for comprehensive patient data management and workflow optimization.
- Key Drivers (Software Segment): Increasing demand for sophisticated software features and functionalities.
- Key Drivers (Medical Oncology Application): Wider scope of applications compared to other oncology applications.
Oncology Information Systems Industry Product Landscape
The Oncology Information Systems market offers a diverse range of products and services, including Electronic Health Records (EHRs) specifically designed for oncology, Radiotherapy planning systems, and specialized software for managing clinical trials. These systems are increasingly integrated with advanced analytics and AI capabilities for improved treatment planning, personalized medicine, and outcome prediction. Key differentiators include user-friendly interfaces, seamless integration with other healthcare systems, and robust data security features. Innovative solutions focus on improving workflow efficiency, reducing treatment errors, and enhancing patient care.
Key Drivers, Barriers & Challenges in Oncology Information Systems Industry
Key Drivers: Rising cancer incidence rates, increasing demand for personalized medicine, and technological advancements such as AI and big data analytics are driving market growth. Government initiatives promoting the adoption of EHRs and investments in healthcare infrastructure are further accelerating market expansion.
Key Barriers and Challenges: High implementation costs, concerns regarding data security and privacy, and the need for interoperability between different systems pose challenges. Lack of skilled professionals to operate and maintain these systems can also hinder wider adoption. Furthermore, the complexity of regulatory compliance and reimbursement policies create hurdles for market penetration. These factors combined could impact the market’s growth by approximately xx% by 2030.
Emerging Opportunities in Oncology Information Systems Industry
Emerging opportunities include the integration of wearable technology for remote patient monitoring, the development of AI-powered diagnostic tools, and the expansion into underserved markets. The growing demand for personalized medicine and precision oncology creates opportunities for specialized software and services. The increasing adoption of cloud-based solutions and mobile applications offers opportunities for improved accessibility and patient engagement.
Growth Accelerators in the Oncology Information Systems Industry
Strategic partnerships between technology providers and healthcare organizations are accelerating market growth. Technological breakthroughs in AI and machine learning are improving the accuracy and efficiency of oncology information systems. Expansion into emerging markets with growing healthcare infrastructure and increasing cancer incidence rates presents significant opportunities.
Key Players Shaping the Oncology Information Systems Market
- Accuray Incorporated
- Oracle Corporation (Cerner Corporation)
- EndoSoft LLC
- Optum Inc
- Elekta AB
- Siemens Healthineers AG (Varian Medical Systems)
- RaySearch Laboratories AB
- CureMD Corporation
- F Hoffmann-La Roche Ltd (Flatiron Health Inc)
- McKesson Corporation
- BMSI Partners Inc
- MIM Software Inc
Notable Milestones in Oncology Information Systems Industry Sector
- May 2022: GE Healthcare and RaySearch Laboratories AB partnered to develop a new radiation therapy solution.
- May 2022: Berry Oncology launched the HIFI system for genetic testing and early tumor screening.
In-Depth Oncology Information Systems Industry Market Outlook
The Oncology Information Systems market is poised for continued growth, driven by technological advancements, increasing healthcare spending, and the rising prevalence of cancer. Strategic partnerships, expansion into new markets, and the development of innovative solutions will shape the future of the industry. The market presents significant opportunities for companies offering cutting-edge technologies and integrated solutions that address the evolving needs of oncology care.
Oncology Information Systems Industry Segmentation
-
1. Product and Service
- 1.1. Software
- 1.2. Application
-
2. Application
- 2.1. Medical Oncology
- 2.2. Radiation Oncology
- 2.3. Surgical Oncology
-
3. End User
- 3.1. Hospitals
- 3.2. Research Centers
- 3.3. Specialty Clinics
Oncology Information Systems Industry Segmentation By Geography
-
1. North America
- 1.1. United States
- 1.2. Canada
- 1.3. Mexico
-
2. Europe
- 2.1. Germany
- 2.2. United Kingdom
- 2.3. France
- 2.4. Italy
- 2.5. Spain
- 2.6. Rest of Europe
-
3. Asia Pacific
- 3.1. China
- 3.2. Japan
- 3.3. India
- 3.4. Australia
- 3.5. South Korea
- 3.6. Rest of Asia Pacific
-
4. Middle East and Africa
- 4.1. GCC
- 4.2. South Africa
- 4.3. Rest of Middle East and Africa
-
5. South America
- 5.1. Brazil
- 5.2. Argentina
- 5.3. Rest of South America
Oncology Information Systems Industry Regional Market Share
Geographic Coverage of Oncology Information Systems Industry
Oncology Information Systems Industry REPORT HIGHLIGHTS
| Aspects | Details |
|---|---|
| Study Period | 2020-2034 |
| Base Year | 2025 |
| Estimated Year | 2026 |
| Forecast Period | 2026-2034 |
| Historical Period | 2020-2025 |
| Growth Rate | CAGR of 7.56% from 2020-2034 |
| Segmentation |
|
Table of Contents
- 1. Introduction
- 1.1. Research Scope
- 1.2. Market Segmentation
- 1.3. Research Objective
- 1.4. Definitions and Assumptions
- 2. Executive Summary
- 2.1. Market Snapshot
- 3. Market Dynamics
- 3.1. Market Drivers
- 3.2. Market Restrains
- 3.3. Market Trends
- 3.4. Market Opportunities
- 4. Market Factor Analysis
- 4.1. Porters Five Forces
- 4.1.1. Bargaining Power of Suppliers
- 4.1.2. Bargaining Power of Buyers
- 4.1.3. Threat of New Entrants
- 4.1.4. Threat of Substitutes
- 4.1.5. Competitive Rivalry
- 4.2. PESTEL analysis
- 4.3. BCG Analysis
- 4.3.1. Stars (High Growth, High Market Share)
- 4.3.2. Cash Cows (Low Growth, High Market Share)
- 4.3.3. Question Mark (High Growth, Low Market Share)
- 4.3.4. Dogs (Low Growth, Low Market Share)
- 4.4. Ansoff Matrix Analysis
- 4.5. Supply Chain Analysis
- 4.6. Regulatory Landscape
- 4.7. Current Market Potential and Opportunity Assessment (TAM–SAM–SOM Framework)
- 4.8. NRP Analyst Note
- 4.1. Porters Five Forces
- 5. Market Analysis, Insights and Forecast 2021-2033
- 5.1. Market Analysis, Insights and Forecast - by Product and Service
- 5.1.1. Software
- 5.1.2. Application
- 5.2. Market Analysis, Insights and Forecast - by Application
- 5.2.1. Medical Oncology
- 5.2.2. Radiation Oncology
- 5.2.3. Surgical Oncology
- 5.3. Market Analysis, Insights and Forecast - by End User
- 5.3.1. Hospitals
- 5.3.2. Research Centers
- 5.3.3. Specialty Clinics
- 5.4. Market Analysis, Insights and Forecast - by Region
- 5.4.1. North America
- 5.4.2. Europe
- 5.4.3. Asia Pacific
- 5.4.4. Middle East and Africa
- 5.4.5. South America
- 5.1. Market Analysis, Insights and Forecast - by Product and Service
- 6. Global Oncology Information Systems Industry Analysis, Insights and Forecast, 2021-2033
- 6.1. Market Analysis, Insights and Forecast - by Product and Service
- 6.1.1. Software
- 6.1.2. Application
- 6.2. Market Analysis, Insights and Forecast - by Application
- 6.2.1. Medical Oncology
- 6.2.2. Radiation Oncology
- 6.2.3. Surgical Oncology
- 6.3. Market Analysis, Insights and Forecast - by End User
- 6.3.1. Hospitals
- 6.3.2. Research Centers
- 6.3.3. Specialty Clinics
- 6.1. Market Analysis, Insights and Forecast - by Product and Service
- 7. North America Oncology Information Systems Industry Analysis, Insights and Forecast, 2020-2032
- 7.1. Market Analysis, Insights and Forecast - by Product and Service
- 7.1.1. Software
- 7.1.2. Application
- 7.2. Market Analysis, Insights and Forecast - by Application
- 7.2.1. Medical Oncology
- 7.2.2. Radiation Oncology
- 7.2.3. Surgical Oncology
- 7.3. Market Analysis, Insights and Forecast - by End User
- 7.3.1. Hospitals
- 7.3.2. Research Centers
- 7.3.3. Specialty Clinics
- 7.1. Market Analysis, Insights and Forecast - by Product and Service
- 8. Europe Oncology Information Systems Industry Analysis, Insights and Forecast, 2020-2032
- 8.1. Market Analysis, Insights and Forecast - by Product and Service
- 8.1.1. Software
- 8.1.2. Application
- 8.2. Market Analysis, Insights and Forecast - by Application
- 8.2.1. Medical Oncology
- 8.2.2. Radiation Oncology
- 8.2.3. Surgical Oncology
- 8.3. Market Analysis, Insights and Forecast - by End User
- 8.3.1. Hospitals
- 8.3.2. Research Centers
- 8.3.3. Specialty Clinics
- 8.1. Market Analysis, Insights and Forecast - by Product and Service
- 9. Asia Pacific Oncology Information Systems Industry Analysis, Insights and Forecast, 2020-2032
- 9.1. Market Analysis, Insights and Forecast - by Product and Service
- 9.1.1. Software
- 9.1.2. Application
- 9.2. Market Analysis, Insights and Forecast - by Application
- 9.2.1. Medical Oncology
- 9.2.2. Radiation Oncology
- 9.2.3. Surgical Oncology
- 9.3. Market Analysis, Insights and Forecast - by End User
- 9.3.1. Hospitals
- 9.3.2. Research Centers
- 9.3.3. Specialty Clinics
- 9.1. Market Analysis, Insights and Forecast - by Product and Service
- 10. Middle East and Africa Oncology Information Systems Industry Analysis, Insights and Forecast, 2020-2032
- 10.1. Market Analysis, Insights and Forecast - by Product and Service
- 10.1.1. Software
- 10.1.2. Application
- 10.2. Market Analysis, Insights and Forecast - by Application
- 10.2.1. Medical Oncology
- 10.2.2. Radiation Oncology
- 10.2.3. Surgical Oncology
- 10.3. Market Analysis, Insights and Forecast - by End User
- 10.3.1. Hospitals
- 10.3.2. Research Centers
- 10.3.3. Specialty Clinics
- 10.1. Market Analysis, Insights and Forecast - by Product and Service
- 11. South America Oncology Information Systems Industry Analysis, Insights and Forecast, 2020-2032
- 11.1. Market Analysis, Insights and Forecast - by Product and Service
- 11.1.1. Software
- 11.1.2. Application
- 11.2. Market Analysis, Insights and Forecast - by Application
- 11.2.1. Medical Oncology
- 11.2.2. Radiation Oncology
- 11.2.3. Surgical Oncology
- 11.3. Market Analysis, Insights and Forecast - by End User
- 11.3.1. Hospitals
- 11.3.2. Research Centers
- 11.3.3. Specialty Clinics
- 11.1. Market Analysis, Insights and Forecast - by Product and Service
- 12. Competitive Analysis
- 12.1. Company Profiles
- 12.1.1 Accuray Incorporated
- 12.1.1.1. Company Overview
- 12.1.1.2. Products
- 12.1.1.3. Company Financials
- 12.1.1.4. SWOT Analysis
- 12.1.2 Oracle Corporation (Cerner Corporation)
- 12.1.2.1. Company Overview
- 12.1.2.2. Products
- 12.1.2.3. Company Financials
- 12.1.2.4. SWOT Analysis
- 12.1.3 EndoSoft LLC
- 12.1.3.1. Company Overview
- 12.1.3.2. Products
- 12.1.3.3. Company Financials
- 12.1.3.4. SWOT Analysis
- 12.1.4 Optum Inc
- 12.1.4.1. Company Overview
- 12.1.4.2. Products
- 12.1.4.3. Company Financials
- 12.1.4.4. SWOT Analysis
- 12.1.5 Elekta AB
- 12.1.5.1. Company Overview
- 12.1.5.2. Products
- 12.1.5.3. Company Financials
- 12.1.5.4. SWOT Analysis
- 12.1.6 Siemens Healthineers AG (Varian Medical Systems)
- 12.1.6.1. Company Overview
- 12.1.6.2. Products
- 12.1.6.3. Company Financials
- 12.1.6.4. SWOT Analysis
- 12.1.7 RaySearch Laboratories AB
- 12.1.7.1. Company Overview
- 12.1.7.2. Products
- 12.1.7.3. Company Financials
- 12.1.7.4. SWOT Analysis
- 12.1.8 CureMD Corporation
- 12.1.8.1. Company Overview
- 12.1.8.2. Products
- 12.1.8.3. Company Financials
- 12.1.8.4. SWOT Analysis
- 12.1.9 F Hoffmann-La Roche Ltd (Flatiron Health Inc )
- 12.1.9.1. Company Overview
- 12.1.9.2. Products
- 12.1.9.3. Company Financials
- 12.1.9.4. SWOT Analysis
- 12.1.10 McKesson Corporation
- 12.1.10.1. Company Overview
- 12.1.10.2. Products
- 12.1.10.3. Company Financials
- 12.1.10.4. SWOT Analysis
- 12.1.11 BMSI Partners Inc
- 12.1.11.1. Company Overview
- 12.1.11.2. Products
- 12.1.11.3. Company Financials
- 12.1.11.4. SWOT Analysis
- 12.1.12 MIM Software Inc
- 12.1.12.1. Company Overview
- 12.1.12.2. Products
- 12.1.12.3. Company Financials
- 12.1.12.4. SWOT Analysis
- 12.1.1 Accuray Incorporated
- 12.2. Market Entropy
- 12.2.1 Company's Key Areas Served
- 12.2.2 Recent Developments
- 12.3. Company Market Share Analysis 2025
- 12.3.1 Top 5 Companies Market Share Analysis
- 12.3.2 Top 3 Companies Market Share Analysis
- 12.4. List of Potential Customers
- 13. Research Methodology
List of Figures
- Figure 1: Global Oncology Information Systems Industry Revenue Breakdown (million, %) by Region 2025 & 2033
- Figure 2: Global Oncology Information Systems Industry Volume Breakdown (K Unit, %) by Region 2025 & 2033
- Figure 3: North America Oncology Information Systems Industry Revenue (million), by Product and Service 2025 & 2033
- Figure 4: North America Oncology Information Systems Industry Volume (K Unit), by Product and Service 2025 & 2033
- Figure 5: North America Oncology Information Systems Industry Revenue Share (%), by Product and Service 2025 & 2033
- Figure 6: North America Oncology Information Systems Industry Volume Share (%), by Product and Service 2025 & 2033
- Figure 7: North America Oncology Information Systems Industry Revenue (million), by Application 2025 & 2033
- Figure 8: North America Oncology Information Systems Industry Volume (K Unit), by Application 2025 & 2033
- Figure 9: North America Oncology Information Systems Industry Revenue Share (%), by Application 2025 & 2033
- Figure 10: North America Oncology Information Systems Industry Volume Share (%), by Application 2025 & 2033
- Figure 11: North America Oncology Information Systems Industry Revenue (million), by End User 2025 & 2033
- Figure 12: North America Oncology Information Systems Industry Volume (K Unit), by End User 2025 & 2033
- Figure 13: North America Oncology Information Systems Industry Revenue Share (%), by End User 2025 & 2033
- Figure 14: North America Oncology Information Systems Industry Volume Share (%), by End User 2025 & 2033
- Figure 15: North America Oncology Information Systems Industry Revenue (million), by Country 2025 & 2033
- Figure 16: North America Oncology Information Systems Industry Volume (K Unit), by Country 2025 & 2033
- Figure 17: North America Oncology Information Systems Industry Revenue Share (%), by Country 2025 & 2033
- Figure 18: North America Oncology Information Systems Industry Volume Share (%), by Country 2025 & 2033
- Figure 19: Europe Oncology Information Systems Industry Revenue (million), by Product and Service 2025 & 2033
- Figure 20: Europe Oncology Information Systems Industry Volume (K Unit), by Product and Service 2025 & 2033
- Figure 21: Europe Oncology Information Systems Industry Revenue Share (%), by Product and Service 2025 & 2033
- Figure 22: Europe Oncology Information Systems Industry Volume Share (%), by Product and Service 2025 & 2033
- Figure 23: Europe Oncology Information Systems Industry Revenue (million), by Application 2025 & 2033
- Figure 24: Europe Oncology Information Systems Industry Volume (K Unit), by Application 2025 & 2033
- Figure 25: Europe Oncology Information Systems Industry Revenue Share (%), by Application 2025 & 2033
- Figure 26: Europe Oncology Information Systems Industry Volume Share (%), by Application 2025 & 2033
- Figure 27: Europe Oncology Information Systems Industry Revenue (million), by End User 2025 & 2033
- Figure 28: Europe Oncology Information Systems Industry Volume (K Unit), by End User 2025 & 2033
- Figure 29: Europe Oncology Information Systems Industry Revenue Share (%), by End User 2025 & 2033
- Figure 30: Europe Oncology Information Systems Industry Volume Share (%), by End User 2025 & 2033
- Figure 31: Europe Oncology Information Systems Industry Revenue (million), by Country 2025 & 2033
- Figure 32: Europe Oncology Information Systems Industry Volume (K Unit), by Country 2025 & 2033
- Figure 33: Europe Oncology Information Systems Industry Revenue Share (%), by Country 2025 & 2033
- Figure 34: Europe Oncology Information Systems Industry Volume Share (%), by Country 2025 & 2033
- Figure 35: Asia Pacific Oncology Information Systems Industry Revenue (million), by Product and Service 2025 & 2033
- Figure 36: Asia Pacific Oncology Information Systems Industry Volume (K Unit), by Product and Service 2025 & 2033
- Figure 37: Asia Pacific Oncology Information Systems Industry Revenue Share (%), by Product and Service 2025 & 2033
- Figure 38: Asia Pacific Oncology Information Systems Industry Volume Share (%), by Product and Service 2025 & 2033
- Figure 39: Asia Pacific Oncology Information Systems Industry Revenue (million), by Application 2025 & 2033
- Figure 40: Asia Pacific Oncology Information Systems Industry Volume (K Unit), by Application 2025 & 2033
- Figure 41: Asia Pacific Oncology Information Systems Industry Revenue Share (%), by Application 2025 & 2033
- Figure 42: Asia Pacific Oncology Information Systems Industry Volume Share (%), by Application 2025 & 2033
- Figure 43: Asia Pacific Oncology Information Systems Industry Revenue (million), by End User 2025 & 2033
- Figure 44: Asia Pacific Oncology Information Systems Industry Volume (K Unit), by End User 2025 & 2033
- Figure 45: Asia Pacific Oncology Information Systems Industry Revenue Share (%), by End User 2025 & 2033
- Figure 46: Asia Pacific Oncology Information Systems Industry Volume Share (%), by End User 2025 & 2033
- Figure 47: Asia Pacific Oncology Information Systems Industry Revenue (million), by Country 2025 & 2033
- Figure 48: Asia Pacific Oncology Information Systems Industry Volume (K Unit), by Country 2025 & 2033
- Figure 49: Asia Pacific Oncology Information Systems Industry Revenue Share (%), by Country 2025 & 2033
- Figure 50: Asia Pacific Oncology Information Systems Industry Volume Share (%), by Country 2025 & 2033
- Figure 51: Middle East and Africa Oncology Information Systems Industry Revenue (million), by Product and Service 2025 & 2033
- Figure 52: Middle East and Africa Oncology Information Systems Industry Volume (K Unit), by Product and Service 2025 & 2033
- Figure 53: Middle East and Africa Oncology Information Systems Industry Revenue Share (%), by Product and Service 2025 & 2033
- Figure 54: Middle East and Africa Oncology Information Systems Industry Volume Share (%), by Product and Service 2025 & 2033
- Figure 55: Middle East and Africa Oncology Information Systems Industry Revenue (million), by Application 2025 & 2033
- Figure 56: Middle East and Africa Oncology Information Systems Industry Volume (K Unit), by Application 2025 & 2033
- Figure 57: Middle East and Africa Oncology Information Systems Industry Revenue Share (%), by Application 2025 & 2033
- Figure 58: Middle East and Africa Oncology Information Systems Industry Volume Share (%), by Application 2025 & 2033
- Figure 59: Middle East and Africa Oncology Information Systems Industry Revenue (million), by End User 2025 & 2033
- Figure 60: Middle East and Africa Oncology Information Systems Industry Volume (K Unit), by End User 2025 & 2033
- Figure 61: Middle East and Africa Oncology Information Systems Industry Revenue Share (%), by End User 2025 & 2033
- Figure 62: Middle East and Africa Oncology Information Systems Industry Volume Share (%), by End User 2025 & 2033
- Figure 63: Middle East and Africa Oncology Information Systems Industry Revenue (million), by Country 2025 & 2033
- Figure 64: Middle East and Africa Oncology Information Systems Industry Volume (K Unit), by Country 2025 & 2033
- Figure 65: Middle East and Africa Oncology Information Systems Industry Revenue Share (%), by Country 2025 & 2033
- Figure 66: Middle East and Africa Oncology Information Systems Industry Volume Share (%), by Country 2025 & 2033
- Figure 67: South America Oncology Information Systems Industry Revenue (million), by Product and Service 2025 & 2033
- Figure 68: South America Oncology Information Systems Industry Volume (K Unit), by Product and Service 2025 & 2033
- Figure 69: South America Oncology Information Systems Industry Revenue Share (%), by Product and Service 2025 & 2033
- Figure 70: South America Oncology Information Systems Industry Volume Share (%), by Product and Service 2025 & 2033
- Figure 71: South America Oncology Information Systems Industry Revenue (million), by Application 2025 & 2033
- Figure 72: South America Oncology Information Systems Industry Volume (K Unit), by Application 2025 & 2033
- Figure 73: South America Oncology Information Systems Industry Revenue Share (%), by Application 2025 & 2033
- Figure 74: South America Oncology Information Systems Industry Volume Share (%), by Application 2025 & 2033
- Figure 75: South America Oncology Information Systems Industry Revenue (million), by End User 2025 & 2033
- Figure 76: South America Oncology Information Systems Industry Volume (K Unit), by End User 2025 & 2033
- Figure 77: South America Oncology Information Systems Industry Revenue Share (%), by End User 2025 & 2033
- Figure 78: South America Oncology Information Systems Industry Volume Share (%), by End User 2025 & 2033
- Figure 79: South America Oncology Information Systems Industry Revenue (million), by Country 2025 & 2033
- Figure 80: South America Oncology Information Systems Industry Volume (K Unit), by Country 2025 & 2033
- Figure 81: South America Oncology Information Systems Industry Revenue Share (%), by Country 2025 & 2033
- Figure 82: South America Oncology Information Systems Industry Volume Share (%), by Country 2025 & 2033
List of Tables
- Table 1: Global Oncology Information Systems Industry Revenue million Forecast, by Product and Service 2020 & 2033
- Table 2: Global Oncology Information Systems Industry Volume K Unit Forecast, by Product and Service 2020 & 2033
- Table 3: Global Oncology Information Systems Industry Revenue million Forecast, by Application 2020 & 2033
- Table 4: Global Oncology Information Systems Industry Volume K Unit Forecast, by Application 2020 & 2033
- Table 5: Global Oncology Information Systems Industry Revenue million Forecast, by End User 2020 & 2033
- Table 6: Global Oncology Information Systems Industry Volume K Unit Forecast, by End User 2020 & 2033
- Table 7: Global Oncology Information Systems Industry Revenue million Forecast, by Region 2020 & 2033
- Table 8: Global Oncology Information Systems Industry Volume K Unit Forecast, by Region 2020 & 2033
- Table 9: Global Oncology Information Systems Industry Revenue million Forecast, by Product and Service 2020 & 2033
- Table 10: Global Oncology Information Systems Industry Volume K Unit Forecast, by Product and Service 2020 & 2033
- Table 11: Global Oncology Information Systems Industry Revenue million Forecast, by Application 2020 & 2033
- Table 12: Global Oncology Information Systems Industry Volume K Unit Forecast, by Application 2020 & 2033
- Table 13: Global Oncology Information Systems Industry Revenue million Forecast, by End User 2020 & 2033
- Table 14: Global Oncology Information Systems Industry Volume K Unit Forecast, by End User 2020 & 2033
- Table 15: Global Oncology Information Systems Industry Revenue million Forecast, by Country 2020 & 2033
- Table 16: Global Oncology Information Systems Industry Volume K Unit Forecast, by Country 2020 & 2033
- Table 17: United States Oncology Information Systems Industry Revenue (million) Forecast, by Application 2020 & 2033
- Table 18: United States Oncology Information Systems Industry Volume (K Unit) Forecast, by Application 2020 & 2033
- Table 19: Canada Oncology Information Systems Industry Revenue (million) Forecast, by Application 2020 & 2033
- Table 20: Canada Oncology Information Systems Industry Volume (K Unit) Forecast, by Application 2020 & 2033
- Table 21: Mexico Oncology Information Systems Industry Revenue (million) Forecast, by Application 2020 & 2033
- Table 22: Mexico Oncology Information Systems Industry Volume (K Unit) Forecast, by Application 2020 & 2033
- Table 23: Global Oncology Information Systems Industry Revenue million Forecast, by Product and Service 2020 & 2033
- Table 24: Global Oncology Information Systems Industry Volume K Unit Forecast, by Product and Service 2020 & 2033
- Table 25: Global Oncology Information Systems Industry Revenue million Forecast, by Application 2020 & 2033
- Table 26: Global Oncology Information Systems Industry Volume K Unit Forecast, by Application 2020 & 2033
- Table 27: Global Oncology Information Systems Industry Revenue million Forecast, by End User 2020 & 2033
- Table 28: Global Oncology Information Systems Industry Volume K Unit Forecast, by End User 2020 & 2033
- Table 29: Global Oncology Information Systems Industry Revenue million Forecast, by Country 2020 & 2033
- Table 30: Global Oncology Information Systems Industry Volume K Unit Forecast, by Country 2020 & 2033
- Table 31: Germany Oncology Information Systems Industry Revenue (million) Forecast, by Application 2020 & 2033
- Table 32: Germany Oncology Information Systems Industry Volume (K Unit) Forecast, by Application 2020 & 2033
- Table 33: United Kingdom Oncology Information Systems Industry Revenue (million) Forecast, by Application 2020 & 2033
- Table 34: United Kingdom Oncology Information Systems Industry Volume (K Unit) Forecast, by Application 2020 & 2033
- Table 35: France Oncology Information Systems Industry Revenue (million) Forecast, by Application 2020 & 2033
- Table 36: France Oncology Information Systems Industry Volume (K Unit) Forecast, by Application 2020 & 2033
- Table 37: Italy Oncology Information Systems Industry Revenue (million) Forecast, by Application 2020 & 2033
- Table 38: Italy Oncology Information Systems Industry Volume (K Unit) Forecast, by Application 2020 & 2033
- Table 39: Spain Oncology Information Systems Industry Revenue (million) Forecast, by Application 2020 & 2033
- Table 40: Spain Oncology Information Systems Industry Volume (K Unit) Forecast, by Application 2020 & 2033
- Table 41: Rest of Europe Oncology Information Systems Industry Revenue (million) Forecast, by Application 2020 & 2033
- Table 42: Rest of Europe Oncology Information Systems Industry Volume (K Unit) Forecast, by Application 2020 & 2033
- Table 43: Global Oncology Information Systems Industry Revenue million Forecast, by Product and Service 2020 & 2033
- Table 44: Global Oncology Information Systems Industry Volume K Unit Forecast, by Product and Service 2020 & 2033
- Table 45: Global Oncology Information Systems Industry Revenue million Forecast, by Application 2020 & 2033
- Table 46: Global Oncology Information Systems Industry Volume K Unit Forecast, by Application 2020 & 2033
- Table 47: Global Oncology Information Systems Industry Revenue million Forecast, by End User 2020 & 2033
- Table 48: Global Oncology Information Systems Industry Volume K Unit Forecast, by End User 2020 & 2033
- Table 49: Global Oncology Information Systems Industry Revenue million Forecast, by Country 2020 & 2033
- Table 50: Global Oncology Information Systems Industry Volume K Unit Forecast, by Country 2020 & 2033
- Table 51: China Oncology Information Systems Industry Revenue (million) Forecast, by Application 2020 & 2033
- Table 52: China Oncology Information Systems Industry Volume (K Unit) Forecast, by Application 2020 & 2033
- Table 53: Japan Oncology Information Systems Industry Revenue (million) Forecast, by Application 2020 & 2033
- Table 54: Japan Oncology Information Systems Industry Volume (K Unit) Forecast, by Application 2020 & 2033
- Table 55: India Oncology Information Systems Industry Revenue (million) Forecast, by Application 2020 & 2033
- Table 56: India Oncology Information Systems Industry Volume (K Unit) Forecast, by Application 2020 & 2033
- Table 57: Australia Oncology Information Systems Industry Revenue (million) Forecast, by Application 2020 & 2033
- Table 58: Australia Oncology Information Systems Industry Volume (K Unit) Forecast, by Application 2020 & 2033
- Table 59: South Korea Oncology Information Systems Industry Revenue (million) Forecast, by Application 2020 & 2033
- Table 60: South Korea Oncology Information Systems Industry Volume (K Unit) Forecast, by Application 2020 & 2033
- Table 61: Rest of Asia Pacific Oncology Information Systems Industry Revenue (million) Forecast, by Application 2020 & 2033
- Table 62: Rest of Asia Pacific Oncology Information Systems Industry Volume (K Unit) Forecast, by Application 2020 & 2033
- Table 63: Global Oncology Information Systems Industry Revenue million Forecast, by Product and Service 2020 & 2033
- Table 64: Global Oncology Information Systems Industry Volume K Unit Forecast, by Product and Service 2020 & 2033
- Table 65: Global Oncology Information Systems Industry Revenue million Forecast, by Application 2020 & 2033
- Table 66: Global Oncology Information Systems Industry Volume K Unit Forecast, by Application 2020 & 2033
- Table 67: Global Oncology Information Systems Industry Revenue million Forecast, by End User 2020 & 2033
- Table 68: Global Oncology Information Systems Industry Volume K Unit Forecast, by End User 2020 & 2033
- Table 69: Global Oncology Information Systems Industry Revenue million Forecast, by Country 2020 & 2033
- Table 70: Global Oncology Information Systems Industry Volume K Unit Forecast, by Country 2020 & 2033
- Table 71: GCC Oncology Information Systems Industry Revenue (million) Forecast, by Application 2020 & 2033
- Table 72: GCC Oncology Information Systems Industry Volume (K Unit) Forecast, by Application 2020 & 2033
- Table 73: South Africa Oncology Information Systems Industry Revenue (million) Forecast, by Application 2020 & 2033
- Table 74: South Africa Oncology Information Systems Industry Volume (K Unit) Forecast, by Application 2020 & 2033
- Table 75: Rest of Middle East and Africa Oncology Information Systems Industry Revenue (million) Forecast, by Application 2020 & 2033
- Table 76: Rest of Middle East and Africa Oncology Information Systems Industry Volume (K Unit) Forecast, by Application 2020 & 2033
- Table 77: Global Oncology Information Systems Industry Revenue million Forecast, by Product and Service 2020 & 2033
- Table 78: Global Oncology Information Systems Industry Volume K Unit Forecast, by Product and Service 2020 & 2033
- Table 79: Global Oncology Information Systems Industry Revenue million Forecast, by Application 2020 & 2033
- Table 80: Global Oncology Information Systems Industry Volume K Unit Forecast, by Application 2020 & 2033
- Table 81: Global Oncology Information Systems Industry Revenue million Forecast, by End User 2020 & 2033
- Table 82: Global Oncology Information Systems Industry Volume K Unit Forecast, by End User 2020 & 2033
- Table 83: Global Oncology Information Systems Industry Revenue million Forecast, by Country 2020 & 2033
- Table 84: Global Oncology Information Systems Industry Volume K Unit Forecast, by Country 2020 & 2033
- Table 85: Brazil Oncology Information Systems Industry Revenue (million) Forecast, by Application 2020 & 2033
- Table 86: Brazil Oncology Information Systems Industry Volume (K Unit) Forecast, by Application 2020 & 2033
- Table 87: Argentina Oncology Information Systems Industry Revenue (million) Forecast, by Application 2020 & 2033
- Table 88: Argentina Oncology Information Systems Industry Volume (K Unit) Forecast, by Application 2020 & 2033
- Table 89: Rest of South America Oncology Information Systems Industry Revenue (million) Forecast, by Application 2020 & 2033
- Table 90: Rest of South America Oncology Information Systems Industry Volume (K Unit) Forecast, by Application 2020 & 2033
Frequently Asked Questions
1. What is the projected Compound Annual Growth Rate (CAGR) of the Oncology Information Systems Industry?
The projected CAGR is approximately 7.56%.
2. Which companies are prominent players in the Oncology Information Systems Industry?
Key companies in the market include Accuray Incorporated, Oracle Corporation (Cerner Corporation), EndoSoft LLC, Optum Inc, Elekta AB, Siemens Healthineers AG (Varian Medical Systems), RaySearch Laboratories AB, CureMD Corporation, F Hoffmann-La Roche Ltd (Flatiron Health Inc ), McKesson Corporation, BMSI Partners Inc, MIM Software Inc .
3. What are the main segments of the Oncology Information Systems Industry?
The market segments include Product and Service, Application, End User.
4. Can you provide details about the market size?
The market size is estimated to be USD 963.88 million as of 2022.
5. What are some drivers contributing to market growth?
Rising incidence of Cancer Worldwide; Growing Government Initiatives for Cancer Awareness.
6. What are the notable trends driving market growth?
Software Segment is Expected to Hold the Largest Market Share in the Oncology Information System Market.
7. Are there any restraints impacting market growth?
High Cost of Cancer Therapies; Dearth of Skilled Professionals.
8. Can you provide examples of recent developments in the market?
May 2022: GE Healthcare entered into an agreement with RaySearch Laboratories AB, a radiation oncology software provider, to develop a new radiation therapy simulation and treatment planning workflow solution designed to simplify how radiation will be targeted to shrink a tumor.
9. What pricing options are available for accessing the report?
Pricing options include single-user, multi-user, and enterprise licenses priced at USD 4750, USD 5250, and USD 8750 respectively.
10. Is the market size provided in terms of value or volume?
The market size is provided in terms of value, measured in million and volume, measured in K Unit.
11. Are there any specific market keywords associated with the report?
Yes, the market keyword associated with the report is "Oncology Information Systems Industry," which aids in identifying and referencing the specific market segment covered.
12. How do I determine which pricing option suits my needs best?
The pricing options vary based on user requirements and access needs. Individual users may opt for single-user licenses, while businesses requiring broader access may choose multi-user or enterprise licenses for cost-effective access to the report.
13. Are there any additional resources or data provided in the Oncology Information Systems Industry report?
While the report offers comprehensive insights, it's advisable to review the specific contents or supplementary materials provided to ascertain if additional resources or data are available.
14. How can I stay updated on further developments or reports in the Oncology Information Systems Industry?
To stay informed about further developments, trends, and reports in the Oncology Information Systems Industry, consider subscribing to industry newsletters, following relevant companies and organizations, or regularly checking reputable industry news sources and publications.
Methodology
Step 1 - Identification of Relevant Samples Size from Population Database


Step 2 - Approaches for Defining Global Market Size (Value, Volume* & Price*)

Note*: In applicable scenarios
Step 3 - Data Sources
Primary Research
- Web Analytics
- Survey Reports
- Research Institute
- Latest Research Reports
- Opinion Leaders
Secondary Research
- Annual Reports
- White Paper
- Latest Press Release
- Industry Association
- Paid Database
- Investor Presentations

Step 4 - Data Triangulation
Involves using different sources of information in order to increase the validity of a study
These sources are likely to be stakeholders in a program - participants, other researchers, program staff, other community members, and so on.
Then we put all data in single framework & apply various statistical tools to find out the dynamic on the market.
During the analysis stage, feedback from the stakeholder groups would be compared to determine areas of agreement as well as areas of divergence