

Key Insights
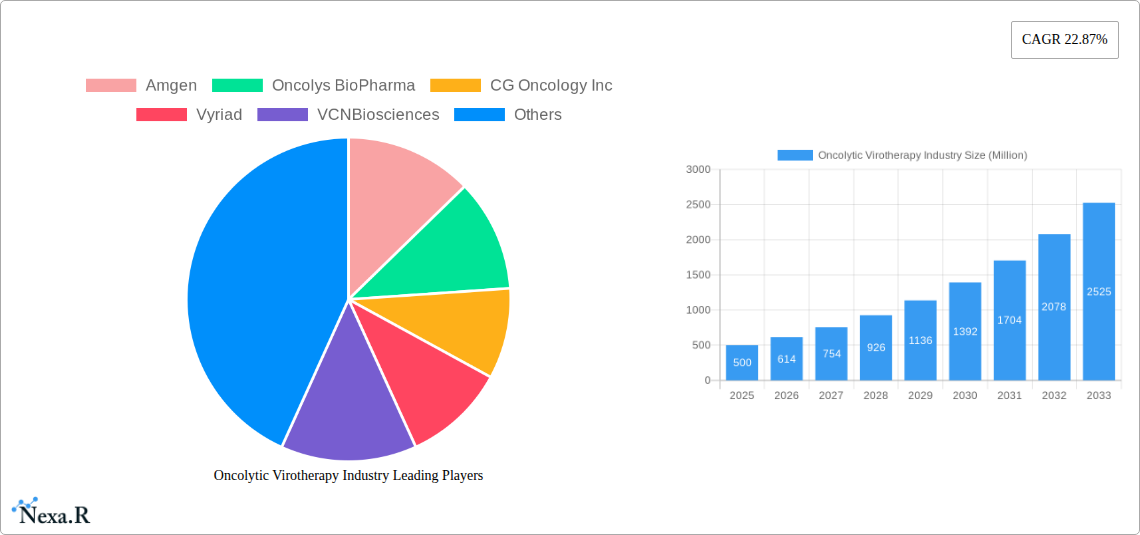
The oncolytic virotherapy market is experiencing robust growth, driven by increasing cancer prevalence, rising demand for targeted therapies, and advancements in viral vector technology. The market's Compound Annual Growth Rate (CAGR) of 22.87% from 2019 to 2024 indicates significant potential. Key drivers include the rising incidence of cancers like melanoma, prostate, breast, ovarian, and lung cancer, coupled with limitations of traditional therapies. The development of novel oncolytic viruses, such as HSV-based and adenovirus-based agents, alongside ongoing research exploring various delivery methods and combinations with other cancer treatments, fuels this expansion. While challenges such as the complexities of clinical trials, regulatory hurdles, and potential side effects exist, the market is expected to overcome these limitations due to the substantial unmet medical needs and ongoing investments in research and development.
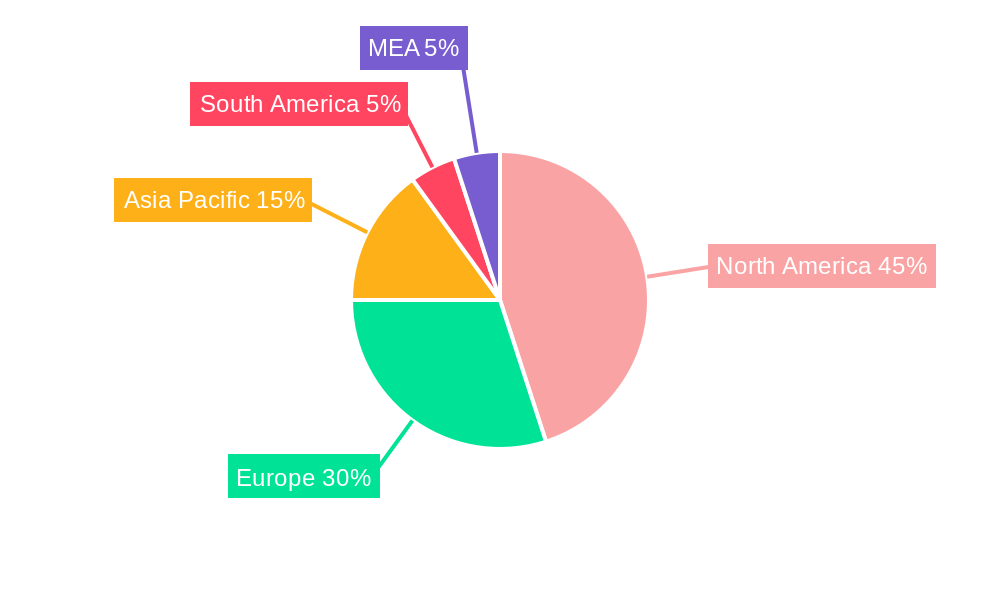
Segment-wise, HSV-based and adenovirus-based oncolytic viruses are expected to dominate the market owing to their established safety profiles and efficacy demonstrated in clinical trials. Melanoma, prostate, and breast cancer applications are currently leading the way due to high prevalence and suitability for oncolytic virotherapy, however, the application of these therapies is expanding rapidly into other cancer types. Geographically, North America and Europe currently hold the largest market share due to advanced healthcare infrastructure, robust research initiatives, and high disposable income, but the Asia-Pacific region is expected to demonstrate rapid growth in the coming years due to rising cancer incidence and increasing healthcare spending. The presence of key players like Amgen, Oncolys BioPharma, and others further contributes to the market's competitiveness and innovative advancements. Projections suggest a continuous upward trajectory for the oncolytic virotherapy market, with considerable potential for further expansion in the coming decade, propelled by ongoing clinical trials and new therapeutic approvals.
Oncolytic Virotherapy Industry: A Comprehensive Market Report (2019-2033)
This comprehensive report provides an in-depth analysis of the Oncolytic Virotherapy industry, encompassing market dynamics, growth trends, competitive landscape, and future outlook. The study period covers 2019-2033, with 2025 as the base and estimated year. The report segments the market by type (HSV-based Oncolytic Viruses, Adenoviruses-based Oncolytic Viruses, Others) and application (Melanoma, Prostate Cancer, Breast Cancer, Ovarian Cancer, Lung Cancer, Others), offering granular insights for informed decision-making. Key players such as Amgen, Oncolys BioPharma, CG Oncology Inc, Vyriad, VCN Biosciences, Transgene SA, DNAtrix, Lokon Pharma, Replimune Group Inc, TILT Biotherapeutics, Targovax, and Sorrento Therapeutics are profiled, highlighting their strategic initiatives and market positioning. The report is essential for investors, industry professionals, and researchers seeking a thorough understanding of this rapidly evolving therapeutic area. The global market is projected to reach xx Million units by 2033.
Oncolytic Virotherapy Industry Market Dynamics & Structure
The oncolytic virotherapy market is characterized by moderate concentration, with a few key players holding significant market share. Technological innovation, particularly in viral engineering and targeted delivery systems, is a primary growth driver. Regulatory approvals and evolving reimbursement policies significantly influence market access. Competitive substitutes include traditional cancer therapies like chemotherapy and immunotherapy. The end-user demographic primarily comprises oncology clinics and hospitals. Mergers and acquisitions (M&A) activity is relatively frequent, reflecting the consolidation trend within the industry.
- Market Concentration: Moderately concentrated, with the top 5 players holding approximately xx% market share in 2025.
- Technological Innovation: Focus on enhancing viral tropism, improving safety profiles, and developing combination therapies.
- Regulatory Framework: Stringent regulatory pathways influence time-to-market and development costs.
- Competitive Substitutes: Chemotherapy, immunotherapy, and targeted therapies present significant competition.
- End-User Demographics: Primarily hospitals and specialized oncology clinics.
- M&A Trends: Increased M&A activity observed in recent years, driven by the need for portfolio expansion and technological capabilities. An estimated xx M&A deals were recorded between 2019 and 2024.
Oncolytic Virotherapy Industry Growth Trends & Insights
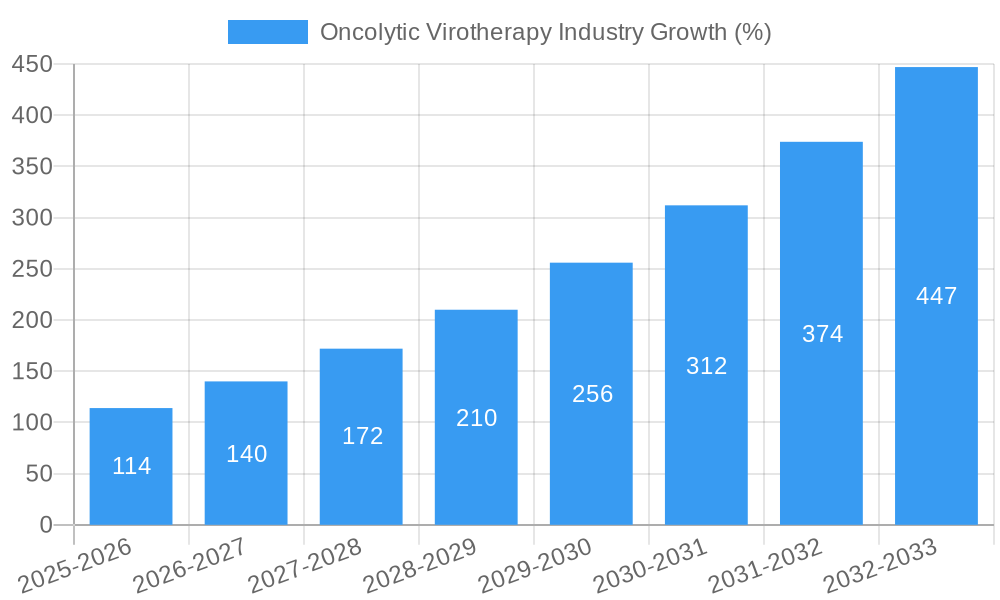
The oncolytic virotherapy market has witnessed substantial growth over the past few years, driven by an increasing understanding of the technology’s potential, coupled with advancements in viral engineering and delivery mechanisms. The market size experienced a CAGR of xx% during the historical period (2019-2024) and is projected to maintain a CAGR of xx% during the forecast period (2025-2033). This growth is fueled by rising cancer incidence, growing awareness of limitations of conventional therapies, and increasing research & development investments. Market penetration remains relatively low, but it's projected to increase significantly, driven by several factors including favorable clinical trial results and regulatory approvals. Technological disruptions, such as the development of novel oncolytic viruses and combination therapies, are further accelerating market expansion. A shift towards personalized medicine and the increasing adoption of targeted therapies are also influencing market growth. Consumer behavior is shifting towards more effective and less toxic treatment options, positioning oncolytic virotherapy favorably.
Dominant Regions, Countries, or Segments in Oncolytic Virotherapy Industry
North America currently holds the largest market share in the oncolytic virotherapy industry, driven by robust healthcare infrastructure, high cancer incidence rates, and substantial investments in research and development. Within this region, the United States is the leading country. In terms of segments, HSV-based oncolytic viruses currently dominate the market due to their established safety profiles and demonstrated efficacy in various cancer types. Melanoma is the leading application segment owing to its high responsiveness to oncolytic viruses.
- North America: High cancer prevalence, advanced healthcare infrastructure, and significant R&D investments drive market dominance.
- Europe: Growing awareness and adoption, coupled with supportive regulatory frameworks contribute to steady growth.
- Asia-Pacific: Rapidly expanding healthcare sector and rising cancer incidence rates are fueling market expansion.
- HSV-based Oncolytic Viruses: Established safety and efficacy profiles contribute to market leadership.
- Melanoma: High responsiveness to oncolytic viruses makes it the leading application segment.
Oncolytic Virotherapy Industry Product Landscape
The oncolytic virotherapy product landscape is characterized by a diverse range of viral vectors, each with its unique strengths and limitations. Significant innovations include engineered viruses with enhanced tumor targeting and improved safety profiles, as well as combination therapies incorporating oncolytic viruses with other cancer treatments. These advancements improve efficacy and reduce side effects, driving adoption. Unique selling propositions often include improved selectivity, targeted delivery, and enhanced therapeutic potency. Technological advancements focus on enhancing viral replication, improving immune response modulation, and developing effective combination therapies.
Key Drivers, Barriers & Challenges in Oncolytic Virotherapy Industry
Key Drivers:
- Increasing cancer incidence globally.
- Limitations of existing cancer therapies.
- Growing research and development investments in oncolytic virotherapy.
- Favorable clinical trial results and regulatory approvals.
Challenges:
- High development costs and lengthy regulatory pathways.
- Potential for off-target effects and toxicity.
- Limited market penetration due to a lack of widespread awareness and adoption.
- Competition from established cancer treatments. This competition reduces market share by approximately xx% annually.
Emerging Opportunities in Oncolytic Virotherapy Industry
- Expanding into new indications beyond current approved applications, such as pancreatic cancer and glioblastoma.
- Developing combination therapies that integrate oncolytic viruses with other established cancer treatments.
- Utilizing innovative delivery methods to improve targeting and reduce side effects.
- Leveraging advancements in gene editing and immunotherapy for enhanced efficacy.
Growth Accelerators in the Oncolytic Virotherapy Industry Industry
Several factors will drive future growth within the oncolytic virotherapy industry. Continued technological advancements, such as the development of more effective and targeted viruses, will be critical. Strategic partnerships and collaborations between pharmaceutical companies and research institutions can accelerate development and broaden market reach. Furthermore, market expansion into emerging economies with high cancer burdens, will significantly boost market growth. This expansion is projected to contribute to a xx% increase in market size by 2033.
Key Players Shaping the Oncolytic Virotherapy Market
- Amgen
- Oncolys BioPharma
- CG Oncology Inc
- Vyriad
- VCN Biosciences
- Transgene SA
- DNAtrix
- Lokon Pharma
- Replimune Group Inc
- TILT Biotherapeutics
- Targovax
- Sorrento Therapeutics
Notable Milestones in Oncolytic Virotherapy Industry Sector
- 2020: FDA approval of a novel oncolytic virus for melanoma treatment.
- 2022: Successful completion of Phase III clinical trials for a combination therapy incorporating an oncolytic virus.
- 2023: A significant merger between two leading oncolytic virotherapy companies.
- 2024: Launch of a new generation of oncolytic viruses with enhanced targeting capabilities.
Note: Specific details of milestones may vary and require verification from reliable sources.
In-Depth Oncolytic Virotherapy Industry Market Outlook
The oncolytic virotherapy market is poised for significant growth in the coming years, driven by ongoing technological innovations and expanded clinical applications. The future market potential is substantial, particularly in previously untapped markets. Strategic opportunities for companies include developing novel combination therapies, expanding into new therapeutic areas, and building strong intellectual property portfolios. The integration of artificial intelligence and machine learning in drug discovery and development will enhance precision medicine, unlocking even greater market potential for oncolytic virotherapy.
Oncolytic Virotherapy Industry Segmentation
-
1. Types
- 1.1. HSV-based Oncolytic Viruses
- 1.2. Adenoviruses-based Oncolytic Viruses
- 1.3. Others
-
2. Applications
- 2.1. Melanoma
- 2.2. Prostate Cancer
- 2.3. Breast Cancer
- 2.4. Ovarian Cancer
- 2.5. Lung Cancer
- 2.6. Others
Oncolytic Virotherapy Industry Segmentation By Geography
- 1. North America
- 2. Europe
- 3. Asia Pacific
- 4. Middle East and Africa
- 5. South America
Oncolytic Virotherapy Industry REPORT HIGHLIGHTS
| Aspects | Details |
|---|---|
| Study Period | 2019-2033 |
| Base Year | 2024 |
| Estimated Year | 2025 |
| Forecast Period | 2025-2033 |
| Historical Period | 2019-2024 |
| Growth Rate | CAGR of 22.87% from 2019-2033 |
| Segmentation |
|
Table of Contents
- 1. Introduction
- 1.1. Research Scope
- 1.2. Market Segmentation
- 1.3. Research Methodology
- 1.4. Definitions and Assumptions
- 2. Executive Summary
- 2.1. Introduction
- 3. Market Dynamics
- 3.1. Introduction
- 3.2. Market Drivers
- 3.2.1. Rising incidences of cancer and growing cases of Genetic diseases; Increasing investment in Research and development
- 3.3. Market Restrains
- 3.3.1. Stringent Regulatory Standards; High Cost and Risk associate with the treatment
- 3.4. Market Trends
- 3.4.1. Adenovirus-based Oncolytic Viruses Segment Dominates the Market
- 4. Market Factor Analysis
- 4.1. Porters Five Forces
- 4.2. Supply/Value Chain
- 4.3. PESTEL analysis
- 4.4. Market Entropy
- 4.5. Patent/Trademark Analysis
- 5. Global Oncolytic Virotherapy Industry Analysis, Insights and Forecast, 2019-2031
- 5.1. Market Analysis, Insights and Forecast - by Types
- 5.1.1. HSV-based Oncolytic Viruses
- 5.1.2. Adenoviruses-based Oncolytic Viruses
- 5.1.3. Others
- 5.2. Market Analysis, Insights and Forecast - by Applications
- 5.2.1. Melanoma
- 5.2.2. Prostate Cancer
- 5.2.3. Breast Cancer
- 5.2.4. Ovarian Cancer
- 5.2.5. Lung Cancer
- 5.2.6. Others
- 5.3. Market Analysis, Insights and Forecast - by Region
- 5.3.1. North America
- 5.3.2. Europe
- 5.3.3. Asia Pacific
- 5.3.4. Middle East and Africa
- 5.3.5. South America
- 5.1. Market Analysis, Insights and Forecast - by Types
- 6. North America Oncolytic Virotherapy Industry Analysis, Insights and Forecast, 2019-2031
- 6.1. Market Analysis, Insights and Forecast - by Types
- 6.1.1. HSV-based Oncolytic Viruses
- 6.1.2. Adenoviruses-based Oncolytic Viruses
- 6.1.3. Others
- 6.2. Market Analysis, Insights and Forecast - by Applications
- 6.2.1. Melanoma
- 6.2.2. Prostate Cancer
- 6.2.3. Breast Cancer
- 6.2.4. Ovarian Cancer
- 6.2.5. Lung Cancer
- 6.2.6. Others
- 6.1. Market Analysis, Insights and Forecast - by Types
- 7. Europe Oncolytic Virotherapy Industry Analysis, Insights and Forecast, 2019-2031
- 7.1. Market Analysis, Insights and Forecast - by Types
- 7.1.1. HSV-based Oncolytic Viruses
- 7.1.2. Adenoviruses-based Oncolytic Viruses
- 7.1.3. Others
- 7.2. Market Analysis, Insights and Forecast - by Applications
- 7.2.1. Melanoma
- 7.2.2. Prostate Cancer
- 7.2.3. Breast Cancer
- 7.2.4. Ovarian Cancer
- 7.2.5. Lung Cancer
- 7.2.6. Others
- 7.1. Market Analysis, Insights and Forecast - by Types
- 8. Asia Pacific Oncolytic Virotherapy Industry Analysis, Insights and Forecast, 2019-2031
- 8.1. Market Analysis, Insights and Forecast - by Types
- 8.1.1. HSV-based Oncolytic Viruses
- 8.1.2. Adenoviruses-based Oncolytic Viruses
- 8.1.3. Others
- 8.2. Market Analysis, Insights and Forecast - by Applications
- 8.2.1. Melanoma
- 8.2.2. Prostate Cancer
- 8.2.3. Breast Cancer
- 8.2.4. Ovarian Cancer
- 8.2.5. Lung Cancer
- 8.2.6. Others
- 8.1. Market Analysis, Insights and Forecast - by Types
- 9. Middle East and Africa Oncolytic Virotherapy Industry Analysis, Insights and Forecast, 2019-2031
- 9.1. Market Analysis, Insights and Forecast - by Types
- 9.1.1. HSV-based Oncolytic Viruses
- 9.1.2. Adenoviruses-based Oncolytic Viruses
- 9.1.3. Others
- 9.2. Market Analysis, Insights and Forecast - by Applications
- 9.2.1. Melanoma
- 9.2.2. Prostate Cancer
- 9.2.3. Breast Cancer
- 9.2.4. Ovarian Cancer
- 9.2.5. Lung Cancer
- 9.2.6. Others
- 9.1. Market Analysis, Insights and Forecast - by Types
- 10. South America Oncolytic Virotherapy Industry Analysis, Insights and Forecast, 2019-2031
- 10.1. Market Analysis, Insights and Forecast - by Types
- 10.1.1. HSV-based Oncolytic Viruses
- 10.1.2. Adenoviruses-based Oncolytic Viruses
- 10.1.3. Others
- 10.2. Market Analysis, Insights and Forecast - by Applications
- 10.2.1. Melanoma
- 10.2.2. Prostate Cancer
- 10.2.3. Breast Cancer
- 10.2.4. Ovarian Cancer
- 10.2.5. Lung Cancer
- 10.2.6. Others
- 10.1. Market Analysis, Insights and Forecast - by Types
- 11. North America Oncolytic Virotherapy Industry Analysis, Insights and Forecast, 2019-2031
- 11.1. Market Analysis, Insights and Forecast - By Country/Sub-region
- 11.1.1 United States
- 11.1.2 Canada
- 11.1.3 Mexico
- 12. Europe Oncolytic Virotherapy Industry Analysis, Insights and Forecast, 2019-2031
- 12.1. Market Analysis, Insights and Forecast - By Country/Sub-region
- 12.1.1 Germany
- 12.1.2 United Kingdom
- 12.1.3 France
- 12.1.4 Spain
- 12.1.5 Italy
- 12.1.6 Spain
- 12.1.7 Belgium
- 12.1.8 Netherland
- 12.1.9 Nordics
- 12.1.10 Rest of Europe
- 13. Asia Pacific Oncolytic Virotherapy Industry Analysis, Insights and Forecast, 2019-2031
- 13.1. Market Analysis, Insights and Forecast - By Country/Sub-region
- 13.1.1 China
- 13.1.2 Japan
- 13.1.3 India
- 13.1.4 South Korea
- 13.1.5 Southeast Asia
- 13.1.6 Australia
- 13.1.7 Indonesia
- 13.1.8 Phillipes
- 13.1.9 Singapore
- 13.1.10 Thailandc
- 13.1.11 Rest of Asia Pacific
- 14. South America Oncolytic Virotherapy Industry Analysis, Insights and Forecast, 2019-2031
- 14.1. Market Analysis, Insights and Forecast - By Country/Sub-region
- 14.1.1 Brazil
- 14.1.2 Argentina
- 14.1.3 Peru
- 14.1.4 Chile
- 14.1.5 Colombia
- 14.1.6 Ecuador
- 14.1.7 Venezuela
- 14.1.8 Rest of South America
- 15. North America Oncolytic Virotherapy Industry Analysis, Insights and Forecast, 2019-2031
- 15.1. Market Analysis, Insights and Forecast - By Country/Sub-region
- 15.1.1 United States
- 15.1.2 Canada
- 15.1.3 Mexico
- 16. MEA Oncolytic Virotherapy Industry Analysis, Insights and Forecast, 2019-2031
- 16.1. Market Analysis, Insights and Forecast - By Country/Sub-region
- 16.1.1 United Arab Emirates
- 16.1.2 Saudi Arabia
- 16.1.3 South Africa
- 16.1.4 Rest of Middle East and Africa
- 17. Competitive Analysis
- 17.1. Global Market Share Analysis 2024
- 17.2. Company Profiles
- 17.2.1 Amgen
- 17.2.1.1. Overview
- 17.2.1.2. Products
- 17.2.1.3. SWOT Analysis
- 17.2.1.4. Recent Developments
- 17.2.1.5. Financials (Based on Availability)
- 17.2.2 Oncolys BioPharma
- 17.2.2.1. Overview
- 17.2.2.2. Products
- 17.2.2.3. SWOT Analysis
- 17.2.2.4. Recent Developments
- 17.2.2.5. Financials (Based on Availability)
- 17.2.3 CG Oncology Inc
- 17.2.3.1. Overview
- 17.2.3.2. Products
- 17.2.3.3. SWOT Analysis
- 17.2.3.4. Recent Developments
- 17.2.3.5. Financials (Based on Availability)
- 17.2.4 Vyriad
- 17.2.4.1. Overview
- 17.2.4.2. Products
- 17.2.4.3. SWOT Analysis
- 17.2.4.4. Recent Developments
- 17.2.4.5. Financials (Based on Availability)
- 17.2.5 VCNBiosciences
- 17.2.5.1. Overview
- 17.2.5.2. Products
- 17.2.5.3. SWOT Analysis
- 17.2.5.4. Recent Developments
- 17.2.5.5. Financials (Based on Availability)
- 17.2.6 Transgene SA
- 17.2.6.1. Overview
- 17.2.6.2. Products
- 17.2.6.3. SWOT Analysis
- 17.2.6.4. Recent Developments
- 17.2.6.5. Financials (Based on Availability)
- 17.2.7 DNAtrix
- 17.2.7.1. Overview
- 17.2.7.2. Products
- 17.2.7.3. SWOT Analysis
- 17.2.7.4. Recent Developments
- 17.2.7.5. Financials (Based on Availability)
- 17.2.8 Lokon Pharma
- 17.2.8.1. Overview
- 17.2.8.2. Products
- 17.2.8.3. SWOT Analysis
- 17.2.8.4. Recent Developments
- 17.2.8.5. Financials (Based on Availability)
- 17.2.9 Replimune Group Inc
- 17.2.9.1. Overview
- 17.2.9.2. Products
- 17.2.9.3. SWOT Analysis
- 17.2.9.4. Recent Developments
- 17.2.9.5. Financials (Based on Availability)
- 17.2.10 TILT Biotherapeutics
- 17.2.10.1. Overview
- 17.2.10.2. Products
- 17.2.10.3. SWOT Analysis
- 17.2.10.4. Recent Developments
- 17.2.10.5. Financials (Based on Availability)
- 17.2.11 Targovax
- 17.2.11.1. Overview
- 17.2.11.2. Products
- 17.2.11.3. SWOT Analysis
- 17.2.11.4. Recent Developments
- 17.2.11.5. Financials (Based on Availability)
- 17.2.12 Sorrento Therapeutics
- 17.2.12.1. Overview
- 17.2.12.2. Products
- 17.2.12.3. SWOT Analysis
- 17.2.12.4. Recent Developments
- 17.2.12.5. Financials (Based on Availability)
- 17.2.1 Amgen
List of Figures
- Figure 1: Global Oncolytic Virotherapy Industry Revenue Breakdown (Million, %) by Region 2024 & 2032
- Figure 2: Global Oncolytic Virotherapy Industry Volume Breakdown (K Unit, %) by Region 2024 & 2032
- Figure 3: North America Oncolytic Virotherapy Industry Revenue (Million), by Country 2024 & 2032
- Figure 4: North America Oncolytic Virotherapy Industry Volume (K Unit), by Country 2024 & 2032
- Figure 5: North America Oncolytic Virotherapy Industry Revenue Share (%), by Country 2024 & 2032
- Figure 6: North America Oncolytic Virotherapy Industry Volume Share (%), by Country 2024 & 2032
- Figure 7: Europe Oncolytic Virotherapy Industry Revenue (Million), by Country 2024 & 2032
- Figure 8: Europe Oncolytic Virotherapy Industry Volume (K Unit), by Country 2024 & 2032
- Figure 9: Europe Oncolytic Virotherapy Industry Revenue Share (%), by Country 2024 & 2032
- Figure 10: Europe Oncolytic Virotherapy Industry Volume Share (%), by Country 2024 & 2032
- Figure 11: Asia Pacific Oncolytic Virotherapy Industry Revenue (Million), by Country 2024 & 2032
- Figure 12: Asia Pacific Oncolytic Virotherapy Industry Volume (K Unit), by Country 2024 & 2032
- Figure 13: Asia Pacific Oncolytic Virotherapy Industry Revenue Share (%), by Country 2024 & 2032
- Figure 14: Asia Pacific Oncolytic Virotherapy Industry Volume Share (%), by Country 2024 & 2032
- Figure 15: South America Oncolytic Virotherapy Industry Revenue (Million), by Country 2024 & 2032
- Figure 16: South America Oncolytic Virotherapy Industry Volume (K Unit), by Country 2024 & 2032
- Figure 17: South America Oncolytic Virotherapy Industry Revenue Share (%), by Country 2024 & 2032
- Figure 18: South America Oncolytic Virotherapy Industry Volume Share (%), by Country 2024 & 2032
- Figure 19: North America Oncolytic Virotherapy Industry Revenue (Million), by Country 2024 & 2032
- Figure 20: North America Oncolytic Virotherapy Industry Volume (K Unit), by Country 2024 & 2032
- Figure 21: North America Oncolytic Virotherapy Industry Revenue Share (%), by Country 2024 & 2032
- Figure 22: North America Oncolytic Virotherapy Industry Volume Share (%), by Country 2024 & 2032
- Figure 23: MEA Oncolytic Virotherapy Industry Revenue (Million), by Country 2024 & 2032
- Figure 24: MEA Oncolytic Virotherapy Industry Volume (K Unit), by Country 2024 & 2032
- Figure 25: MEA Oncolytic Virotherapy Industry Revenue Share (%), by Country 2024 & 2032
- Figure 26: MEA Oncolytic Virotherapy Industry Volume Share (%), by Country 2024 & 2032
- Figure 27: North America Oncolytic Virotherapy Industry Revenue (Million), by Types 2024 & 2032
- Figure 28: North America Oncolytic Virotherapy Industry Volume (K Unit), by Types 2024 & 2032
- Figure 29: North America Oncolytic Virotherapy Industry Revenue Share (%), by Types 2024 & 2032
- Figure 30: North America Oncolytic Virotherapy Industry Volume Share (%), by Types 2024 & 2032
- Figure 31: North America Oncolytic Virotherapy Industry Revenue (Million), by Applications 2024 & 2032
- Figure 32: North America Oncolytic Virotherapy Industry Volume (K Unit), by Applications 2024 & 2032
- Figure 33: North America Oncolytic Virotherapy Industry Revenue Share (%), by Applications 2024 & 2032
- Figure 34: North America Oncolytic Virotherapy Industry Volume Share (%), by Applications 2024 & 2032
- Figure 35: North America Oncolytic Virotherapy Industry Revenue (Million), by Country 2024 & 2032
- Figure 36: North America Oncolytic Virotherapy Industry Volume (K Unit), by Country 2024 & 2032
- Figure 37: North America Oncolytic Virotherapy Industry Revenue Share (%), by Country 2024 & 2032
- Figure 38: North America Oncolytic Virotherapy Industry Volume Share (%), by Country 2024 & 2032
- Figure 39: Europe Oncolytic Virotherapy Industry Revenue (Million), by Types 2024 & 2032
- Figure 40: Europe Oncolytic Virotherapy Industry Volume (K Unit), by Types 2024 & 2032
- Figure 41: Europe Oncolytic Virotherapy Industry Revenue Share (%), by Types 2024 & 2032
- Figure 42: Europe Oncolytic Virotherapy Industry Volume Share (%), by Types 2024 & 2032
- Figure 43: Europe Oncolytic Virotherapy Industry Revenue (Million), by Applications 2024 & 2032
- Figure 44: Europe Oncolytic Virotherapy Industry Volume (K Unit), by Applications 2024 & 2032
- Figure 45: Europe Oncolytic Virotherapy Industry Revenue Share (%), by Applications 2024 & 2032
- Figure 46: Europe Oncolytic Virotherapy Industry Volume Share (%), by Applications 2024 & 2032
- Figure 47: Europe Oncolytic Virotherapy Industry Revenue (Million), by Country 2024 & 2032
- Figure 48: Europe Oncolytic Virotherapy Industry Volume (K Unit), by Country 2024 & 2032
- Figure 49: Europe Oncolytic Virotherapy Industry Revenue Share (%), by Country 2024 & 2032
- Figure 50: Europe Oncolytic Virotherapy Industry Volume Share (%), by Country 2024 & 2032
- Figure 51: Asia Pacific Oncolytic Virotherapy Industry Revenue (Million), by Types 2024 & 2032
- Figure 52: Asia Pacific Oncolytic Virotherapy Industry Volume (K Unit), by Types 2024 & 2032
- Figure 53: Asia Pacific Oncolytic Virotherapy Industry Revenue Share (%), by Types 2024 & 2032
- Figure 54: Asia Pacific Oncolytic Virotherapy Industry Volume Share (%), by Types 2024 & 2032
- Figure 55: Asia Pacific Oncolytic Virotherapy Industry Revenue (Million), by Applications 2024 & 2032
- Figure 56: Asia Pacific Oncolytic Virotherapy Industry Volume (K Unit), by Applications 2024 & 2032
- Figure 57: Asia Pacific Oncolytic Virotherapy Industry Revenue Share (%), by Applications 2024 & 2032
- Figure 58: Asia Pacific Oncolytic Virotherapy Industry Volume Share (%), by Applications 2024 & 2032
- Figure 59: Asia Pacific Oncolytic Virotherapy Industry Revenue (Million), by Country 2024 & 2032
- Figure 60: Asia Pacific Oncolytic Virotherapy Industry Volume (K Unit), by Country 2024 & 2032
- Figure 61: Asia Pacific Oncolytic Virotherapy Industry Revenue Share (%), by Country 2024 & 2032
- Figure 62: Asia Pacific Oncolytic Virotherapy Industry Volume Share (%), by Country 2024 & 2032
- Figure 63: Middle East and Africa Oncolytic Virotherapy Industry Revenue (Million), by Types 2024 & 2032
- Figure 64: Middle East and Africa Oncolytic Virotherapy Industry Volume (K Unit), by Types 2024 & 2032
- Figure 65: Middle East and Africa Oncolytic Virotherapy Industry Revenue Share (%), by Types 2024 & 2032
- Figure 66: Middle East and Africa Oncolytic Virotherapy Industry Volume Share (%), by Types 2024 & 2032
- Figure 67: Middle East and Africa Oncolytic Virotherapy Industry Revenue (Million), by Applications 2024 & 2032
- Figure 68: Middle East and Africa Oncolytic Virotherapy Industry Volume (K Unit), by Applications 2024 & 2032
- Figure 69: Middle East and Africa Oncolytic Virotherapy Industry Revenue Share (%), by Applications 2024 & 2032
- Figure 70: Middle East and Africa Oncolytic Virotherapy Industry Volume Share (%), by Applications 2024 & 2032
- Figure 71: Middle East and Africa Oncolytic Virotherapy Industry Revenue (Million), by Country 2024 & 2032
- Figure 72: Middle East and Africa Oncolytic Virotherapy Industry Volume (K Unit), by Country 2024 & 2032
- Figure 73: Middle East and Africa Oncolytic Virotherapy Industry Revenue Share (%), by Country 2024 & 2032
- Figure 74: Middle East and Africa Oncolytic Virotherapy Industry Volume Share (%), by Country 2024 & 2032
- Figure 75: South America Oncolytic Virotherapy Industry Revenue (Million), by Types 2024 & 2032
- Figure 76: South America Oncolytic Virotherapy Industry Volume (K Unit), by Types 2024 & 2032
- Figure 77: South America Oncolytic Virotherapy Industry Revenue Share (%), by Types 2024 & 2032
- Figure 78: South America Oncolytic Virotherapy Industry Volume Share (%), by Types 2024 & 2032
- Figure 79: South America Oncolytic Virotherapy Industry Revenue (Million), by Applications 2024 & 2032
- Figure 80: South America Oncolytic Virotherapy Industry Volume (K Unit), by Applications 2024 & 2032
- Figure 81: South America Oncolytic Virotherapy Industry Revenue Share (%), by Applications 2024 & 2032
- Figure 82: South America Oncolytic Virotherapy Industry Volume Share (%), by Applications 2024 & 2032
- Figure 83: South America Oncolytic Virotherapy Industry Revenue (Million), by Country 2024 & 2032
- Figure 84: South America Oncolytic Virotherapy Industry Volume (K Unit), by Country 2024 & 2032
- Figure 85: South America Oncolytic Virotherapy Industry Revenue Share (%), by Country 2024 & 2032
- Figure 86: South America Oncolytic Virotherapy Industry Volume Share (%), by Country 2024 & 2032
List of Tables
- Table 1: Global Oncolytic Virotherapy Industry Revenue Million Forecast, by Region 2019 & 2032
- Table 2: Global Oncolytic Virotherapy Industry Volume K Unit Forecast, by Region 2019 & 2032
- Table 3: Global Oncolytic Virotherapy Industry Revenue Million Forecast, by Types 2019 & 2032
- Table 4: Global Oncolytic Virotherapy Industry Volume K Unit Forecast, by Types 2019 & 2032
- Table 5: Global Oncolytic Virotherapy Industry Revenue Million Forecast, by Applications 2019 & 2032
- Table 6: Global Oncolytic Virotherapy Industry Volume K Unit Forecast, by Applications 2019 & 2032
- Table 7: Global Oncolytic Virotherapy Industry Revenue Million Forecast, by Region 2019 & 2032
- Table 8: Global Oncolytic Virotherapy Industry Volume K Unit Forecast, by Region 2019 & 2032
- Table 9: Global Oncolytic Virotherapy Industry Revenue Million Forecast, by Country 2019 & 2032
- Table 10: Global Oncolytic Virotherapy Industry Volume K Unit Forecast, by Country 2019 & 2032
- Table 11: United States Oncolytic Virotherapy Industry Revenue (Million) Forecast, by Application 2019 & 2032
- Table 12: United States Oncolytic Virotherapy Industry Volume (K Unit) Forecast, by Application 2019 & 2032
- Table 13: Canada Oncolytic Virotherapy Industry Revenue (Million) Forecast, by Application 2019 & 2032
- Table 14: Canada Oncolytic Virotherapy Industry Volume (K Unit) Forecast, by Application 2019 & 2032
- Table 15: Mexico Oncolytic Virotherapy Industry Revenue (Million) Forecast, by Application 2019 & 2032
- Table 16: Mexico Oncolytic Virotherapy Industry Volume (K Unit) Forecast, by Application 2019 & 2032
- Table 17: Global Oncolytic Virotherapy Industry Revenue Million Forecast, by Country 2019 & 2032
- Table 18: Global Oncolytic Virotherapy Industry Volume K Unit Forecast, by Country 2019 & 2032
- Table 19: Germany Oncolytic Virotherapy Industry Revenue (Million) Forecast, by Application 2019 & 2032
- Table 20: Germany Oncolytic Virotherapy Industry Volume (K Unit) Forecast, by Application 2019 & 2032
- Table 21: United Kingdom Oncolytic Virotherapy Industry Revenue (Million) Forecast, by Application 2019 & 2032
- Table 22: United Kingdom Oncolytic Virotherapy Industry Volume (K Unit) Forecast, by Application 2019 & 2032
- Table 23: France Oncolytic Virotherapy Industry Revenue (Million) Forecast, by Application 2019 & 2032
- Table 24: France Oncolytic Virotherapy Industry Volume (K Unit) Forecast, by Application 2019 & 2032
- Table 25: Spain Oncolytic Virotherapy Industry Revenue (Million) Forecast, by Application 2019 & 2032
- Table 26: Spain Oncolytic Virotherapy Industry Volume (K Unit) Forecast, by Application 2019 & 2032
- Table 27: Italy Oncolytic Virotherapy Industry Revenue (Million) Forecast, by Application 2019 & 2032
- Table 28: Italy Oncolytic Virotherapy Industry Volume (K Unit) Forecast, by Application 2019 & 2032
- Table 29: Spain Oncolytic Virotherapy Industry Revenue (Million) Forecast, by Application 2019 & 2032
- Table 30: Spain Oncolytic Virotherapy Industry Volume (K Unit) Forecast, by Application 2019 & 2032
- Table 31: Belgium Oncolytic Virotherapy Industry Revenue (Million) Forecast, by Application 2019 & 2032
- Table 32: Belgium Oncolytic Virotherapy Industry Volume (K Unit) Forecast, by Application 2019 & 2032
- Table 33: Netherland Oncolytic Virotherapy Industry Revenue (Million) Forecast, by Application 2019 & 2032
- Table 34: Netherland Oncolytic Virotherapy Industry Volume (K Unit) Forecast, by Application 2019 & 2032
- Table 35: Nordics Oncolytic Virotherapy Industry Revenue (Million) Forecast, by Application 2019 & 2032
- Table 36: Nordics Oncolytic Virotherapy Industry Volume (K Unit) Forecast, by Application 2019 & 2032
- Table 37: Rest of Europe Oncolytic Virotherapy Industry Revenue (Million) Forecast, by Application 2019 & 2032
- Table 38: Rest of Europe Oncolytic Virotherapy Industry Volume (K Unit) Forecast, by Application 2019 & 2032
- Table 39: Global Oncolytic Virotherapy Industry Revenue Million Forecast, by Country 2019 & 2032
- Table 40: Global Oncolytic Virotherapy Industry Volume K Unit Forecast, by Country 2019 & 2032
- Table 41: China Oncolytic Virotherapy Industry Revenue (Million) Forecast, by Application 2019 & 2032
- Table 42: China Oncolytic Virotherapy Industry Volume (K Unit) Forecast, by Application 2019 & 2032
- Table 43: Japan Oncolytic Virotherapy Industry Revenue (Million) Forecast, by Application 2019 & 2032
- Table 44: Japan Oncolytic Virotherapy Industry Volume (K Unit) Forecast, by Application 2019 & 2032
- Table 45: India Oncolytic Virotherapy Industry Revenue (Million) Forecast, by Application 2019 & 2032
- Table 46: India Oncolytic Virotherapy Industry Volume (K Unit) Forecast, by Application 2019 & 2032
- Table 47: South Korea Oncolytic Virotherapy Industry Revenue (Million) Forecast, by Application 2019 & 2032
- Table 48: South Korea Oncolytic Virotherapy Industry Volume (K Unit) Forecast, by Application 2019 & 2032
- Table 49: Southeast Asia Oncolytic Virotherapy Industry Revenue (Million) Forecast, by Application 2019 & 2032
- Table 50: Southeast Asia Oncolytic Virotherapy Industry Volume (K Unit) Forecast, by Application 2019 & 2032
- Table 51: Australia Oncolytic Virotherapy Industry Revenue (Million) Forecast, by Application 2019 & 2032
- Table 52: Australia Oncolytic Virotherapy Industry Volume (K Unit) Forecast, by Application 2019 & 2032
- Table 53: Indonesia Oncolytic Virotherapy Industry Revenue (Million) Forecast, by Application 2019 & 2032
- Table 54: Indonesia Oncolytic Virotherapy Industry Volume (K Unit) Forecast, by Application 2019 & 2032
- Table 55: Phillipes Oncolytic Virotherapy Industry Revenue (Million) Forecast, by Application 2019 & 2032
- Table 56: Phillipes Oncolytic Virotherapy Industry Volume (K Unit) Forecast, by Application 2019 & 2032
- Table 57: Singapore Oncolytic Virotherapy Industry Revenue (Million) Forecast, by Application 2019 & 2032
- Table 58: Singapore Oncolytic Virotherapy Industry Volume (K Unit) Forecast, by Application 2019 & 2032
- Table 59: Thailandc Oncolytic Virotherapy Industry Revenue (Million) Forecast, by Application 2019 & 2032
- Table 60: Thailandc Oncolytic Virotherapy Industry Volume (K Unit) Forecast, by Application 2019 & 2032
- Table 61: Rest of Asia Pacific Oncolytic Virotherapy Industry Revenue (Million) Forecast, by Application 2019 & 2032
- Table 62: Rest of Asia Pacific Oncolytic Virotherapy Industry Volume (K Unit) Forecast, by Application 2019 & 2032
- Table 63: Global Oncolytic Virotherapy Industry Revenue Million Forecast, by Country 2019 & 2032
- Table 64: Global Oncolytic Virotherapy Industry Volume K Unit Forecast, by Country 2019 & 2032
- Table 65: Brazil Oncolytic Virotherapy Industry Revenue (Million) Forecast, by Application 2019 & 2032
- Table 66: Brazil Oncolytic Virotherapy Industry Volume (K Unit) Forecast, by Application 2019 & 2032
- Table 67: Argentina Oncolytic Virotherapy Industry Revenue (Million) Forecast, by Application 2019 & 2032
- Table 68: Argentina Oncolytic Virotherapy Industry Volume (K Unit) Forecast, by Application 2019 & 2032
- Table 69: Peru Oncolytic Virotherapy Industry Revenue (Million) Forecast, by Application 2019 & 2032
- Table 70: Peru Oncolytic Virotherapy Industry Volume (K Unit) Forecast, by Application 2019 & 2032
- Table 71: Chile Oncolytic Virotherapy Industry Revenue (Million) Forecast, by Application 2019 & 2032
- Table 72: Chile Oncolytic Virotherapy Industry Volume (K Unit) Forecast, by Application 2019 & 2032
- Table 73: Colombia Oncolytic Virotherapy Industry Revenue (Million) Forecast, by Application 2019 & 2032
- Table 74: Colombia Oncolytic Virotherapy Industry Volume (K Unit) Forecast, by Application 2019 & 2032
- Table 75: Ecuador Oncolytic Virotherapy Industry Revenue (Million) Forecast, by Application 2019 & 2032
- Table 76: Ecuador Oncolytic Virotherapy Industry Volume (K Unit) Forecast, by Application 2019 & 2032
- Table 77: Venezuela Oncolytic Virotherapy Industry Revenue (Million) Forecast, by Application 2019 & 2032
- Table 78: Venezuela Oncolytic Virotherapy Industry Volume (K Unit) Forecast, by Application 2019 & 2032
- Table 79: Rest of South America Oncolytic Virotherapy Industry Revenue (Million) Forecast, by Application 2019 & 2032
- Table 80: Rest of South America Oncolytic Virotherapy Industry Volume (K Unit) Forecast, by Application 2019 & 2032
- Table 81: Global Oncolytic Virotherapy Industry Revenue Million Forecast, by Country 2019 & 2032
- Table 82: Global Oncolytic Virotherapy Industry Volume K Unit Forecast, by Country 2019 & 2032
- Table 83: United States Oncolytic Virotherapy Industry Revenue (Million) Forecast, by Application 2019 & 2032
- Table 84: United States Oncolytic Virotherapy Industry Volume (K Unit) Forecast, by Application 2019 & 2032
- Table 85: Canada Oncolytic Virotherapy Industry Revenue (Million) Forecast, by Application 2019 & 2032
- Table 86: Canada Oncolytic Virotherapy Industry Volume (K Unit) Forecast, by Application 2019 & 2032
- Table 87: Mexico Oncolytic Virotherapy Industry Revenue (Million) Forecast, by Application 2019 & 2032
- Table 88: Mexico Oncolytic Virotherapy Industry Volume (K Unit) Forecast, by Application 2019 & 2032
- Table 89: Global Oncolytic Virotherapy Industry Revenue Million Forecast, by Country 2019 & 2032
- Table 90: Global Oncolytic Virotherapy Industry Volume K Unit Forecast, by Country 2019 & 2032
- Table 91: United Arab Emirates Oncolytic Virotherapy Industry Revenue (Million) Forecast, by Application 2019 & 2032
- Table 92: United Arab Emirates Oncolytic Virotherapy Industry Volume (K Unit) Forecast, by Application 2019 & 2032
- Table 93: Saudi Arabia Oncolytic Virotherapy Industry Revenue (Million) Forecast, by Application 2019 & 2032
- Table 94: Saudi Arabia Oncolytic Virotherapy Industry Volume (K Unit) Forecast, by Application 2019 & 2032
- Table 95: South Africa Oncolytic Virotherapy Industry Revenue (Million) Forecast, by Application 2019 & 2032
- Table 96: South Africa Oncolytic Virotherapy Industry Volume (K Unit) Forecast, by Application 2019 & 2032
- Table 97: Rest of Middle East and Africa Oncolytic Virotherapy Industry Revenue (Million) Forecast, by Application 2019 & 2032
- Table 98: Rest of Middle East and Africa Oncolytic Virotherapy Industry Volume (K Unit) Forecast, by Application 2019 & 2032
- Table 99: Global Oncolytic Virotherapy Industry Revenue Million Forecast, by Types 2019 & 2032
- Table 100: Global Oncolytic Virotherapy Industry Volume K Unit Forecast, by Types 2019 & 2032
- Table 101: Global Oncolytic Virotherapy Industry Revenue Million Forecast, by Applications 2019 & 2032
- Table 102: Global Oncolytic Virotherapy Industry Volume K Unit Forecast, by Applications 2019 & 2032
- Table 103: Global Oncolytic Virotherapy Industry Revenue Million Forecast, by Country 2019 & 2032
- Table 104: Global Oncolytic Virotherapy Industry Volume K Unit Forecast, by Country 2019 & 2032
- Table 105: Global Oncolytic Virotherapy Industry Revenue Million Forecast, by Types 2019 & 2032
- Table 106: Global Oncolytic Virotherapy Industry Volume K Unit Forecast, by Types 2019 & 2032
- Table 107: Global Oncolytic Virotherapy Industry Revenue Million Forecast, by Applications 2019 & 2032
- Table 108: Global Oncolytic Virotherapy Industry Volume K Unit Forecast, by Applications 2019 & 2032
- Table 109: Global Oncolytic Virotherapy Industry Revenue Million Forecast, by Country 2019 & 2032
- Table 110: Global Oncolytic Virotherapy Industry Volume K Unit Forecast, by Country 2019 & 2032
- Table 111: Global Oncolytic Virotherapy Industry Revenue Million Forecast, by Types 2019 & 2032
- Table 112: Global Oncolytic Virotherapy Industry Volume K Unit Forecast, by Types 2019 & 2032
- Table 113: Global Oncolytic Virotherapy Industry Revenue Million Forecast, by Applications 2019 & 2032
- Table 114: Global Oncolytic Virotherapy Industry Volume K Unit Forecast, by Applications 2019 & 2032
- Table 115: Global Oncolytic Virotherapy Industry Revenue Million Forecast, by Country 2019 & 2032
- Table 116: Global Oncolytic Virotherapy Industry Volume K Unit Forecast, by Country 2019 & 2032
- Table 117: Global Oncolytic Virotherapy Industry Revenue Million Forecast, by Types 2019 & 2032
- Table 118: Global Oncolytic Virotherapy Industry Volume K Unit Forecast, by Types 2019 & 2032
- Table 119: Global Oncolytic Virotherapy Industry Revenue Million Forecast, by Applications 2019 & 2032
- Table 120: Global Oncolytic Virotherapy Industry Volume K Unit Forecast, by Applications 2019 & 2032
- Table 121: Global Oncolytic Virotherapy Industry Revenue Million Forecast, by Country 2019 & 2032
- Table 122: Global Oncolytic Virotherapy Industry Volume K Unit Forecast, by Country 2019 & 2032
- Table 123: Global Oncolytic Virotherapy Industry Revenue Million Forecast, by Types 2019 & 2032
- Table 124: Global Oncolytic Virotherapy Industry Volume K Unit Forecast, by Types 2019 & 2032
- Table 125: Global Oncolytic Virotherapy Industry Revenue Million Forecast, by Applications 2019 & 2032
- Table 126: Global Oncolytic Virotherapy Industry Volume K Unit Forecast, by Applications 2019 & 2032
- Table 127: Global Oncolytic Virotherapy Industry Revenue Million Forecast, by Country 2019 & 2032
- Table 128: Global Oncolytic Virotherapy Industry Volume K Unit Forecast, by Country 2019 & 2032
Frequently Asked Questions
1. What is the projected Compound Annual Growth Rate (CAGR) of the Oncolytic Virotherapy Industry?
The projected CAGR is approximately 22.87%.
2. Which companies are prominent players in the Oncolytic Virotherapy Industry?
Key companies in the market include Amgen, Oncolys BioPharma, CG Oncology Inc, Vyriad, VCNBiosciences, Transgene SA, DNAtrix, Lokon Pharma, Replimune Group Inc, TILT Biotherapeutics, Targovax, Sorrento Therapeutics.
3. What are the main segments of the Oncolytic Virotherapy Industry?
The market segments include Types, Applications.
4. Can you provide details about the market size?
The market size is estimated to be USD XX Million as of 2022.
5. What are some drivers contributing to market growth?
Rising incidences of cancer and growing cases of Genetic diseases; Increasing investment in Research and development.
6. What are the notable trends driving market growth?
Adenovirus-based Oncolytic Viruses Segment Dominates the Market.
7. Are there any restraints impacting market growth?
Stringent Regulatory Standards; High Cost and Risk associate with the treatment.
8. Can you provide examples of recent developments in the market?
N/A
9. What pricing options are available for accessing the report?
Pricing options include single-user, multi-user, and enterprise licenses priced at USD 4750, USD 5250, and USD 8750 respectively.
10. Is the market size provided in terms of value or volume?
The market size is provided in terms of value, measured in Million and volume, measured in K Unit.
11. Are there any specific market keywords associated with the report?
Yes, the market keyword associated with the report is "Oncolytic Virotherapy Industry," which aids in identifying and referencing the specific market segment covered.
12. How do I determine which pricing option suits my needs best?
The pricing options vary based on user requirements and access needs. Individual users may opt for single-user licenses, while businesses requiring broader access may choose multi-user or enterprise licenses for cost-effective access to the report.
13. Are there any additional resources or data provided in the Oncolytic Virotherapy Industry report?
While the report offers comprehensive insights, it's advisable to review the specific contents or supplementary materials provided to ascertain if additional resources or data are available.
14. How can I stay updated on further developments or reports in the Oncolytic Virotherapy Industry?
To stay informed about further developments, trends, and reports in the Oncolytic Virotherapy Industry, consider subscribing to industry newsletters, following relevant companies and organizations, or regularly checking reputable industry news sources and publications.
Methodology
Step 1 - Identification of Relevant Samples Size from Population Database


Step 2 - Approaches for Defining Global Market Size (Value, Volume* & Price*)

Note*: In applicable scenarios
Step 3 - Data Sources
Primary Research
- Web Analytics
- Survey Reports
- Research Institute
- Latest Research Reports
- Opinion Leaders
Secondary Research
- Annual Reports
- White Paper
- Latest Press Release
- Industry Association
- Paid Database
- Investor Presentations

Step 4 - Data Triangulation
Involves using different sources of information in order to increase the validity of a study
These sources are likely to be stakeholders in a program - participants, other researchers, program staff, other community members, and so on.
Then we put all data in single framework & apply various statistical tools to find out the dynamic on the market.
During the analysis stage, feedback from the stakeholder groups would be compared to determine areas of agreement as well as areas of divergence
