

Key Insights
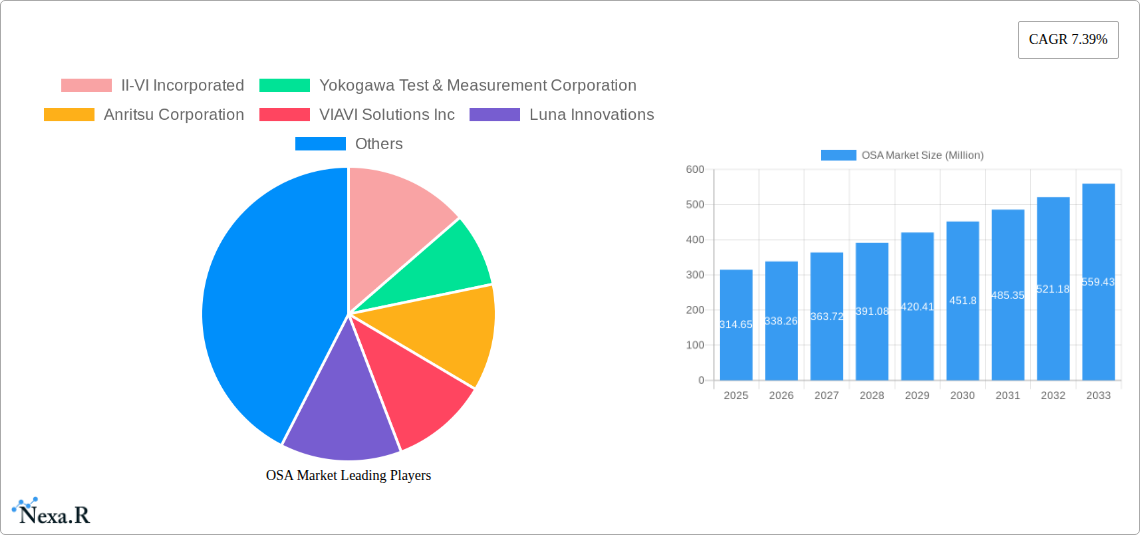
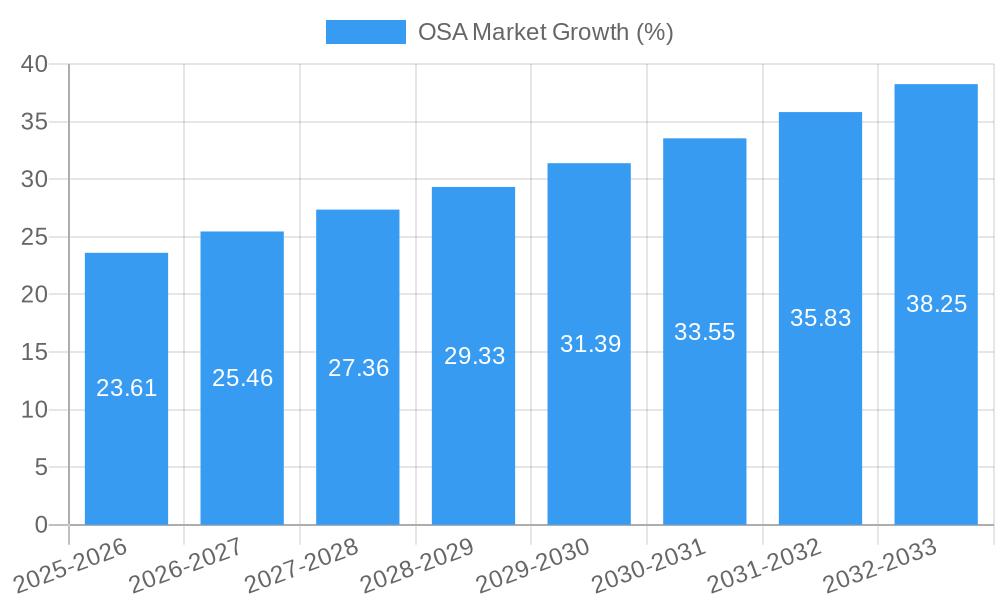
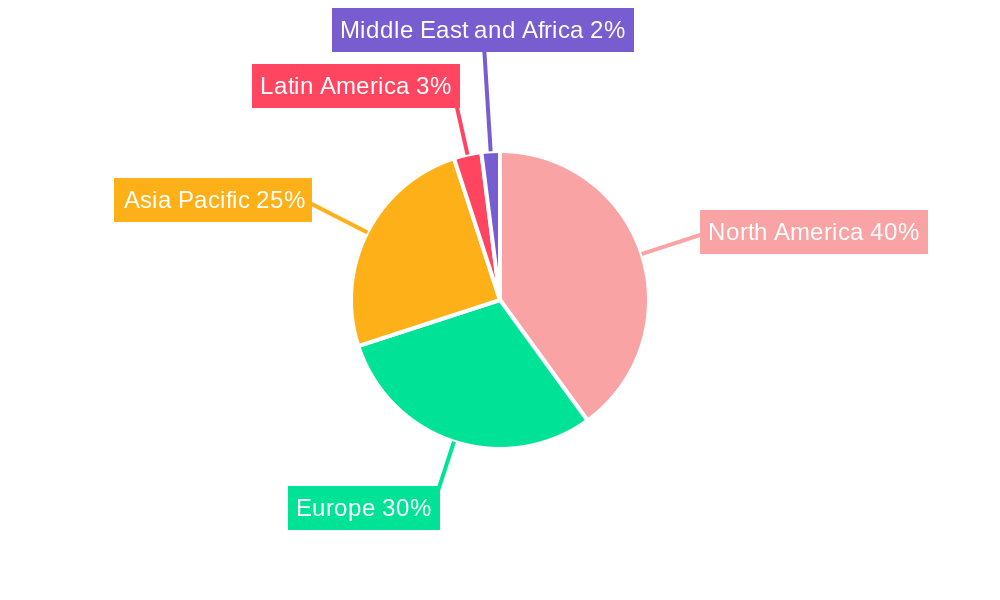
The Optical Spectrum Analyzer (OSA) market, valued at $314.65 million in 2025, is projected to experience robust growth, driven by the expanding telecommunications infrastructure, increasing demand for high-speed data transmission, and the rising adoption of optical technologies in healthcare and consumer electronics. The market's Compound Annual Growth Rate (CAGR) of 7.39% from 2025 to 2033 indicates a significant expansion, fueled by continuous advancements in optical communication networks, the development of 5G and beyond 5G networks, and the growing need for precise and efficient optical testing solutions. The portable and handheld segments are experiencing rapid growth due to their ease of use and portability, particularly beneficial for field testing and maintenance applications. Key players like II-VI Incorporated, Yokogawa Test & Measurement, and Anritsu Corporation are driving innovation through technological advancements and strategic partnerships, further propelling market growth. The North American market currently holds a significant share, driven by early adoption of advanced technologies and a robust telecom infrastructure. However, the Asia-Pacific region is expected to witness substantial growth in the coming years due to increasing investments in infrastructure development and a surge in demand for high-bandwidth services.
The restraints to market growth include high initial investment costs for advanced OSA systems and the availability of substitute technologies. Nevertheless, the ongoing need for higher precision and accuracy in optical testing across multiple industries is expected to outweigh these limitations. The segmentation of the market by end-user industry (telecommunication, healthcare, consumer electronics, and others) and by type (portable, handheld, and benchtop) offers valuable insights into specific market opportunities. Future growth will likely be driven by the increasing integration of OSA technology in various applications, including optical fiber sensing, biomedical imaging, and research & development. This will likely lead to the introduction of more sophisticated, high-performance OSAs with enhanced features and capabilities.
This comprehensive report provides an in-depth analysis of the Optical Spectrum Analyzer (OSA) market, encompassing market dynamics, growth trends, regional dominance, product landscape, key players, and future outlook. The study period covers 2019-2033, with 2025 as the base and estimated year. The report leverages extensive research to deliver actionable insights for industry professionals and strategic decision-makers. The report examines both parent and child markets for a holistic view. The OSA Market is segmented by end-user industry (Telecommunication, Healthcare, Consumer Electronics, Other End-user Industry) and by type (Portable, Handheld, Benchtop). The total market size is predicted to be xx Million units by 2033.
OSA Market Dynamics & Structure
The OSA market is characterized by moderate concentration, with several key players holding significant market share, yet also featuring numerous smaller, specialized firms. Market growth is driven primarily by technological advancements leading to higher performance and more compact devices, increased demand from the telecommunications sector (estimated at xx Million units in 2025), and the expanding healthcare industry's need for precise optical measurements. Stringent regulatory frameworks concerning emissions and accuracy impact design and manufacturing. Competitive substitutes, such as other optical testing equipment, exist but often lack OSA's comprehensive capabilities. The market has witnessed several mergers and acquisitions (M&A) in recent years, with an estimated xx M&A deals in the last five years, reflecting consolidation and expansion strategies.
- Market Concentration: Moderately concentrated, with top 5 players holding approximately xx% market share in 2025.
- Technological Innovation: Continuous advancements in miniaturization, wavelength range, and measurement accuracy are key drivers.
- Regulatory Frameworks: Compliance requirements for emission levels and measurement accuracy influence market dynamics.
- Competitive Substitutes: Alternative optical testing equipment exists, but OSAs provide a more comprehensive solution for various applications.
- End-User Demographics: Primarily driven by telecommunications, healthcare, and consumer electronics industries, with telecommunications projected to dominate at xx Million units by 2025.
- M&A Trends: Consolidation through acquisitions is observed, with an estimated xx M&A deals closed between 2020 and 2024.
OSA Market Growth Trends & Insights
The OSA market exhibited a CAGR of xx% during the historical period (2019-2024) and is projected to maintain a CAGR of xx% during the forecast period (2025-2033). Market size in 2024 was estimated at xx Million units, while the 2025 market size is projected to reach xx Million units, driven by increasing demand from 5G infrastructure deployment and growing adoption in healthcare applications. Technological disruptions, such as the development of more compact and user-friendly OSAs, are enhancing market penetration, particularly in the portable and handheld segments. A shift towards cloud-based solutions and software-defined instrumentation is also contributing to growth. The consumer electronics segment is expected to show considerable growth fueled by the increasing use of fiber optics in high-speed data transmission and advanced sensing technologies.
Dominant Regions, Countries, or Segments in OSA Market
North America currently holds the largest market share, driven by robust investments in telecommunications infrastructure and advanced research in healthcare technologies. The region’s established technological base and high adoption rates contribute significantly to its dominance. However, Asia-Pacific is projected to experience the fastest growth rate, fuelled by rapid 5G network expansion and increasing demand from emerging economies.
- By End-user Industry: Telecommunications is the dominant segment, projected to represent xx% of the market in 2025 (xx Million units), due to the critical role of OSAs in optical network monitoring and maintenance.
- By Type: The handheld segment is showing strong growth, driven by increased demand for portable and field-deployable solutions, predicted at xx Million units by 2025.
- Key Regional Drivers:
- North America: Strong government investments in R&D, advanced technological infrastructure, and high adoption rates.
- Asia-Pacific: Rapid 5G network rollouts, growing consumer electronics market, and rising investments in healthcare technology.
- Europe: Increased focus on next-generation network infrastructure, well-established telecom industry.
OSA Market Product Landscape
OSA product innovations encompass enhanced spectral resolution, wider wavelength ranges, improved accuracy, and smaller form factors. Applications include optical component testing, network monitoring, and biomedical research. Key performance metrics include wavelength accuracy, resolution, dynamic range, and measurement speed. Unique selling propositions center on ease of use, portability, and integrated software for advanced analysis. Recent advancements incorporate automated measurements, integrated optical power meters, and improved data analysis tools.
Key Drivers, Barriers & Challenges in OSA Market
Key Drivers:
- Rising demand for high-speed data transmission driving the need for advanced network monitoring and maintenance.
- Increasing adoption of OSAs in the healthcare sector for precision optical measurements in biomedical applications.
- Advancements in miniaturization and cost reduction leading to increased accessibility.
Key Challenges and Restraints:
- High initial investment costs can act as a barrier to entry for some smaller companies or users.
- Competition from alternative testing methods can hinder growth in niche sectors.
- Maintaining stringent quality control and accuracy to meet industry standards poses ongoing challenges.
Emerging Opportunities in OSA Market
Emerging opportunities reside in the expansion into untapped markets like the automotive and industrial sectors, the development of specialized OSAs for specific applications (e.g., fiber optic sensing), and increasing adoption of cloud-based OSA solutions for remote monitoring and analysis. The integration of artificial intelligence (AI) and machine learning (ML) for advanced data analysis also represents a significant growth opportunity.
Growth Accelerators in the OSA Market Industry
Long-term growth is anticipated to be fueled by technological advancements such as improved sensitivity and faster measurement speeds. Strategic partnerships between OSA manufacturers and telecommunication companies will be crucial for market expansion. Furthermore, the continuous development of new applications in emerging industries like augmented reality (AR) and virtual reality (VR) will drive demand for higher-precision OSAs.
Key Players Shaping the OSA Market Market
- II-VI Incorporated
- Yokogawa Test & Measurement Corporation
- Anritsu Corporation
- VIAVI Solutions Inc
- Luna Innovations
- Quantifi Photonics Limited
- ID Photonics GmbH
- Exfo Inc
- Aragon Photonics Brillouin
- Thorlabs Inc
- Apex Technologies
Notable Milestones in OSA Market Sector
- May 2021: EXFO introduced the 5GPro optimum spectrum analyzer (OSA), a modular, field-focused RF testing solution for 4G/LTE and 5G NR environments.
- June 2021: VIAVI Solutions Inc. introduced the MOSA module, adding optical spectrum analysis to its MAP optical manufacturing test system.
- January 2022: SAF Tehnika expanded its Spectrum Compact family of ultra-portable handheld microwave spectrum analyzers, adding a 16-26.5 GHz model.
- August 2022: Yokogawa launched two new optical spectrum analyzers, AQ6375E and AQ6376E, designed for measuring a wide range of wavelengths.
In-Depth OSA Market Market Outlook
The future of the OSA market is exceptionally promising. Continuous advancements in technology, coupled with expanding applications across various sectors, are poised to drive significant growth. Strategic partnerships, focused R&D efforts, and the development of innovative solutions will be key factors shaping the market's trajectory. The market presents compelling opportunities for both established players and emerging firms to capitalize on the growing demand for high-performance and versatile OSAs.
OSA Market Segmentation
-
1. Type
- 1.1. Portable
- 1.2. Handheld
- 1.3. Benchtop
-
2. End-user Industry
- 2.1. Telecommunication
- 2.2. Healthcare
- 2.3. Consumer Electronics
- 2.4. Other End-user Industry
OSA Market Segmentation By Geography
- 1. North America
- 2. Europe
- 3. Asia Pacific
- 4. Latin America
- 5. Middle East and Africa
OSA Market REPORT HIGHLIGHTS
| Aspects | Details |
|---|---|
| Study Period | 2019-2033 |
| Base Year | 2024 |
| Estimated Year | 2025 |
| Forecast Period | 2025-2033 |
| Historical Period | 2019-2024 |
| Growth Rate | CAGR of 7.39% from 2019-2033 |
| Segmentation |
|
Table of Contents
- 1. Introduction
- 1.1. Research Scope
- 1.2. Market Segmentation
- 1.3. Research Methodology
- 1.4. Definitions and Assumptions
- 2. Executive Summary
- 2.1. Introduction
- 3. Market Dynamics
- 3.1. Introduction
- 3.2. Market Drivers
- 3.2.1. Growth of 5G (Millimeter Wave) Technology
- 3.3. Market Restrains
- 3.3.1. Replacement of Optical Spectrum Analyzer Products with Advanced Products
- 3.4. Market Trends
- 3.4.1. Telecommunications is Expected to Hold the Largest Share
- 4. Market Factor Analysis
- 4.1. Porters Five Forces
- 4.2. Supply/Value Chain
- 4.3. PESTEL analysis
- 4.4. Market Entropy
- 4.5. Patent/Trademark Analysis
- 5. Global OSA Market Analysis, Insights and Forecast, 2019-2031
- 5.1. Market Analysis, Insights and Forecast - by Type
- 5.1.1. Portable
- 5.1.2. Handheld
- 5.1.3. Benchtop
- 5.2. Market Analysis, Insights and Forecast - by End-user Industry
- 5.2.1. Telecommunication
- 5.2.2. Healthcare
- 5.2.3. Consumer Electronics
- 5.2.4. Other End-user Industry
- 5.3. Market Analysis, Insights and Forecast - by Region
- 5.3.1. North America
- 5.3.2. Europe
- 5.3.3. Asia Pacific
- 5.3.4. Latin America
- 5.3.5. Middle East and Africa
- 5.1. Market Analysis, Insights and Forecast - by Type
- 6. North America OSA Market Analysis, Insights and Forecast, 2019-2031
- 6.1. Market Analysis, Insights and Forecast - by Type
- 6.1.1. Portable
- 6.1.2. Handheld
- 6.1.3. Benchtop
- 6.2. Market Analysis, Insights and Forecast - by End-user Industry
- 6.2.1. Telecommunication
- 6.2.2. Healthcare
- 6.2.3. Consumer Electronics
- 6.2.4. Other End-user Industry
- 6.1. Market Analysis, Insights and Forecast - by Type
- 7. Europe OSA Market Analysis, Insights and Forecast, 2019-2031
- 7.1. Market Analysis, Insights and Forecast - by Type
- 7.1.1. Portable
- 7.1.2. Handheld
- 7.1.3. Benchtop
- 7.2. Market Analysis, Insights and Forecast - by End-user Industry
- 7.2.1. Telecommunication
- 7.2.2. Healthcare
- 7.2.3. Consumer Electronics
- 7.2.4. Other End-user Industry
- 7.1. Market Analysis, Insights and Forecast - by Type
- 8. Asia Pacific OSA Market Analysis, Insights and Forecast, 2019-2031
- 8.1. Market Analysis, Insights and Forecast - by Type
- 8.1.1. Portable
- 8.1.2. Handheld
- 8.1.3. Benchtop
- 8.2. Market Analysis, Insights and Forecast - by End-user Industry
- 8.2.1. Telecommunication
- 8.2.2. Healthcare
- 8.2.3. Consumer Electronics
- 8.2.4. Other End-user Industry
- 8.1. Market Analysis, Insights and Forecast - by Type
- 9. Latin America OSA Market Analysis, Insights and Forecast, 2019-2031
- 9.1. Market Analysis, Insights and Forecast - by Type
- 9.1.1. Portable
- 9.1.2. Handheld
- 9.1.3. Benchtop
- 9.2. Market Analysis, Insights and Forecast - by End-user Industry
- 9.2.1. Telecommunication
- 9.2.2. Healthcare
- 9.2.3. Consumer Electronics
- 9.2.4. Other End-user Industry
- 9.1. Market Analysis, Insights and Forecast - by Type
- 10. Middle East and Africa OSA Market Analysis, Insights and Forecast, 2019-2031
- 10.1. Market Analysis, Insights and Forecast - by Type
- 10.1.1. Portable
- 10.1.2. Handheld
- 10.1.3. Benchtop
- 10.2. Market Analysis, Insights and Forecast - by End-user Industry
- 10.2.1. Telecommunication
- 10.2.2. Healthcare
- 10.2.3. Consumer Electronics
- 10.2.4. Other End-user Industry
- 10.1. Market Analysis, Insights and Forecast - by Type
- 11. North America OSA Market Analysis, Insights and Forecast, 2019-2031
- 11.1. Market Analysis, Insights and Forecast - By Country/Sub-region
- 11.1.1.
- 12. Europe OSA Market Analysis, Insights and Forecast, 2019-2031
- 12.1. Market Analysis, Insights and Forecast - By Country/Sub-region
- 12.1.1.
- 13. Asia Pacific OSA Market Analysis, Insights and Forecast, 2019-2031
- 13.1. Market Analysis, Insights and Forecast - By Country/Sub-region
- 13.1.1.
- 14. Latin America OSA Market Analysis, Insights and Forecast, 2019-2031
- 14.1. Market Analysis, Insights and Forecast - By Country/Sub-region
- 14.1.1.
- 15. Middle East and Africa OSA Market Analysis, Insights and Forecast, 2019-2031
- 15.1. Market Analysis, Insights and Forecast - By Country/Sub-region
- 15.1.1.
- 16. Competitive Analysis
- 16.1. Global Market Share Analysis 2024
- 16.2. Company Profiles
- 16.2.1 II-VI Incorporated
- 16.2.1.1. Overview
- 16.2.1.2. Products
- 16.2.1.3. SWOT Analysis
- 16.2.1.4. Recent Developments
- 16.2.1.5. Financials (Based on Availability)
- 16.2.2 Yokogawa Test & Measurement Corporation
- 16.2.2.1. Overview
- 16.2.2.2. Products
- 16.2.2.3. SWOT Analysis
- 16.2.2.4. Recent Developments
- 16.2.2.5. Financials (Based on Availability)
- 16.2.3 Anritsu Corporation
- 16.2.3.1. Overview
- 16.2.3.2. Products
- 16.2.3.3. SWOT Analysis
- 16.2.3.4. Recent Developments
- 16.2.3.5. Financials (Based on Availability)
- 16.2.4 VIAVI Solutions Inc
- 16.2.4.1. Overview
- 16.2.4.2. Products
- 16.2.4.3. SWOT Analysis
- 16.2.4.4. Recent Developments
- 16.2.4.5. Financials (Based on Availability)
- 16.2.5 Luna Innovations
- 16.2.5.1. Overview
- 16.2.5.2. Products
- 16.2.5.3. SWOT Analysis
- 16.2.5.4. Recent Developments
- 16.2.5.5. Financials (Based on Availability)
- 16.2.6 Quantifi Photonics Limited
- 16.2.6.1. Overview
- 16.2.6.2. Products
- 16.2.6.3. SWOT Analysis
- 16.2.6.4. Recent Developments
- 16.2.6.5. Financials (Based on Availability)
- 16.2.7 ID Photonics GmbH*List Not Exhaustive
- 16.2.7.1. Overview
- 16.2.7.2. Products
- 16.2.7.3. SWOT Analysis
- 16.2.7.4. Recent Developments
- 16.2.7.5. Financials (Based on Availability)
- 16.2.8 Exfo Inc
- 16.2.8.1. Overview
- 16.2.8.2. Products
- 16.2.8.3. SWOT Analysis
- 16.2.8.4. Recent Developments
- 16.2.8.5. Financials (Based on Availability)
- 16.2.9 Aragon Photonics Brillouin
- 16.2.9.1. Overview
- 16.2.9.2. Products
- 16.2.9.3. SWOT Analysis
- 16.2.9.4. Recent Developments
- 16.2.9.5. Financials (Based on Availability)
- 16.2.10 Thorlabs Inc
- 16.2.10.1. Overview
- 16.2.10.2. Products
- 16.2.10.3. SWOT Analysis
- 16.2.10.4. Recent Developments
- 16.2.10.5. Financials (Based on Availability)
- 16.2.11 Apex Technologies
- 16.2.11.1. Overview
- 16.2.11.2. Products
- 16.2.11.3. SWOT Analysis
- 16.2.11.4. Recent Developments
- 16.2.11.5. Financials (Based on Availability)
- 16.2.1 II-VI Incorporated
List of Figures
- Figure 1: Global OSA Market Revenue Breakdown (Million, %) by Region 2024 & 2032
- Figure 2: North America OSA Market Revenue (Million), by Country 2024 & 2032
- Figure 3: North America OSA Market Revenue Share (%), by Country 2024 & 2032
- Figure 4: Europe OSA Market Revenue (Million), by Country 2024 & 2032
- Figure 5: Europe OSA Market Revenue Share (%), by Country 2024 & 2032
- Figure 6: Asia Pacific OSA Market Revenue (Million), by Country 2024 & 2032
- Figure 7: Asia Pacific OSA Market Revenue Share (%), by Country 2024 & 2032
- Figure 8: Latin America OSA Market Revenue (Million), by Country 2024 & 2032
- Figure 9: Latin America OSA Market Revenue Share (%), by Country 2024 & 2032
- Figure 10: Middle East and Africa OSA Market Revenue (Million), by Country 2024 & 2032
- Figure 11: Middle East and Africa OSA Market Revenue Share (%), by Country 2024 & 2032
- Figure 12: North America OSA Market Revenue (Million), by Type 2024 & 2032
- Figure 13: North America OSA Market Revenue Share (%), by Type 2024 & 2032
- Figure 14: North America OSA Market Revenue (Million), by End-user Industry 2024 & 2032
- Figure 15: North America OSA Market Revenue Share (%), by End-user Industry 2024 & 2032
- Figure 16: North America OSA Market Revenue (Million), by Country 2024 & 2032
- Figure 17: North America OSA Market Revenue Share (%), by Country 2024 & 2032
- Figure 18: Europe OSA Market Revenue (Million), by Type 2024 & 2032
- Figure 19: Europe OSA Market Revenue Share (%), by Type 2024 & 2032
- Figure 20: Europe OSA Market Revenue (Million), by End-user Industry 2024 & 2032
- Figure 21: Europe OSA Market Revenue Share (%), by End-user Industry 2024 & 2032
- Figure 22: Europe OSA Market Revenue (Million), by Country 2024 & 2032
- Figure 23: Europe OSA Market Revenue Share (%), by Country 2024 & 2032
- Figure 24: Asia Pacific OSA Market Revenue (Million), by Type 2024 & 2032
- Figure 25: Asia Pacific OSA Market Revenue Share (%), by Type 2024 & 2032
- Figure 26: Asia Pacific OSA Market Revenue (Million), by End-user Industry 2024 & 2032
- Figure 27: Asia Pacific OSA Market Revenue Share (%), by End-user Industry 2024 & 2032
- Figure 28: Asia Pacific OSA Market Revenue (Million), by Country 2024 & 2032
- Figure 29: Asia Pacific OSA Market Revenue Share (%), by Country 2024 & 2032
- Figure 30: Latin America OSA Market Revenue (Million), by Type 2024 & 2032
- Figure 31: Latin America OSA Market Revenue Share (%), by Type 2024 & 2032
- Figure 32: Latin America OSA Market Revenue (Million), by End-user Industry 2024 & 2032
- Figure 33: Latin America OSA Market Revenue Share (%), by End-user Industry 2024 & 2032
- Figure 34: Latin America OSA Market Revenue (Million), by Country 2024 & 2032
- Figure 35: Latin America OSA Market Revenue Share (%), by Country 2024 & 2032
- Figure 36: Middle East and Africa OSA Market Revenue (Million), by Type 2024 & 2032
- Figure 37: Middle East and Africa OSA Market Revenue Share (%), by Type 2024 & 2032
- Figure 38: Middle East and Africa OSA Market Revenue (Million), by End-user Industry 2024 & 2032
- Figure 39: Middle East and Africa OSA Market Revenue Share (%), by End-user Industry 2024 & 2032
- Figure 40: Middle East and Africa OSA Market Revenue (Million), by Country 2024 & 2032
- Figure 41: Middle East and Africa OSA Market Revenue Share (%), by Country 2024 & 2032
List of Tables
- Table 1: Global OSA Market Revenue Million Forecast, by Region 2019 & 2032
- Table 2: Global OSA Market Revenue Million Forecast, by Type 2019 & 2032
- Table 3: Global OSA Market Revenue Million Forecast, by End-user Industry 2019 & 2032
- Table 4: Global OSA Market Revenue Million Forecast, by Region 2019 & 2032
- Table 5: Global OSA Market Revenue Million Forecast, by Country 2019 & 2032
- Table 6: OSA Market Revenue (Million) Forecast, by Application 2019 & 2032
- Table 7: Global OSA Market Revenue Million Forecast, by Country 2019 & 2032
- Table 8: OSA Market Revenue (Million) Forecast, by Application 2019 & 2032
- Table 9: Global OSA Market Revenue Million Forecast, by Country 2019 & 2032
- Table 10: OSA Market Revenue (Million) Forecast, by Application 2019 & 2032
- Table 11: Global OSA Market Revenue Million Forecast, by Country 2019 & 2032
- Table 12: OSA Market Revenue (Million) Forecast, by Application 2019 & 2032
- Table 13: Global OSA Market Revenue Million Forecast, by Country 2019 & 2032
- Table 14: OSA Market Revenue (Million) Forecast, by Application 2019 & 2032
- Table 15: Global OSA Market Revenue Million Forecast, by Type 2019 & 2032
- Table 16: Global OSA Market Revenue Million Forecast, by End-user Industry 2019 & 2032
- Table 17: Global OSA Market Revenue Million Forecast, by Country 2019 & 2032
- Table 18: Global OSA Market Revenue Million Forecast, by Type 2019 & 2032
- Table 19: Global OSA Market Revenue Million Forecast, by End-user Industry 2019 & 2032
- Table 20: Global OSA Market Revenue Million Forecast, by Country 2019 & 2032
- Table 21: Global OSA Market Revenue Million Forecast, by Type 2019 & 2032
- Table 22: Global OSA Market Revenue Million Forecast, by End-user Industry 2019 & 2032
- Table 23: Global OSA Market Revenue Million Forecast, by Country 2019 & 2032
- Table 24: Global OSA Market Revenue Million Forecast, by Type 2019 & 2032
- Table 25: Global OSA Market Revenue Million Forecast, by End-user Industry 2019 & 2032
- Table 26: Global OSA Market Revenue Million Forecast, by Country 2019 & 2032
- Table 27: Global OSA Market Revenue Million Forecast, by Type 2019 & 2032
- Table 28: Global OSA Market Revenue Million Forecast, by End-user Industry 2019 & 2032
- Table 29: Global OSA Market Revenue Million Forecast, by Country 2019 & 2032
Frequently Asked Questions
1. What is the projected Compound Annual Growth Rate (CAGR) of the OSA Market?
The projected CAGR is approximately 7.39%.
2. Which companies are prominent players in the OSA Market?
Key companies in the market include II-VI Incorporated, Yokogawa Test & Measurement Corporation, Anritsu Corporation, VIAVI Solutions Inc, Luna Innovations, Quantifi Photonics Limited, ID Photonics GmbH*List Not Exhaustive, Exfo Inc, Aragon Photonics Brillouin, Thorlabs Inc, Apex Technologies.
3. What are the main segments of the OSA Market?
The market segments include Type, End-user Industry.
4. Can you provide details about the market size?
The market size is estimated to be USD 314.65 Million as of 2022.
5. What are some drivers contributing to market growth?
Growth of 5G (Millimeter Wave) Technology.
6. What are the notable trends driving market growth?
Telecommunications is Expected to Hold the Largest Share.
7. Are there any restraints impacting market growth?
Replacement of Optical Spectrum Analyzer Products with Advanced Products.
8. Can you provide examples of recent developments in the market?
August 2022 - Yokogawa announced to launch of two new optical spectrum analyzers (OSAs), AQ6375E and AQ6376E. The launch aimed to fulfill market demands for an instrument capable of measuring a wide range of wavelengths to meet new needs in optical product manufacturing and development.
9. What pricing options are available for accessing the report?
Pricing options include single-user, multi-user, and enterprise licenses priced at USD 4750, USD 5250, and USD 8750 respectively.
10. Is the market size provided in terms of value or volume?
The market size is provided in terms of value, measured in Million.
11. Are there any specific market keywords associated with the report?
Yes, the market keyword associated with the report is "OSA Market," which aids in identifying and referencing the specific market segment covered.
12. How do I determine which pricing option suits my needs best?
The pricing options vary based on user requirements and access needs. Individual users may opt for single-user licenses, while businesses requiring broader access may choose multi-user or enterprise licenses for cost-effective access to the report.
13. Are there any additional resources or data provided in the OSA Market report?
While the report offers comprehensive insights, it's advisable to review the specific contents or supplementary materials provided to ascertain if additional resources or data are available.
14. How can I stay updated on further developments or reports in the OSA Market?
To stay informed about further developments, trends, and reports in the OSA Market, consider subscribing to industry newsletters, following relevant companies and organizations, or regularly checking reputable industry news sources and publications.
Methodology
Step 1 - Identification of Relevant Samples Size from Population Database


Step 2 - Approaches for Defining Global Market Size (Value, Volume* & Price*)

Note*: In applicable scenarios
Step 3 - Data Sources
Primary Research
- Web Analytics
- Survey Reports
- Research Institute
- Latest Research Reports
- Opinion Leaders
Secondary Research
- Annual Reports
- White Paper
- Latest Press Release
- Industry Association
- Paid Database
- Investor Presentations

Step 4 - Data Triangulation
Involves using different sources of information in order to increase the validity of a study
These sources are likely to be stakeholders in a program - participants, other researchers, program staff, other community members, and so on.
Then we put all data in single framework & apply various statistical tools to find out the dynamic on the market.
During the analysis stage, feedback from the stakeholder groups would be compared to determine areas of agreement as well as areas of divergence
