

Key Insights
The personalized supplement market is experiencing robust growth, driven by increasing consumer awareness of personalized health and wellness, advancements in genomics and nutrigenomics, and the rising adoption of direct-to-consumer (DTC) testing and supplement delivery models. The market's expansion is fueled by a growing understanding that a "one-size-fits-all" approach to supplementation is ineffective, with individuals responding differently to various nutrients based on their unique genetic makeup, lifestyle, and health goals. This shift in consumer preference is pushing the industry towards highly targeted products that address specific nutritional deficiencies and support personalized health objectives, from boosting athletic performance to improving gut health and managing chronic conditions. Companies like Genomix Nutrition, DNAFit, GX Sciences, InsideTracker, Habit Food Personalized, and Lonza are leading this charge, investing in research and development to create sophisticated personalized supplement formulations. The market is segmented based on product type (e.g., vitamins, minerals, probiotics), delivery method (e.g., powder, capsules), and target consumer groups (e.g., athletes, individuals with specific health concerns). The North American and European markets currently dominate, but significant growth potential exists in Asia-Pacific and other emerging economies as consumer awareness and purchasing power increase.
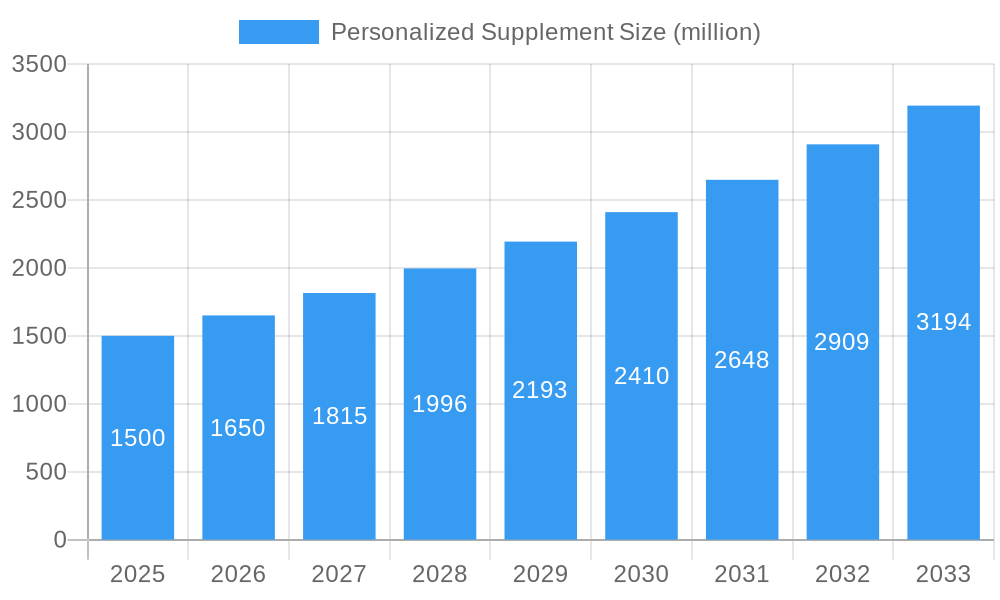
Personalized Supplement Market Size (In Billion)
The projected Compound Annual Growth Rate (CAGR) indicates a sustained upward trajectory for the personalized supplement market. This growth will likely be further fueled by technological advancements in genetic testing and data analysis, allowing for more precise and effective personalized supplement recommendations. However, challenges remain, including the need for robust clinical evidence supporting the efficacy of personalized supplements, regulatory hurdles, and addressing consumer concerns about data privacy and the cost of personalized testing and supplementation. Overcoming these hurdles will be critical for achieving the market's full potential and ensuring the long-term sustainability of this rapidly evolving sector. Future innovations will likely focus on integrating wearable sensor technology to monitor individual responses to supplements in real-time, enabling continuous optimization and further personalization of the supplement regimen.
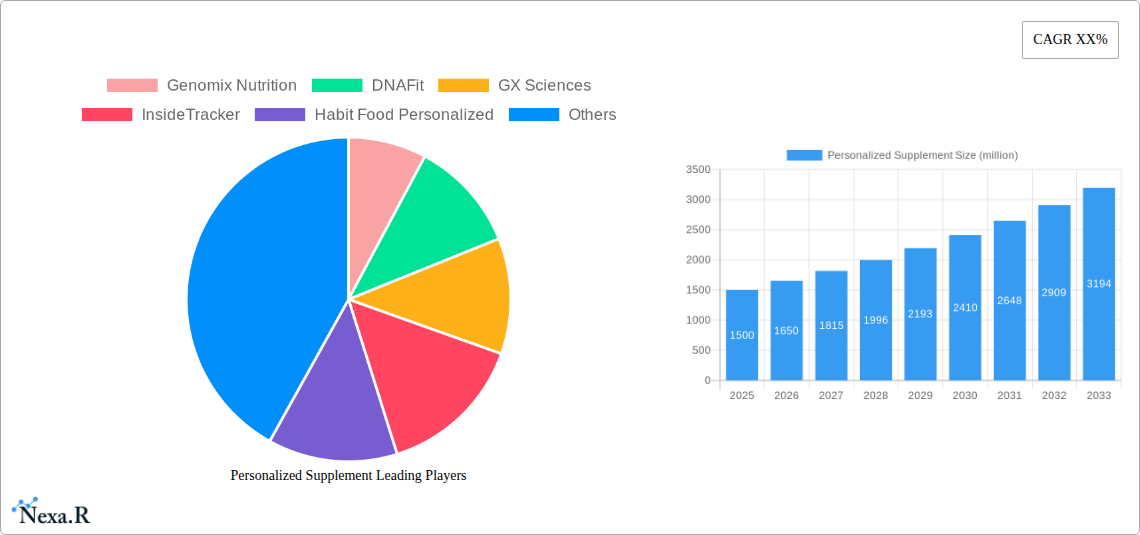
Personalized Supplement Company Market Share
Personalized Supplement Market Report: 2019-2033
This comprehensive report provides a detailed analysis of the personalized supplement market, encompassing market dynamics, growth trends, regional analysis, product landscape, key players, and future outlook. The report leverages extensive data and insights to offer a 360-degree view of this rapidly evolving sector, covering the historical period (2019-2024), base year (2025), and forecast period (2025-2033). The study period spans 2019-2033, providing a long-term perspective on market evolution. This report is invaluable for industry professionals, investors, and anyone seeking to understand the complexities and opportunities within the personalized nutrition market.
Personalized Supplement Market Dynamics & Structure
The personalized supplement market is characterized by a moderately fragmented structure, with key players like Genomix Nutrition, DNAFit, GX Sciences, InsideTracker, Habit Food Personalized, and Lonza vying for market share. Market concentration is expected to increase slightly over the forecast period, driven by M&A activity and the consolidation of smaller players. Technological innovation, particularly in genomics and AI-driven personalization, is a significant driver of market growth. Regulatory frameworks concerning supplement labeling and ingredient approvals vary across regions, posing both opportunities and challenges. Competitive substitutes include traditional, non-personalized supplements and functional foods. The end-user demographic skews towards health-conscious consumers with higher disposable incomes, particularly in developed markets.
- Market Concentration: Moderately fragmented (2025: xx%); expected slight increase by 2033.
- Technological Innovation: Genomics, AI-driven personalization, microbiome analysis are key drivers.
- Regulatory Landscape: Varied across regions, impacting product approval and labeling.
- Competitive Substitutes: Traditional supplements, functional foods.
- End-User Demographics: Health-conscious, higher disposable income, concentrated in developed nations.
- M&A Activity: xx deals recorded during 2019-2024, with projected increase to xx deals by 2033. (Note: Specific numbers depend on available data and predictions)
Personalized Supplement Growth Trends & Insights
The personalized supplement market exhibits robust growth, driven by increasing awareness of personalized nutrition, rising prevalence of chronic diseases, and the advancement of enabling technologies. The market size experienced a CAGR of xx% during the historical period (2019-2024) and is projected to reach $xx billion by 2025, growing at a CAGR of xx% from 2025-2033. Technological disruptions, such as advancements in genetic testing and microbiome analysis, have significantly increased the accuracy and personalization of supplement recommendations. Consumer behavior shifts toward proactive health management and personalized wellness contribute to the market's expansion. Market penetration is increasing steadily, particularly amongst younger demographics and those actively managing their health. This growth is further fueled by the increasing accessibility and affordability of personalized supplement offerings.
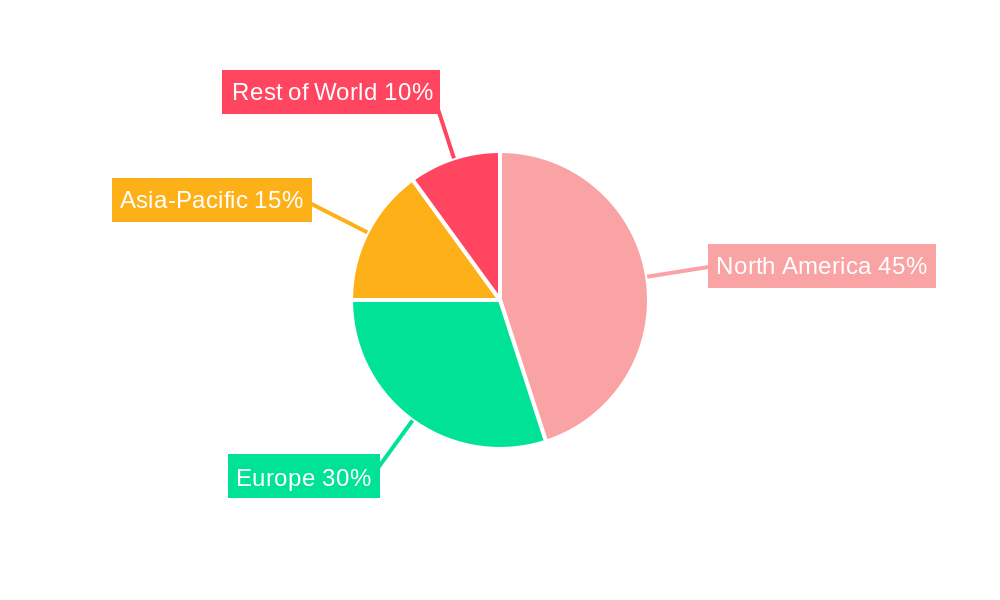
Dominant Regions, Countries, or Segments in Personalized Supplement
North America currently dominates the personalized supplement market, driven by high consumer awareness, strong regulatory support (albeit with regional variations), and a significant presence of key players. Europe is witnessing substantial growth, fueled by increasing health consciousness and rising disposable incomes. The Asia-Pacific region shows significant potential, with a growing middle class and increasing demand for personalized healthcare solutions. Within segments, direct-to-consumer (DTC) personalized supplement sales are experiencing rapid growth, while B2B segments like partnerships with healthcare providers are also expanding.
- North America: High consumer awareness, established players, strong regulatory environment (with caveats).
- Europe: Growing health consciousness, rising disposable incomes.
- Asia-Pacific: Expanding middle class, increasing demand for personalized healthcare.
- Segments: DTC sales show significant growth; B2B partnerships with healthcare providers are also expanding.
Personalized Supplement Product Landscape
Personalized supplement products range from customized vitamin and mineral blends formulated based on individual genetic profiles and lifestyle assessments to targeted supplements designed to address specific health concerns. Innovative products incorporate advanced technologies such as microbiome testing and AI-powered algorithms to create highly individualized supplement plans. These products boast unique selling propositions emphasizing improved efficacy, reduced side effects, and tailored solutions for individual needs. Ongoing technological advancements are driving the development of even more sophisticated and effective personalized supplements, with a focus on enhanced bioavailability and targeted delivery systems.
Key Drivers, Barriers & Challenges in Personalized Supplement
Key Drivers: Increasing consumer awareness of personalized nutrition; advancements in genetic testing and microbiome analysis; rising prevalence of chronic diseases; growth of the health and wellness industry; and increasing affordability of personalized supplement solutions.
Key Barriers & Challenges: High initial cost of genetic testing and personalized formulations; regulatory uncertainties and variations across different regions; consumer skepticism and lack of understanding about personalized nutrition; competition from traditional supplements; and maintaining data privacy and security. For instance, stringent regulatory pathways in specific countries can delay product launches, impacting market penetration.
Emerging Opportunities in Personalized Supplement
Emerging opportunities include expansion into untapped markets (e.g., developing countries), development of novel personalized supplement delivery systems (e.g., wearable technology), integration with wearable health trackers for real-time data analysis, and the focus on personalized solutions for specific conditions like gut health and athletic performance. Furthermore, the development of tailored supplements catering to specific age groups or life stages presents significant potential.
Growth Accelerators in the Personalized Supplement Industry
Technological breakthroughs in areas like AI-driven personalization, advanced genetic testing, and microbiome analysis will be key growth drivers. Strategic partnerships between supplement companies and healthcare providers will expand access to personalized nutrition solutions, accelerating market penetration. The expansion into new global markets, especially in regions with growing health awareness, will create substantial growth opportunities.
Key Players Shaping the Personalized Supplement Market
- Genomix Nutrition
- DNAFit
- GX Sciences
- InsideTracker
- Habit Food Personalized
- Lonza
Notable Milestones in Personalized Supplement Sector
- 2020: Launch of several AI-powered supplement recommendation platforms.
- 2021: Increased regulatory scrutiny regarding personalized supplement claims.
- 2022: Significant investment in personalized nutrition research and development.
- 2023: Several key mergers and acquisitions among personalized supplement companies.
- 2024: Introduction of advanced microbiome testing kits for personalized supplement guidance. (Specific dates and details require further research)
In-Depth Personalized Supplement Market Outlook
The personalized supplement market is poised for continued strong growth, driven by technological advancements, increasing consumer demand for personalized healthcare, and strategic partnerships. The expansion into new markets and the development of innovative product offerings will further accelerate market expansion. Strategic investments in research and development will lead to the creation of more effective and targeted personalized supplements, while addressing the challenges related to cost and regulation will further unlock market potential.
Personalized Supplement Segmentation
-
1. Application
- 1.1. Direct-to-consumer
- 1.2. Wellness & fitness centers
- 1.3. Hospitals & clinics
- 1.4. Institutions
-
2. Types
- 2.1. Standard Supplements
- 2.2. Disease-based Supplements
Personalized Supplement Segmentation By Geography
-
1. North America
- 1.1. United States
- 1.2. Canada
- 1.3. Mexico
-
2. South America
- 2.1. Brazil
- 2.2. Argentina
- 2.3. Rest of South America
-
3. Europe
- 3.1. United Kingdom
- 3.2. Germany
- 3.3. France
- 3.4. Italy
- 3.5. Spain
- 3.6. Russia
- 3.7. Benelux
- 3.8. Nordics
- 3.9. Rest of Europe
-
4. Middle East & Africa
- 4.1. Turkey
- 4.2. Israel
- 4.3. GCC
- 4.4. North Africa
- 4.5. South Africa
- 4.6. Rest of Middle East & Africa
-
5. Asia Pacific
- 5.1. China
- 5.2. India
- 5.3. Japan
- 5.4. South Korea
- 5.5. ASEAN
- 5.6. Oceania
- 5.7. Rest of Asia Pacific
Personalized Supplement Regional Market Share
Geographic Coverage of Personalized Supplement
Personalized Supplement REPORT HIGHLIGHTS
| Aspects | Details |
|---|---|
| Study Period | 2020-2034 |
| Base Year | 2025 |
| Estimated Year | 2026 |
| Forecast Period | 2026-2034 |
| Historical Period | 2020-2025 |
| Growth Rate | CAGR of XX% from 2020-2034 |
| Segmentation |
|
Table of Contents
- 1. Introduction
- 1.1. Research Scope
- 1.2. Market Segmentation
- 1.3. Research Objective
- 1.4. Definitions and Assumptions
- 2. Executive Summary
- 2.1. Market Snapshot
- 3. Market Dynamics
- 3.1. Market Drivers
- 3.2. Market Restrains
- 3.3. Market Trends
- 3.4. Market Opportunities
- 4. Market Factor Analysis
- 4.1. Porters Five Forces
- 4.1.1. Bargaining Power of Suppliers
- 4.1.2. Bargaining Power of Buyers
- 4.1.3. Threat of New Entrants
- 4.1.4. Threat of Substitutes
- 4.1.5. Competitive Rivalry
- 4.2. PESTEL analysis
- 4.3. BCG Analysis
- 4.3.1. Stars (High Growth, High Market Share)
- 4.3.2. Cash Cows (Low Growth, High Market Share)
- 4.3.3. Question Mark (High Growth, Low Market Share)
- 4.3.4. Dogs (Low Growth, Low Market Share)
- 4.4. Ansoff Matrix Analysis
- 4.5. Supply Chain Analysis
- 4.6. Regulatory Landscape
- 4.7. Current Market Potential and Opportunity Assessment (TAM–SAM–SOM Framework)
- 4.8. NRP Analyst Note
- 4.1. Porters Five Forces
- 5. Market Analysis, Insights and Forecast 2021-2033
- 5.1. Market Analysis, Insights and Forecast - by Application
- 5.1.1. Direct-to-consumer
- 5.1.2. Wellness & fitness centers
- 5.1.3. Hospitals & clinics
- 5.1.4. Institutions
- 5.2. Market Analysis, Insights and Forecast - by Types
- 5.2.1. Standard Supplements
- 5.2.2. Disease-based Supplements
- 5.3. Market Analysis, Insights and Forecast - by Region
- 5.3.1. North America
- 5.3.2. South America
- 5.3.3. Europe
- 5.3.4. Middle East & Africa
- 5.3.5. Asia Pacific
- 5.1. Market Analysis, Insights and Forecast - by Application
- 6. Global Personalized Supplement Analysis, Insights and Forecast, 2021-2033
- 6.1. Market Analysis, Insights and Forecast - by Application
- 6.1.1. Direct-to-consumer
- 6.1.2. Wellness & fitness centers
- 6.1.3. Hospitals & clinics
- 6.1.4. Institutions
- 6.2. Market Analysis, Insights and Forecast - by Types
- 6.2.1. Standard Supplements
- 6.2.2. Disease-based Supplements
- 6.1. Market Analysis, Insights and Forecast - by Application
- 7. North America Personalized Supplement Analysis, Insights and Forecast, 2020-2032
- 7.1. Market Analysis, Insights and Forecast - by Application
- 7.1.1. Direct-to-consumer
- 7.1.2. Wellness & fitness centers
- 7.1.3. Hospitals & clinics
- 7.1.4. Institutions
- 7.2. Market Analysis, Insights and Forecast - by Types
- 7.2.1. Standard Supplements
- 7.2.2. Disease-based Supplements
- 7.1. Market Analysis, Insights and Forecast - by Application
- 8. South America Personalized Supplement Analysis, Insights and Forecast, 2020-2032
- 8.1. Market Analysis, Insights and Forecast - by Application
- 8.1.1. Direct-to-consumer
- 8.1.2. Wellness & fitness centers
- 8.1.3. Hospitals & clinics
- 8.1.4. Institutions
- 8.2. Market Analysis, Insights and Forecast - by Types
- 8.2.1. Standard Supplements
- 8.2.2. Disease-based Supplements
- 8.1. Market Analysis, Insights and Forecast - by Application
- 9. Europe Personalized Supplement Analysis, Insights and Forecast, 2020-2032
- 9.1. Market Analysis, Insights and Forecast - by Application
- 9.1.1. Direct-to-consumer
- 9.1.2. Wellness & fitness centers
- 9.1.3. Hospitals & clinics
- 9.1.4. Institutions
- 9.2. Market Analysis, Insights and Forecast - by Types
- 9.2.1. Standard Supplements
- 9.2.2. Disease-based Supplements
- 9.1. Market Analysis, Insights and Forecast - by Application
- 10. Middle East & Africa Personalized Supplement Analysis, Insights and Forecast, 2020-2032
- 10.1. Market Analysis, Insights and Forecast - by Application
- 10.1.1. Direct-to-consumer
- 10.1.2. Wellness & fitness centers
- 10.1.3. Hospitals & clinics
- 10.1.4. Institutions
- 10.2. Market Analysis, Insights and Forecast - by Types
- 10.2.1. Standard Supplements
- 10.2.2. Disease-based Supplements
- 10.1. Market Analysis, Insights and Forecast - by Application
- 11. Asia Pacific Personalized Supplement Analysis, Insights and Forecast, 2020-2032
- 11.1. Market Analysis, Insights and Forecast - by Application
- 11.1.1. Direct-to-consumer
- 11.1.2. Wellness & fitness centers
- 11.1.3. Hospitals & clinics
- 11.1.4. Institutions
- 11.2. Market Analysis, Insights and Forecast - by Types
- 11.2.1. Standard Supplements
- 11.2.2. Disease-based Supplements
- 11.1. Market Analysis, Insights and Forecast - by Application
- 12. Competitive Analysis
- 12.1. Company Profiles
- 12.1.1 Genomix Nutrition
- 12.1.1.1. Company Overview
- 12.1.1.2. Products
- 12.1.1.3. Company Financials
- 12.1.1.4. SWOT Analysis
- 12.1.2 DNAFit
- 12.1.2.1. Company Overview
- 12.1.2.2. Products
- 12.1.2.3. Company Financials
- 12.1.2.4. SWOT Analysis
- 12.1.3 GX Sciences
- 12.1.3.1. Company Overview
- 12.1.3.2. Products
- 12.1.3.3. Company Financials
- 12.1.3.4. SWOT Analysis
- 12.1.4 InsideTracker
- 12.1.4.1. Company Overview
- 12.1.4.2. Products
- 12.1.4.3. Company Financials
- 12.1.4.4. SWOT Analysis
- 12.1.5 Habit Food Personalized
- 12.1.5.1. Company Overview
- 12.1.5.2. Products
- 12.1.5.3. Company Financials
- 12.1.5.4. SWOT Analysis
- 12.1.6 Lonza
- 12.1.6.1. Company Overview
- 12.1.6.2. Products
- 12.1.6.3. Company Financials
- 12.1.6.4. SWOT Analysis
- 12.1.1 Genomix Nutrition
- 12.2. Market Entropy
- 12.2.1 Company's Key Areas Served
- 12.2.2 Recent Developments
- 12.3. Company Market Share Analysis 2025
- 12.3.1 Top 5 Companies Market Share Analysis
- 12.3.2 Top 3 Companies Market Share Analysis
- 12.4. List of Potential Customers
- 13. Research Methodology
List of Figures
- Figure 1: Global Personalized Supplement Revenue Breakdown (million, %) by Region 2025 & 2033
- Figure 2: North America Personalized Supplement Revenue (million), by Application 2025 & 2033
- Figure 3: North America Personalized Supplement Revenue Share (%), by Application 2025 & 2033
- Figure 4: North America Personalized Supplement Revenue (million), by Types 2025 & 2033
- Figure 5: North America Personalized Supplement Revenue Share (%), by Types 2025 & 2033
- Figure 6: North America Personalized Supplement Revenue (million), by Country 2025 & 2033
- Figure 7: North America Personalized Supplement Revenue Share (%), by Country 2025 & 2033
- Figure 8: South America Personalized Supplement Revenue (million), by Application 2025 & 2033
- Figure 9: South America Personalized Supplement Revenue Share (%), by Application 2025 & 2033
- Figure 10: South America Personalized Supplement Revenue (million), by Types 2025 & 2033
- Figure 11: South America Personalized Supplement Revenue Share (%), by Types 2025 & 2033
- Figure 12: South America Personalized Supplement Revenue (million), by Country 2025 & 2033
- Figure 13: South America Personalized Supplement Revenue Share (%), by Country 2025 & 2033
- Figure 14: Europe Personalized Supplement Revenue (million), by Application 2025 & 2033
- Figure 15: Europe Personalized Supplement Revenue Share (%), by Application 2025 & 2033
- Figure 16: Europe Personalized Supplement Revenue (million), by Types 2025 & 2033
- Figure 17: Europe Personalized Supplement Revenue Share (%), by Types 2025 & 2033
- Figure 18: Europe Personalized Supplement Revenue (million), by Country 2025 & 2033
- Figure 19: Europe Personalized Supplement Revenue Share (%), by Country 2025 & 2033
- Figure 20: Middle East & Africa Personalized Supplement Revenue (million), by Application 2025 & 2033
- Figure 21: Middle East & Africa Personalized Supplement Revenue Share (%), by Application 2025 & 2033
- Figure 22: Middle East & Africa Personalized Supplement Revenue (million), by Types 2025 & 2033
- Figure 23: Middle East & Africa Personalized Supplement Revenue Share (%), by Types 2025 & 2033
- Figure 24: Middle East & Africa Personalized Supplement Revenue (million), by Country 2025 & 2033
- Figure 25: Middle East & Africa Personalized Supplement Revenue Share (%), by Country 2025 & 2033
- Figure 26: Asia Pacific Personalized Supplement Revenue (million), by Application 2025 & 2033
- Figure 27: Asia Pacific Personalized Supplement Revenue Share (%), by Application 2025 & 2033
- Figure 28: Asia Pacific Personalized Supplement Revenue (million), by Types 2025 & 2033
- Figure 29: Asia Pacific Personalized Supplement Revenue Share (%), by Types 2025 & 2033
- Figure 30: Asia Pacific Personalized Supplement Revenue (million), by Country 2025 & 2033
- Figure 31: Asia Pacific Personalized Supplement Revenue Share (%), by Country 2025 & 2033
List of Tables
- Table 1: Global Personalized Supplement Revenue million Forecast, by Application 2020 & 2033
- Table 2: Global Personalized Supplement Revenue million Forecast, by Types 2020 & 2033
- Table 3: Global Personalized Supplement Revenue million Forecast, by Region 2020 & 2033
- Table 4: Global Personalized Supplement Revenue million Forecast, by Application 2020 & 2033
- Table 5: Global Personalized Supplement Revenue million Forecast, by Types 2020 & 2033
- Table 6: Global Personalized Supplement Revenue million Forecast, by Country 2020 & 2033
- Table 7: United States Personalized Supplement Revenue (million) Forecast, by Application 2020 & 2033
- Table 8: Canada Personalized Supplement Revenue (million) Forecast, by Application 2020 & 2033
- Table 9: Mexico Personalized Supplement Revenue (million) Forecast, by Application 2020 & 2033
- Table 10: Global Personalized Supplement Revenue million Forecast, by Application 2020 & 2033
- Table 11: Global Personalized Supplement Revenue million Forecast, by Types 2020 & 2033
- Table 12: Global Personalized Supplement Revenue million Forecast, by Country 2020 & 2033
- Table 13: Brazil Personalized Supplement Revenue (million) Forecast, by Application 2020 & 2033
- Table 14: Argentina Personalized Supplement Revenue (million) Forecast, by Application 2020 & 2033
- Table 15: Rest of South America Personalized Supplement Revenue (million) Forecast, by Application 2020 & 2033
- Table 16: Global Personalized Supplement Revenue million Forecast, by Application 2020 & 2033
- Table 17: Global Personalized Supplement Revenue million Forecast, by Types 2020 & 2033
- Table 18: Global Personalized Supplement Revenue million Forecast, by Country 2020 & 2033
- Table 19: United Kingdom Personalized Supplement Revenue (million) Forecast, by Application 2020 & 2033
- Table 20: Germany Personalized Supplement Revenue (million) Forecast, by Application 2020 & 2033
- Table 21: France Personalized Supplement Revenue (million) Forecast, by Application 2020 & 2033
- Table 22: Italy Personalized Supplement Revenue (million) Forecast, by Application 2020 & 2033
- Table 23: Spain Personalized Supplement Revenue (million) Forecast, by Application 2020 & 2033
- Table 24: Russia Personalized Supplement Revenue (million) Forecast, by Application 2020 & 2033
- Table 25: Benelux Personalized Supplement Revenue (million) Forecast, by Application 2020 & 2033
- Table 26: Nordics Personalized Supplement Revenue (million) Forecast, by Application 2020 & 2033
- Table 27: Rest of Europe Personalized Supplement Revenue (million) Forecast, by Application 2020 & 2033
- Table 28: Global Personalized Supplement Revenue million Forecast, by Application 2020 & 2033
- Table 29: Global Personalized Supplement Revenue million Forecast, by Types 2020 & 2033
- Table 30: Global Personalized Supplement Revenue million Forecast, by Country 2020 & 2033
- Table 31: Turkey Personalized Supplement Revenue (million) Forecast, by Application 2020 & 2033
- Table 32: Israel Personalized Supplement Revenue (million) Forecast, by Application 2020 & 2033
- Table 33: GCC Personalized Supplement Revenue (million) Forecast, by Application 2020 & 2033
- Table 34: North Africa Personalized Supplement Revenue (million) Forecast, by Application 2020 & 2033
- Table 35: South Africa Personalized Supplement Revenue (million) Forecast, by Application 2020 & 2033
- Table 36: Rest of Middle East & Africa Personalized Supplement Revenue (million) Forecast, by Application 2020 & 2033
- Table 37: Global Personalized Supplement Revenue million Forecast, by Application 2020 & 2033
- Table 38: Global Personalized Supplement Revenue million Forecast, by Types 2020 & 2033
- Table 39: Global Personalized Supplement Revenue million Forecast, by Country 2020 & 2033
- Table 40: China Personalized Supplement Revenue (million) Forecast, by Application 2020 & 2033
- Table 41: India Personalized Supplement Revenue (million) Forecast, by Application 2020 & 2033
- Table 42: Japan Personalized Supplement Revenue (million) Forecast, by Application 2020 & 2033
- Table 43: South Korea Personalized Supplement Revenue (million) Forecast, by Application 2020 & 2033
- Table 44: ASEAN Personalized Supplement Revenue (million) Forecast, by Application 2020 & 2033
- Table 45: Oceania Personalized Supplement Revenue (million) Forecast, by Application 2020 & 2033
- Table 46: Rest of Asia Pacific Personalized Supplement Revenue (million) Forecast, by Application 2020 & 2033
Frequently Asked Questions
1. What is the projected Compound Annual Growth Rate (CAGR) of the Personalized Supplement?
The projected CAGR is approximately XX%.
2. Which companies are prominent players in the Personalized Supplement?
Key companies in the market include Genomix Nutrition, DNAFit, GX Sciences, InsideTracker, Habit Food Personalized, Lonza.
3. What are the main segments of the Personalized Supplement?
The market segments include Application, Types.
4. Can you provide details about the market size?
The market size is estimated to be USD XXX million as of 2022.
5. What are some drivers contributing to market growth?
N/A
6. What are the notable trends driving market growth?
N/A
7. Are there any restraints impacting market growth?
N/A
8. Can you provide examples of recent developments in the market?
N/A
9. What pricing options are available for accessing the report?
Pricing options include single-user, multi-user, and enterprise licenses priced at USD 5600.00, USD 8400.00, and USD 11200.00 respectively.
10. Is the market size provided in terms of value or volume?
The market size is provided in terms of value, measured in million.
11. Are there any specific market keywords associated with the report?
Yes, the market keyword associated with the report is "Personalized Supplement," which aids in identifying and referencing the specific market segment covered.
12. How do I determine which pricing option suits my needs best?
The pricing options vary based on user requirements and access needs. Individual users may opt for single-user licenses, while businesses requiring broader access may choose multi-user or enterprise licenses for cost-effective access to the report.
13. Are there any additional resources or data provided in the Personalized Supplement report?
While the report offers comprehensive insights, it's advisable to review the specific contents or supplementary materials provided to ascertain if additional resources or data are available.
14. How can I stay updated on further developments or reports in the Personalized Supplement?
To stay informed about further developments, trends, and reports in the Personalized Supplement, consider subscribing to industry newsletters, following relevant companies and organizations, or regularly checking reputable industry news sources and publications.
Methodology
Step 1 - Identification of Relevant Samples Size from Population Database


Step 2 - Approaches for Defining Global Market Size (Value, Volume* & Price*)

Note*: In applicable scenarios
Step 3 - Data Sources
Primary Research
- Web Analytics
- Survey Reports
- Research Institute
- Latest Research Reports
- Opinion Leaders
Secondary Research
- Annual Reports
- White Paper
- Latest Press Release
- Industry Association
- Paid Database
- Investor Presentations

Step 4 - Data Triangulation
Involves using different sources of information in order to increase the validity of a study
These sources are likely to be stakeholders in a program - participants, other researchers, program staff, other community members, and so on.
Then we put all data in single framework & apply various statistical tools to find out the dynamic on the market.
During the analysis stage, feedback from the stakeholder groups would be compared to determine areas of agreement as well as areas of divergence