

Key Insights
The Pharma Quality Management Software (PQMS) market is poised for substantial growth, driven by escalating regulatory demands, the imperative for superior data management, and the accelerated integration of digital technologies within the pharmaceutical sector. The market, estimated at $3.32 billion in 2025, is projected to expand at a Compound Annual Growth Rate (CAGR) of 11.62% through the forecast period of 2025-2033. Key growth catalysts include the increasing complexity of pharmaceutical regulations demanding robust compliance solutions, the critical need for enhanced data integrity and traceability throughout the drug lifecycle, and the growing preference for scalable and cost-effective cloud-based solutions. The proliferation of Corrective and Preventive Action (CAPA) management systems and the deployment of advanced analytics for quality control further bolster market expansion. The PQMS market is segmented by solution type (including CAPA, audit, document, change, training, complaints, regulatory/compliance, non-conformances, supplier quality, and inspection management), deployment model (cloud and on-premise), and enterprise size (SME and large enterprise), offering versatile solutions to meet diverse pharmaceutical company needs. The competitive landscape features established industry leaders such as Honeywell International Inc. and Veeva Systems Inc., alongside dynamic emerging innovators.
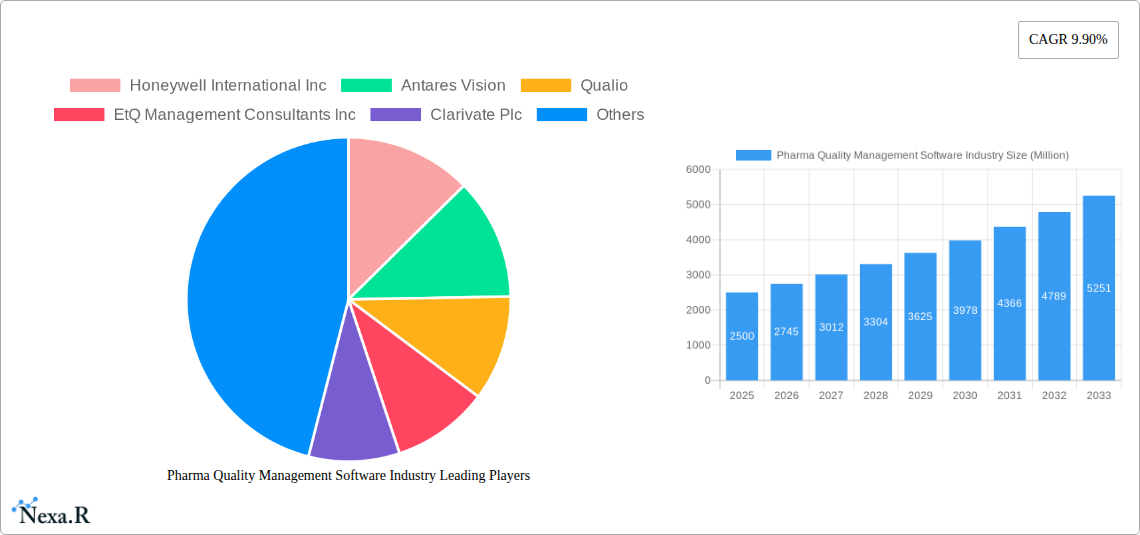
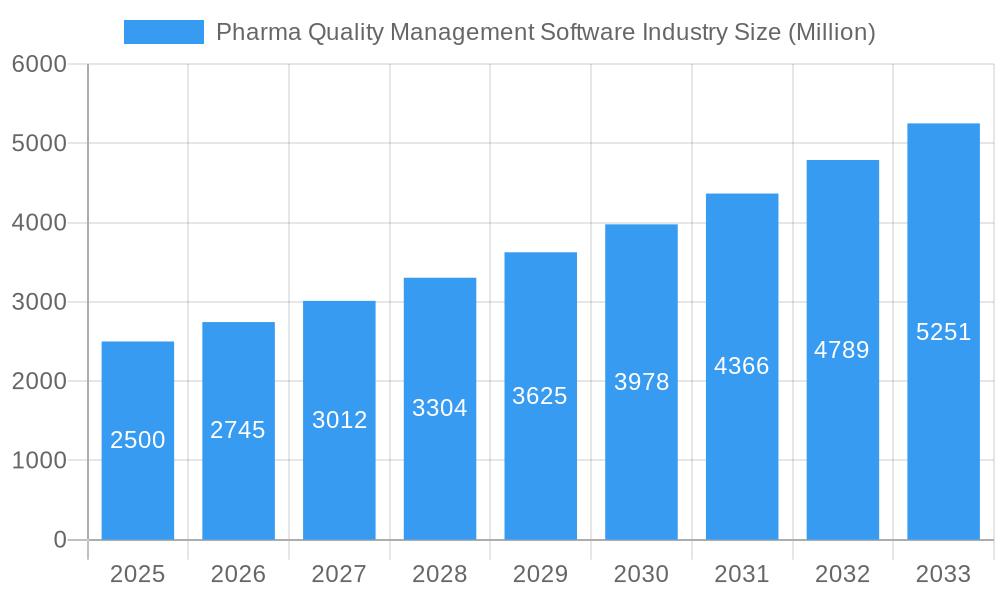
Pharma Quality Management Software Industry Market Size (In Billion)
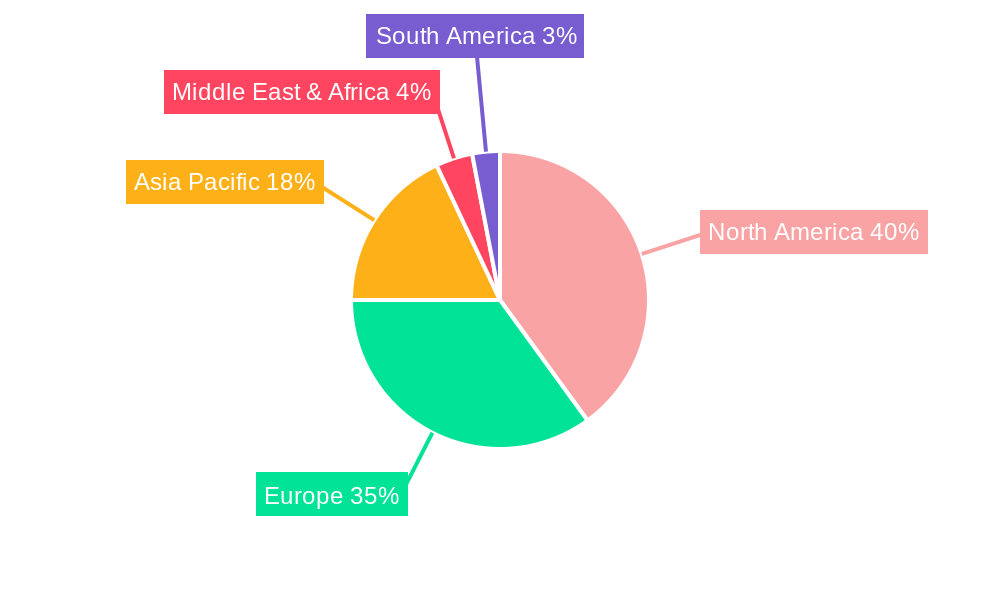
Geographically, North America and Europe demonstrate a strong market presence due to stringent regulatory environments and high adoption rates. However, the Asia-Pacific region is anticipated to experience the most rapid expansion, propelled by burgeoning pharmaceutical manufacturing capabilities and heightened regulatory focus. The cloud deployment segment is witnessing swift adoption due to its inherent scalability, flexibility, and reduced infrastructure expenses. While large enterprises currently represent the primary adopters of PQMS, the SME segment is progressively increasing its utilization, driven by the availability of more accessible and user-friendly solutions. Market growth is primarily moderated by the initial investment costs for PQMS implementation and the necessity for comprehensive staff training and system integration. Nevertheless, the enduring advantages of reduced operational costs, improved compliance, and enhanced quality are expected to surmount these initial hurdles, driving sustained market expansion.
Pharma Quality Management Software Industry Company Market Share
Pharma Quality Management Software Market Report: 2019-2033
This comprehensive report provides a detailed analysis of the Pharma Quality Management Software market, encompassing market dynamics, growth trends, regional segmentation, product landscape, key players, and future outlook. The study period covers 2019-2033, with a base year of 2025 and a forecast period of 2025-2033. The report uses data from 2019-2024 as the historical period. Market values are presented in millions of USD.
Pharma Quality Management Software Industry Market Dynamics & Structure
The Pharma Quality Management Software market is experiencing significant growth driven by increasing regulatory scrutiny, the need for enhanced data management, and the adoption of digital technologies within the pharmaceutical industry. Market concentration is moderate, with a few large players and numerous niche providers competing. Technological innovation is a key driver, with advancements in AI, cloud computing, and data analytics transforming software capabilities. Stringent regulatory frameworks, such as GMP and GxP, are crucial in shaping market practices. Competitive substitutes include manual quality management systems, but their limitations are driving market adoption of software solutions. The end-user demographic comprises pharmaceutical companies of all sizes, across various therapeutic areas. M&A activity is moderate, with larger players acquiring smaller firms to expand their product portfolios and market reach. The total market size in 2025 is estimated at xx Million.
- Market Concentration: Moderate, with a Herfindahl-Hirschman Index (HHI) of xx.
- M&A Deal Volume (2019-2024): xx deals
- Key Regulatory Frameworks: GMP, GxP, FDA 21 CFR Part 11
- Innovation Barriers: High initial investment costs, integration complexities, and data security concerns.
Pharma Quality Management Software Industry Growth Trends & Insights
The Pharma Quality Management Software market exhibits robust growth, driven by increasing demand for efficient quality management systems and the rising adoption of cloud-based solutions. The market experienced a Compound Annual Growth Rate (CAGR) of xx% during the historical period (2019-2024) and is projected to maintain a CAGR of xx% during the forecast period (2025-2033). This growth is fueled by technological advancements such as AI-powered quality control and improved data analytics. The rising adoption of cloud-based solutions offers scalability and accessibility, enhancing market penetration. Consumer behavior shifts towards data-driven decision-making and the need for improved regulatory compliance also contribute to market expansion. Market penetration in 2025 is estimated at xx%. By 2033, the market size is predicted to reach xx Million.
Dominant Regions, Countries, or Segments in Pharma Quality Management Software Industry
North America currently dominates the Pharma Quality Management Software market, driven by strong regulatory compliance requirements and high adoption rates among large pharmaceutical companies. Within solution types, CAPA Management and Regulatory and Compliance Management are leading segments, reflecting the industry's focus on risk mitigation and regulatory adherence. Cloud-based deployments dominate over on-premise solutions due to their scalability and cost-effectiveness. Large enterprises lead in adoption due to their greater resources and complex quality management needs. European markets are also showing strong growth, and the Asia-Pacific region presents significant untapped potential.
- Leading Region: North America
- Leading Solution Type: CAPA Management, Regulatory and Compliance Management
- Leading Deployment Type: On Cloud
- Leading Enterprise Size: Large Enterprise
- Key Growth Drivers: Stringent regulatory environment, rising adoption of cloud-based solutions, and increasing focus on data-driven decision-making.
Pharma Quality Management Software Industry Product Landscape
Pharma Quality Management Software solutions are increasingly incorporating advanced features such as AI-powered anomaly detection, predictive analytics for quality control, and streamlined workflows for regulatory compliance. These advancements enhance efficiency, reduce manual errors, and improve overall quality assurance. Unique selling propositions include ease of use, seamless integration with other enterprise systems, and comprehensive reporting capabilities. The trend towards cloud-based solutions continues to dominate the product landscape, offering improved accessibility and scalability.
Key Drivers, Barriers & Challenges in Pharma Quality Management Software Industry
Key Drivers:
- Increasing regulatory pressure for enhanced quality control and compliance.
- Growing adoption of digital technologies and data-driven decision-making.
- Need for improved efficiency and reduced operational costs.
Key Challenges and Restraints:
- High initial investment costs for software implementation and integration.
- Data security and privacy concerns related to sensitive patient information.
- Resistance to change among some pharmaceutical companies with established processes.
- Integration complexities with existing systems leading to xx% of projects facing delays.
Emerging Opportunities in Pharma Quality Management Software Industry
Emerging opportunities include the expansion into emerging markets with growing pharmaceutical industries, the development of specialized solutions for specific therapeutic areas, and integration with other advanced technologies such as blockchain for enhanced traceability and security. The increasing focus on personalized medicine and advanced therapies also presents opportunities for specialized quality management solutions.
Growth Accelerators in the Pharma Quality Management Software Industry
Strategic partnerships between software vendors and pharmaceutical companies will accelerate market growth, facilitating better integration and customized solutions. Continuous technological innovation, particularly in AI and machine learning, will enhance the capabilities of quality management software, leading to improved efficiency and decision-making. Expansion into untapped markets in emerging economies and the development of tailored solutions for specific industry needs will further drive market expansion.
Key Players Shaping the Pharma Quality Management Software Market
- Honeywell International Inc
- Antares Vision
- Qualio
- EtQ Management Consultants Inc
- Clarivate Plc
- AssurX Inc
- Veeva Systems Inc
- AXSource
- IQVIA
- Ideagen PLC
- ComplianceQuest
- Dassault Systemes
Notable Milestones in Pharma Quality Management Software Industry Sector
- August 2022: The National Pharmaceutical Pricing Authority (NPPA) launched Integrated Pharmaceutical Database Management System 2.0 and Pharma Sahi Daam 2.0 apps, enhancing business ease. This spurred increased demand for compatible software solutions.
- December 2022: FILTEC's launch of the Remote Vision Inspection (RVI) system improved in-line inspection capabilities, boosting the market for integrated inspection management software.
- January 2023: Palantir Technologies Inc. launched a quality management system, increasing competition and driving innovation within the sector.
In-Depth Pharma Quality Management Software Industry Market Outlook
The Pharma Quality Management Software market is poised for continued strong growth, driven by ongoing technological advancements, increased regulatory scrutiny, and the expanding adoption of cloud-based solutions. Strategic partnerships, product innovation, and expansion into new markets present significant opportunities for growth. The focus on data-driven decision-making and the increasing need for efficient quality control systems will continue to propel market expansion throughout the forecast period, leading to a substantial increase in market value by 2033.
Pharma Quality Management Software Industry Segmentation
-
1. Solution Type
- 1.1. Correcti
- 1.2. Audit Management
- 1.3. Document Management
- 1.4. Change Management
- 1.5. Training Management
- 1.6. Complaints Management
- 1.7. Regulatory and Compliance Management
- 1.8. Non-Conformances Handling
- 1.9. Supplier Quality Management
- 1.10. Inspection Management
- 1.11. Other solution Types
-
2. Deployment
- 2.1. On Cloud
- 2.2. On-premise
-
3. Enterprize Size
- 3.1. Small and Medium Enterprise (SME)
- 3.2. Large Enterprise
Pharma Quality Management Software Industry Segmentation By Geography
-
1. North America
- 1.1. United States
- 1.2. Canada
- 1.3. Mexico
-
2. Europe
- 2.1. Germany
- 2.2. United Kingdom
- 2.3. France
- 2.4. Italy
- 2.5. Spain
- 2.6. Rest of Europe
-
3. Asia Pacific
- 3.1. China
- 3.2. Japan
- 3.3. India
- 3.4. Australia
- 3.5. South Korea
- 3.6. Rest of Asia Pacific
-
4. Middle East and Africa
- 4.1. GCC
- 4.2. South Africa
- 4.3. Rest of Middle East and Africa
-
5. South America
- 5.1. Brazil
- 5.2. Argentina
- 5.3. Rest of South America
Pharma Quality Management Software Industry Regional Market Share
Geographic Coverage of Pharma Quality Management Software Industry
Pharma Quality Management Software Industry REPORT HIGHLIGHTS
| Aspects | Details |
|---|---|
| Study Period | 2020-2034 |
| Base Year | 2025 |
| Estimated Year | 2026 |
| Forecast Period | 2026-2034 |
| Historical Period | 2020-2025 |
| Growth Rate | CAGR of 11.62% from 2020-2034 |
| Segmentation |
|
Table of Contents
- 1. Introduction
- 1.1. Research Scope
- 1.2. Market Segmentation
- 1.3. Research Objective
- 1.4. Definitions and Assumptions
- 2. Executive Summary
- 2.1. Market Snapshot
- 3. Market Dynamics
- 3.1. Market Drivers
- 3.2. Market Restrains
- 3.3. Market Trends
- 3.4. Market Opportunities
- 4. Market Factor Analysis
- 4.1. Porters Five Forces
- 4.1.1. Bargaining Power of Suppliers
- 4.1.2. Bargaining Power of Buyers
- 4.1.3. Threat of New Entrants
- 4.1.4. Threat of Substitutes
- 4.1.5. Competitive Rivalry
- 4.2. PESTEL analysis
- 4.3. BCG Analysis
- 4.3.1. Stars (High Growth, High Market Share)
- 4.3.2. Cash Cows (Low Growth, High Market Share)
- 4.3.3. Question Mark (High Growth, Low Market Share)
- 4.3.4. Dogs (Low Growth, Low Market Share)
- 4.4. Ansoff Matrix Analysis
- 4.5. Supply Chain Analysis
- 4.6. Regulatory Landscape
- 4.7. Current Market Potential and Opportunity Assessment (TAM–SAM–SOM Framework)
- 4.8. NRP Analyst Note
- 4.1. Porters Five Forces
- 5. Market Analysis, Insights and Forecast 2021-2033
- 5.1. Market Analysis, Insights and Forecast - by Solution Type
- 5.1.1. Correcti
- 5.1.2. Audit Management
- 5.1.3. Document Management
- 5.1.4. Change Management
- 5.1.5. Training Management
- 5.1.6. Complaints Management
- 5.1.7. Regulatory and Compliance Management
- 5.1.8. Non-Conformances Handling
- 5.1.9. Supplier Quality Management
- 5.1.10. Inspection Management
- 5.1.11. Other solution Types
- 5.2. Market Analysis, Insights and Forecast - by Deployment
- 5.2.1. On Cloud
- 5.2.2. On-premise
- 5.3. Market Analysis, Insights and Forecast - by Enterprize Size
- 5.3.1. Small and Medium Enterprise (SME)
- 5.3.2. Large Enterprise
- 5.4. Market Analysis, Insights and Forecast - by Region
- 5.4.1. North America
- 5.4.2. Europe
- 5.4.3. Asia Pacific
- 5.4.4. Middle East and Africa
- 5.4.5. South America
- 5.1. Market Analysis, Insights and Forecast - by Solution Type
- 6. Global Pharma Quality Management Software Industry Analysis, Insights and Forecast, 2021-2033
- 6.1. Market Analysis, Insights and Forecast - by Solution Type
- 6.1.1. Correcti
- 6.1.2. Audit Management
- 6.1.3. Document Management
- 6.1.4. Change Management
- 6.1.5. Training Management
- 6.1.6. Complaints Management
- 6.1.7. Regulatory and Compliance Management
- 6.1.8. Non-Conformances Handling
- 6.1.9. Supplier Quality Management
- 6.1.10. Inspection Management
- 6.1.11. Other solution Types
- 6.2. Market Analysis, Insights and Forecast - by Deployment
- 6.2.1. On Cloud
- 6.2.2. On-premise
- 6.3. Market Analysis, Insights and Forecast - by Enterprize Size
- 6.3.1. Small and Medium Enterprise (SME)
- 6.3.2. Large Enterprise
- 6.1. Market Analysis, Insights and Forecast - by Solution Type
- 7. North America Pharma Quality Management Software Industry Analysis, Insights and Forecast, 2020-2032
- 7.1. Market Analysis, Insights and Forecast - by Solution Type
- 7.1.1. Correcti
- 7.1.2. Audit Management
- 7.1.3. Document Management
- 7.1.4. Change Management
- 7.1.5. Training Management
- 7.1.6. Complaints Management
- 7.1.7. Regulatory and Compliance Management
- 7.1.8. Non-Conformances Handling
- 7.1.9. Supplier Quality Management
- 7.1.10. Inspection Management
- 7.1.11. Other solution Types
- 7.2. Market Analysis, Insights and Forecast - by Deployment
- 7.2.1. On Cloud
- 7.2.2. On-premise
- 7.3. Market Analysis, Insights and Forecast - by Enterprize Size
- 7.3.1. Small and Medium Enterprise (SME)
- 7.3.2. Large Enterprise
- 7.1. Market Analysis, Insights and Forecast - by Solution Type
- 8. Europe Pharma Quality Management Software Industry Analysis, Insights and Forecast, 2020-2032
- 8.1. Market Analysis, Insights and Forecast - by Solution Type
- 8.1.1. Correcti
- 8.1.2. Audit Management
- 8.1.3. Document Management
- 8.1.4. Change Management
- 8.1.5. Training Management
- 8.1.6. Complaints Management
- 8.1.7. Regulatory and Compliance Management
- 8.1.8. Non-Conformances Handling
- 8.1.9. Supplier Quality Management
- 8.1.10. Inspection Management
- 8.1.11. Other solution Types
- 8.2. Market Analysis, Insights and Forecast - by Deployment
- 8.2.1. On Cloud
- 8.2.2. On-premise
- 8.3. Market Analysis, Insights and Forecast - by Enterprize Size
- 8.3.1. Small and Medium Enterprise (SME)
- 8.3.2. Large Enterprise
- 8.1. Market Analysis, Insights and Forecast - by Solution Type
- 9. Asia Pacific Pharma Quality Management Software Industry Analysis, Insights and Forecast, 2020-2032
- 9.1. Market Analysis, Insights and Forecast - by Solution Type
- 9.1.1. Correcti
- 9.1.2. Audit Management
- 9.1.3. Document Management
- 9.1.4. Change Management
- 9.1.5. Training Management
- 9.1.6. Complaints Management
- 9.1.7. Regulatory and Compliance Management
- 9.1.8. Non-Conformances Handling
- 9.1.9. Supplier Quality Management
- 9.1.10. Inspection Management
- 9.1.11. Other solution Types
- 9.2. Market Analysis, Insights and Forecast - by Deployment
- 9.2.1. On Cloud
- 9.2.2. On-premise
- 9.3. Market Analysis, Insights and Forecast - by Enterprize Size
- 9.3.1. Small and Medium Enterprise (SME)
- 9.3.2. Large Enterprise
- 9.1. Market Analysis, Insights and Forecast - by Solution Type
- 10. Middle East and Africa Pharma Quality Management Software Industry Analysis, Insights and Forecast, 2020-2032
- 10.1. Market Analysis, Insights and Forecast - by Solution Type
- 10.1.1. Correcti
- 10.1.2. Audit Management
- 10.1.3. Document Management
- 10.1.4. Change Management
- 10.1.5. Training Management
- 10.1.6. Complaints Management
- 10.1.7. Regulatory and Compliance Management
- 10.1.8. Non-Conformances Handling
- 10.1.9. Supplier Quality Management
- 10.1.10. Inspection Management
- 10.1.11. Other solution Types
- 10.2. Market Analysis, Insights and Forecast - by Deployment
- 10.2.1. On Cloud
- 10.2.2. On-premise
- 10.3. Market Analysis, Insights and Forecast - by Enterprize Size
- 10.3.1. Small and Medium Enterprise (SME)
- 10.3.2. Large Enterprise
- 10.1. Market Analysis, Insights and Forecast - by Solution Type
- 11. South America Pharma Quality Management Software Industry Analysis, Insights and Forecast, 2020-2032
- 11.1. Market Analysis, Insights and Forecast - by Solution Type
- 11.1.1. Correcti
- 11.1.2. Audit Management
- 11.1.3. Document Management
- 11.1.4. Change Management
- 11.1.5. Training Management
- 11.1.6. Complaints Management
- 11.1.7. Regulatory and Compliance Management
- 11.1.8. Non-Conformances Handling
- 11.1.9. Supplier Quality Management
- 11.1.10. Inspection Management
- 11.1.11. Other solution Types
- 11.2. Market Analysis, Insights and Forecast - by Deployment
- 11.2.1. On Cloud
- 11.2.2. On-premise
- 11.3. Market Analysis, Insights and Forecast - by Enterprize Size
- 11.3.1. Small and Medium Enterprise (SME)
- 11.3.2. Large Enterprise
- 11.1. Market Analysis, Insights and Forecast - by Solution Type
- 12. Competitive Analysis
- 12.1. Company Profiles
- 12.1.1 Honeywell International Inc
- 12.1.1.1. Company Overview
- 12.1.1.2. Products
- 12.1.1.3. Company Financials
- 12.1.1.4. SWOT Analysis
- 12.1.2 Antares Vision
- 12.1.2.1. Company Overview
- 12.1.2.2. Products
- 12.1.2.3. Company Financials
- 12.1.2.4. SWOT Analysis
- 12.1.3 Qualio
- 12.1.3.1. Company Overview
- 12.1.3.2. Products
- 12.1.3.3. Company Financials
- 12.1.3.4. SWOT Analysis
- 12.1.4 EtQ Management Consultants Inc
- 12.1.4.1. Company Overview
- 12.1.4.2. Products
- 12.1.4.3. Company Financials
- 12.1.4.4. SWOT Analysis
- 12.1.5 Clarivate Plc
- 12.1.5.1. Company Overview
- 12.1.5.2. Products
- 12.1.5.3. Company Financials
- 12.1.5.4. SWOT Analysis
- 12.1.6 AssurX Inc
- 12.1.6.1. Company Overview
- 12.1.6.2. Products
- 12.1.6.3. Company Financials
- 12.1.6.4. SWOT Analysis
- 12.1.7 Veeva Systems Inc
- 12.1.7.1. Company Overview
- 12.1.7.2. Products
- 12.1.7.3. Company Financials
- 12.1.7.4. SWOT Analysis
- 12.1.8 AXSource
- 12.1.8.1. Company Overview
- 12.1.8.2. Products
- 12.1.8.3. Company Financials
- 12.1.8.4. SWOT Analysis
- 12.1.9 IQVIA
- 12.1.9.1. Company Overview
- 12.1.9.2. Products
- 12.1.9.3. Company Financials
- 12.1.9.4. SWOT Analysis
- 12.1.10 Ideagen PLC
- 12.1.10.1. Company Overview
- 12.1.10.2. Products
- 12.1.10.3. Company Financials
- 12.1.10.4. SWOT Analysis
- 12.1.11 ComplianceQuest
- 12.1.11.1. Company Overview
- 12.1.11.2. Products
- 12.1.11.3. Company Financials
- 12.1.11.4. SWOT Analysis
- 12.1.12 Dassault Systemes
- 12.1.12.1. Company Overview
- 12.1.12.2. Products
- 12.1.12.3. Company Financials
- 12.1.12.4. SWOT Analysis
- 12.1.1 Honeywell International Inc
- 12.2. Market Entropy
- 12.2.1 Company's Key Areas Served
- 12.2.2 Recent Developments
- 12.3. Company Market Share Analysis 2025
- 12.3.1 Top 5 Companies Market Share Analysis
- 12.3.2 Top 3 Companies Market Share Analysis
- 12.4. List of Potential Customers
- 13. Research Methodology
List of Figures
- Figure 1: Global Pharma Quality Management Software Industry Revenue Breakdown (billion, %) by Region 2025 & 2033
- Figure 2: Global Pharma Quality Management Software Industry Volume Breakdown (K Unit, %) by Region 2025 & 2033
- Figure 3: North America Pharma Quality Management Software Industry Revenue (billion), by Solution Type 2025 & 2033
- Figure 4: North America Pharma Quality Management Software Industry Volume (K Unit), by Solution Type 2025 & 2033
- Figure 5: North America Pharma Quality Management Software Industry Revenue Share (%), by Solution Type 2025 & 2033
- Figure 6: North America Pharma Quality Management Software Industry Volume Share (%), by Solution Type 2025 & 2033
- Figure 7: North America Pharma Quality Management Software Industry Revenue (billion), by Deployment 2025 & 2033
- Figure 8: North America Pharma Quality Management Software Industry Volume (K Unit), by Deployment 2025 & 2033
- Figure 9: North America Pharma Quality Management Software Industry Revenue Share (%), by Deployment 2025 & 2033
- Figure 10: North America Pharma Quality Management Software Industry Volume Share (%), by Deployment 2025 & 2033
- Figure 11: North America Pharma Quality Management Software Industry Revenue (billion), by Enterprize Size 2025 & 2033
- Figure 12: North America Pharma Quality Management Software Industry Volume (K Unit), by Enterprize Size 2025 & 2033
- Figure 13: North America Pharma Quality Management Software Industry Revenue Share (%), by Enterprize Size 2025 & 2033
- Figure 14: North America Pharma Quality Management Software Industry Volume Share (%), by Enterprize Size 2025 & 2033
- Figure 15: North America Pharma Quality Management Software Industry Revenue (billion), by Country 2025 & 2033
- Figure 16: North America Pharma Quality Management Software Industry Volume (K Unit), by Country 2025 & 2033
- Figure 17: North America Pharma Quality Management Software Industry Revenue Share (%), by Country 2025 & 2033
- Figure 18: North America Pharma Quality Management Software Industry Volume Share (%), by Country 2025 & 2033
- Figure 19: Europe Pharma Quality Management Software Industry Revenue (billion), by Solution Type 2025 & 2033
- Figure 20: Europe Pharma Quality Management Software Industry Volume (K Unit), by Solution Type 2025 & 2033
- Figure 21: Europe Pharma Quality Management Software Industry Revenue Share (%), by Solution Type 2025 & 2033
- Figure 22: Europe Pharma Quality Management Software Industry Volume Share (%), by Solution Type 2025 & 2033
- Figure 23: Europe Pharma Quality Management Software Industry Revenue (billion), by Deployment 2025 & 2033
- Figure 24: Europe Pharma Quality Management Software Industry Volume (K Unit), by Deployment 2025 & 2033
- Figure 25: Europe Pharma Quality Management Software Industry Revenue Share (%), by Deployment 2025 & 2033
- Figure 26: Europe Pharma Quality Management Software Industry Volume Share (%), by Deployment 2025 & 2033
- Figure 27: Europe Pharma Quality Management Software Industry Revenue (billion), by Enterprize Size 2025 & 2033
- Figure 28: Europe Pharma Quality Management Software Industry Volume (K Unit), by Enterprize Size 2025 & 2033
- Figure 29: Europe Pharma Quality Management Software Industry Revenue Share (%), by Enterprize Size 2025 & 2033
- Figure 30: Europe Pharma Quality Management Software Industry Volume Share (%), by Enterprize Size 2025 & 2033
- Figure 31: Europe Pharma Quality Management Software Industry Revenue (billion), by Country 2025 & 2033
- Figure 32: Europe Pharma Quality Management Software Industry Volume (K Unit), by Country 2025 & 2033
- Figure 33: Europe Pharma Quality Management Software Industry Revenue Share (%), by Country 2025 & 2033
- Figure 34: Europe Pharma Quality Management Software Industry Volume Share (%), by Country 2025 & 2033
- Figure 35: Asia Pacific Pharma Quality Management Software Industry Revenue (billion), by Solution Type 2025 & 2033
- Figure 36: Asia Pacific Pharma Quality Management Software Industry Volume (K Unit), by Solution Type 2025 & 2033
- Figure 37: Asia Pacific Pharma Quality Management Software Industry Revenue Share (%), by Solution Type 2025 & 2033
- Figure 38: Asia Pacific Pharma Quality Management Software Industry Volume Share (%), by Solution Type 2025 & 2033
- Figure 39: Asia Pacific Pharma Quality Management Software Industry Revenue (billion), by Deployment 2025 & 2033
- Figure 40: Asia Pacific Pharma Quality Management Software Industry Volume (K Unit), by Deployment 2025 & 2033
- Figure 41: Asia Pacific Pharma Quality Management Software Industry Revenue Share (%), by Deployment 2025 & 2033
- Figure 42: Asia Pacific Pharma Quality Management Software Industry Volume Share (%), by Deployment 2025 & 2033
- Figure 43: Asia Pacific Pharma Quality Management Software Industry Revenue (billion), by Enterprize Size 2025 & 2033
- Figure 44: Asia Pacific Pharma Quality Management Software Industry Volume (K Unit), by Enterprize Size 2025 & 2033
- Figure 45: Asia Pacific Pharma Quality Management Software Industry Revenue Share (%), by Enterprize Size 2025 & 2033
- Figure 46: Asia Pacific Pharma Quality Management Software Industry Volume Share (%), by Enterprize Size 2025 & 2033
- Figure 47: Asia Pacific Pharma Quality Management Software Industry Revenue (billion), by Country 2025 & 2033
- Figure 48: Asia Pacific Pharma Quality Management Software Industry Volume (K Unit), by Country 2025 & 2033
- Figure 49: Asia Pacific Pharma Quality Management Software Industry Revenue Share (%), by Country 2025 & 2033
- Figure 50: Asia Pacific Pharma Quality Management Software Industry Volume Share (%), by Country 2025 & 2033
- Figure 51: Middle East and Africa Pharma Quality Management Software Industry Revenue (billion), by Solution Type 2025 & 2033
- Figure 52: Middle East and Africa Pharma Quality Management Software Industry Volume (K Unit), by Solution Type 2025 & 2033
- Figure 53: Middle East and Africa Pharma Quality Management Software Industry Revenue Share (%), by Solution Type 2025 & 2033
- Figure 54: Middle East and Africa Pharma Quality Management Software Industry Volume Share (%), by Solution Type 2025 & 2033
- Figure 55: Middle East and Africa Pharma Quality Management Software Industry Revenue (billion), by Deployment 2025 & 2033
- Figure 56: Middle East and Africa Pharma Quality Management Software Industry Volume (K Unit), by Deployment 2025 & 2033
- Figure 57: Middle East and Africa Pharma Quality Management Software Industry Revenue Share (%), by Deployment 2025 & 2033
- Figure 58: Middle East and Africa Pharma Quality Management Software Industry Volume Share (%), by Deployment 2025 & 2033
- Figure 59: Middle East and Africa Pharma Quality Management Software Industry Revenue (billion), by Enterprize Size 2025 & 2033
- Figure 60: Middle East and Africa Pharma Quality Management Software Industry Volume (K Unit), by Enterprize Size 2025 & 2033
- Figure 61: Middle East and Africa Pharma Quality Management Software Industry Revenue Share (%), by Enterprize Size 2025 & 2033
- Figure 62: Middle East and Africa Pharma Quality Management Software Industry Volume Share (%), by Enterprize Size 2025 & 2033
- Figure 63: Middle East and Africa Pharma Quality Management Software Industry Revenue (billion), by Country 2025 & 2033
- Figure 64: Middle East and Africa Pharma Quality Management Software Industry Volume (K Unit), by Country 2025 & 2033
- Figure 65: Middle East and Africa Pharma Quality Management Software Industry Revenue Share (%), by Country 2025 & 2033
- Figure 66: Middle East and Africa Pharma Quality Management Software Industry Volume Share (%), by Country 2025 & 2033
- Figure 67: South America Pharma Quality Management Software Industry Revenue (billion), by Solution Type 2025 & 2033
- Figure 68: South America Pharma Quality Management Software Industry Volume (K Unit), by Solution Type 2025 & 2033
- Figure 69: South America Pharma Quality Management Software Industry Revenue Share (%), by Solution Type 2025 & 2033
- Figure 70: South America Pharma Quality Management Software Industry Volume Share (%), by Solution Type 2025 & 2033
- Figure 71: South America Pharma Quality Management Software Industry Revenue (billion), by Deployment 2025 & 2033
- Figure 72: South America Pharma Quality Management Software Industry Volume (K Unit), by Deployment 2025 & 2033
- Figure 73: South America Pharma Quality Management Software Industry Revenue Share (%), by Deployment 2025 & 2033
- Figure 74: South America Pharma Quality Management Software Industry Volume Share (%), by Deployment 2025 & 2033
- Figure 75: South America Pharma Quality Management Software Industry Revenue (billion), by Enterprize Size 2025 & 2033
- Figure 76: South America Pharma Quality Management Software Industry Volume (K Unit), by Enterprize Size 2025 & 2033
- Figure 77: South America Pharma Quality Management Software Industry Revenue Share (%), by Enterprize Size 2025 & 2033
- Figure 78: South America Pharma Quality Management Software Industry Volume Share (%), by Enterprize Size 2025 & 2033
- Figure 79: South America Pharma Quality Management Software Industry Revenue (billion), by Country 2025 & 2033
- Figure 80: South America Pharma Quality Management Software Industry Volume (K Unit), by Country 2025 & 2033
- Figure 81: South America Pharma Quality Management Software Industry Revenue Share (%), by Country 2025 & 2033
- Figure 82: South America Pharma Quality Management Software Industry Volume Share (%), by Country 2025 & 2033
List of Tables
- Table 1: Global Pharma Quality Management Software Industry Revenue billion Forecast, by Solution Type 2020 & 2033
- Table 2: Global Pharma Quality Management Software Industry Volume K Unit Forecast, by Solution Type 2020 & 2033
- Table 3: Global Pharma Quality Management Software Industry Revenue billion Forecast, by Deployment 2020 & 2033
- Table 4: Global Pharma Quality Management Software Industry Volume K Unit Forecast, by Deployment 2020 & 2033
- Table 5: Global Pharma Quality Management Software Industry Revenue billion Forecast, by Enterprize Size 2020 & 2033
- Table 6: Global Pharma Quality Management Software Industry Volume K Unit Forecast, by Enterprize Size 2020 & 2033
- Table 7: Global Pharma Quality Management Software Industry Revenue billion Forecast, by Region 2020 & 2033
- Table 8: Global Pharma Quality Management Software Industry Volume K Unit Forecast, by Region 2020 & 2033
- Table 9: Global Pharma Quality Management Software Industry Revenue billion Forecast, by Solution Type 2020 & 2033
- Table 10: Global Pharma Quality Management Software Industry Volume K Unit Forecast, by Solution Type 2020 & 2033
- Table 11: Global Pharma Quality Management Software Industry Revenue billion Forecast, by Deployment 2020 & 2033
- Table 12: Global Pharma Quality Management Software Industry Volume K Unit Forecast, by Deployment 2020 & 2033
- Table 13: Global Pharma Quality Management Software Industry Revenue billion Forecast, by Enterprize Size 2020 & 2033
- Table 14: Global Pharma Quality Management Software Industry Volume K Unit Forecast, by Enterprize Size 2020 & 2033
- Table 15: Global Pharma Quality Management Software Industry Revenue billion Forecast, by Country 2020 & 2033
- Table 16: Global Pharma Quality Management Software Industry Volume K Unit Forecast, by Country 2020 & 2033
- Table 17: United States Pharma Quality Management Software Industry Revenue (billion) Forecast, by Application 2020 & 2033
- Table 18: United States Pharma Quality Management Software Industry Volume (K Unit) Forecast, by Application 2020 & 2033
- Table 19: Canada Pharma Quality Management Software Industry Revenue (billion) Forecast, by Application 2020 & 2033
- Table 20: Canada Pharma Quality Management Software Industry Volume (K Unit) Forecast, by Application 2020 & 2033
- Table 21: Mexico Pharma Quality Management Software Industry Revenue (billion) Forecast, by Application 2020 & 2033
- Table 22: Mexico Pharma Quality Management Software Industry Volume (K Unit) Forecast, by Application 2020 & 2033
- Table 23: Global Pharma Quality Management Software Industry Revenue billion Forecast, by Solution Type 2020 & 2033
- Table 24: Global Pharma Quality Management Software Industry Volume K Unit Forecast, by Solution Type 2020 & 2033
- Table 25: Global Pharma Quality Management Software Industry Revenue billion Forecast, by Deployment 2020 & 2033
- Table 26: Global Pharma Quality Management Software Industry Volume K Unit Forecast, by Deployment 2020 & 2033
- Table 27: Global Pharma Quality Management Software Industry Revenue billion Forecast, by Enterprize Size 2020 & 2033
- Table 28: Global Pharma Quality Management Software Industry Volume K Unit Forecast, by Enterprize Size 2020 & 2033
- Table 29: Global Pharma Quality Management Software Industry Revenue billion Forecast, by Country 2020 & 2033
- Table 30: Global Pharma Quality Management Software Industry Volume K Unit Forecast, by Country 2020 & 2033
- Table 31: Germany Pharma Quality Management Software Industry Revenue (billion) Forecast, by Application 2020 & 2033
- Table 32: Germany Pharma Quality Management Software Industry Volume (K Unit) Forecast, by Application 2020 & 2033
- Table 33: United Kingdom Pharma Quality Management Software Industry Revenue (billion) Forecast, by Application 2020 & 2033
- Table 34: United Kingdom Pharma Quality Management Software Industry Volume (K Unit) Forecast, by Application 2020 & 2033
- Table 35: France Pharma Quality Management Software Industry Revenue (billion) Forecast, by Application 2020 & 2033
- Table 36: France Pharma Quality Management Software Industry Volume (K Unit) Forecast, by Application 2020 & 2033
- Table 37: Italy Pharma Quality Management Software Industry Revenue (billion) Forecast, by Application 2020 & 2033
- Table 38: Italy Pharma Quality Management Software Industry Volume (K Unit) Forecast, by Application 2020 & 2033
- Table 39: Spain Pharma Quality Management Software Industry Revenue (billion) Forecast, by Application 2020 & 2033
- Table 40: Spain Pharma Quality Management Software Industry Volume (K Unit) Forecast, by Application 2020 & 2033
- Table 41: Rest of Europe Pharma Quality Management Software Industry Revenue (billion) Forecast, by Application 2020 & 2033
- Table 42: Rest of Europe Pharma Quality Management Software Industry Volume (K Unit) Forecast, by Application 2020 & 2033
- Table 43: Global Pharma Quality Management Software Industry Revenue billion Forecast, by Solution Type 2020 & 2033
- Table 44: Global Pharma Quality Management Software Industry Volume K Unit Forecast, by Solution Type 2020 & 2033
- Table 45: Global Pharma Quality Management Software Industry Revenue billion Forecast, by Deployment 2020 & 2033
- Table 46: Global Pharma Quality Management Software Industry Volume K Unit Forecast, by Deployment 2020 & 2033
- Table 47: Global Pharma Quality Management Software Industry Revenue billion Forecast, by Enterprize Size 2020 & 2033
- Table 48: Global Pharma Quality Management Software Industry Volume K Unit Forecast, by Enterprize Size 2020 & 2033
- Table 49: Global Pharma Quality Management Software Industry Revenue billion Forecast, by Country 2020 & 2033
- Table 50: Global Pharma Quality Management Software Industry Volume K Unit Forecast, by Country 2020 & 2033
- Table 51: China Pharma Quality Management Software Industry Revenue (billion) Forecast, by Application 2020 & 2033
- Table 52: China Pharma Quality Management Software Industry Volume (K Unit) Forecast, by Application 2020 & 2033
- Table 53: Japan Pharma Quality Management Software Industry Revenue (billion) Forecast, by Application 2020 & 2033
- Table 54: Japan Pharma Quality Management Software Industry Volume (K Unit) Forecast, by Application 2020 & 2033
- Table 55: India Pharma Quality Management Software Industry Revenue (billion) Forecast, by Application 2020 & 2033
- Table 56: India Pharma Quality Management Software Industry Volume (K Unit) Forecast, by Application 2020 & 2033
- Table 57: Australia Pharma Quality Management Software Industry Revenue (billion) Forecast, by Application 2020 & 2033
- Table 58: Australia Pharma Quality Management Software Industry Volume (K Unit) Forecast, by Application 2020 & 2033
- Table 59: South Korea Pharma Quality Management Software Industry Revenue (billion) Forecast, by Application 2020 & 2033
- Table 60: South Korea Pharma Quality Management Software Industry Volume (K Unit) Forecast, by Application 2020 & 2033
- Table 61: Rest of Asia Pacific Pharma Quality Management Software Industry Revenue (billion) Forecast, by Application 2020 & 2033
- Table 62: Rest of Asia Pacific Pharma Quality Management Software Industry Volume (K Unit) Forecast, by Application 2020 & 2033
- Table 63: Global Pharma Quality Management Software Industry Revenue billion Forecast, by Solution Type 2020 & 2033
- Table 64: Global Pharma Quality Management Software Industry Volume K Unit Forecast, by Solution Type 2020 & 2033
- Table 65: Global Pharma Quality Management Software Industry Revenue billion Forecast, by Deployment 2020 & 2033
- Table 66: Global Pharma Quality Management Software Industry Volume K Unit Forecast, by Deployment 2020 & 2033
- Table 67: Global Pharma Quality Management Software Industry Revenue billion Forecast, by Enterprize Size 2020 & 2033
- Table 68: Global Pharma Quality Management Software Industry Volume K Unit Forecast, by Enterprize Size 2020 & 2033
- Table 69: Global Pharma Quality Management Software Industry Revenue billion Forecast, by Country 2020 & 2033
- Table 70: Global Pharma Quality Management Software Industry Volume K Unit Forecast, by Country 2020 & 2033
- Table 71: GCC Pharma Quality Management Software Industry Revenue (billion) Forecast, by Application 2020 & 2033
- Table 72: GCC Pharma Quality Management Software Industry Volume (K Unit) Forecast, by Application 2020 & 2033
- Table 73: South Africa Pharma Quality Management Software Industry Revenue (billion) Forecast, by Application 2020 & 2033
- Table 74: South Africa Pharma Quality Management Software Industry Volume (K Unit) Forecast, by Application 2020 & 2033
- Table 75: Rest of Middle East and Africa Pharma Quality Management Software Industry Revenue (billion) Forecast, by Application 2020 & 2033
- Table 76: Rest of Middle East and Africa Pharma Quality Management Software Industry Volume (K Unit) Forecast, by Application 2020 & 2033
- Table 77: Global Pharma Quality Management Software Industry Revenue billion Forecast, by Solution Type 2020 & 2033
- Table 78: Global Pharma Quality Management Software Industry Volume K Unit Forecast, by Solution Type 2020 & 2033
- Table 79: Global Pharma Quality Management Software Industry Revenue billion Forecast, by Deployment 2020 & 2033
- Table 80: Global Pharma Quality Management Software Industry Volume K Unit Forecast, by Deployment 2020 & 2033
- Table 81: Global Pharma Quality Management Software Industry Revenue billion Forecast, by Enterprize Size 2020 & 2033
- Table 82: Global Pharma Quality Management Software Industry Volume K Unit Forecast, by Enterprize Size 2020 & 2033
- Table 83: Global Pharma Quality Management Software Industry Revenue billion Forecast, by Country 2020 & 2033
- Table 84: Global Pharma Quality Management Software Industry Volume K Unit Forecast, by Country 2020 & 2033
- Table 85: Brazil Pharma Quality Management Software Industry Revenue (billion) Forecast, by Application 2020 & 2033
- Table 86: Brazil Pharma Quality Management Software Industry Volume (K Unit) Forecast, by Application 2020 & 2033
- Table 87: Argentina Pharma Quality Management Software Industry Revenue (billion) Forecast, by Application 2020 & 2033
- Table 88: Argentina Pharma Quality Management Software Industry Volume (K Unit) Forecast, by Application 2020 & 2033
- Table 89: Rest of South America Pharma Quality Management Software Industry Revenue (billion) Forecast, by Application 2020 & 2033
- Table 90: Rest of South America Pharma Quality Management Software Industry Volume (K Unit) Forecast, by Application 2020 & 2033
Frequently Asked Questions
1. What is the projected Compound Annual Growth Rate (CAGR) of the Pharma Quality Management Software Industry?
The projected CAGR is approximately 11.62%.
2. Which companies are prominent players in the Pharma Quality Management Software Industry?
Key companies in the market include Honeywell International Inc, Antares Vision, Qualio, EtQ Management Consultants Inc, Clarivate Plc, AssurX Inc, Veeva Systems Inc, AXSource, IQVIA, Ideagen PLC, ComplianceQuest, Dassault Systemes.
3. What are the main segments of the Pharma Quality Management Software Industry?
The market segments include Solution Type, Deployment, Enterprize Size.
4. Can you provide details about the market size?
The market size is estimated to be USD 3.32 billion as of 2022.
5. What are some drivers contributing to market growth?
Increasing Cost of Drugs Manufacturing; Growing Technology Adoption in Pharmaceutical Industry.
6. What are the notable trends driving market growth?
Regulatory and Compliance Management Segment is Expected to Hold Significant Market Share Over the Forecast Period.
7. Are there any restraints impacting market growth?
Security Concerns Pertaining to On-Cloud Deployment; Lack of Regulations for Pharmaceutical Quality Management Software.
8. Can you provide examples of recent developments in the market?
January 2023: Palantir Technologies Inc. launched a fit-for-purpose Quality Management System to help its life sciences customers using the Foundry platform meet GxP requirements.
9. What pricing options are available for accessing the report?
Pricing options include single-user, multi-user, and enterprise licenses priced at USD 4750, USD 5250, and USD 8750 respectively.
10. Is the market size provided in terms of value or volume?
The market size is provided in terms of value, measured in billion and volume, measured in K Unit.
11. Are there any specific market keywords associated with the report?
Yes, the market keyword associated with the report is "Pharma Quality Management Software Industry," which aids in identifying and referencing the specific market segment covered.
12. How do I determine which pricing option suits my needs best?
The pricing options vary based on user requirements and access needs. Individual users may opt for single-user licenses, while businesses requiring broader access may choose multi-user or enterprise licenses for cost-effective access to the report.
13. Are there any additional resources or data provided in the Pharma Quality Management Software Industry report?
While the report offers comprehensive insights, it's advisable to review the specific contents or supplementary materials provided to ascertain if additional resources or data are available.
14. How can I stay updated on further developments or reports in the Pharma Quality Management Software Industry?
To stay informed about further developments, trends, and reports in the Pharma Quality Management Software Industry, consider subscribing to industry newsletters, following relevant companies and organizations, or regularly checking reputable industry news sources and publications.
Methodology
Step 1 - Identification of Relevant Samples Size from Population Database


Step 2 - Approaches for Defining Global Market Size (Value, Volume* & Price*)

Note*: In applicable scenarios
Step 3 - Data Sources
Primary Research
- Web Analytics
- Survey Reports
- Research Institute
- Latest Research Reports
- Opinion Leaders
Secondary Research
- Annual Reports
- White Paper
- Latest Press Release
- Industry Association
- Paid Database
- Investor Presentations

Step 4 - Data Triangulation
Involves using different sources of information in order to increase the validity of a study
These sources are likely to be stakeholders in a program - participants, other researchers, program staff, other community members, and so on.
Then we put all data in single framework & apply various statistical tools to find out the dynamic on the market.
During the analysis stage, feedback from the stakeholder groups would be compared to determine areas of agreement as well as areas of divergence