

Key Insights
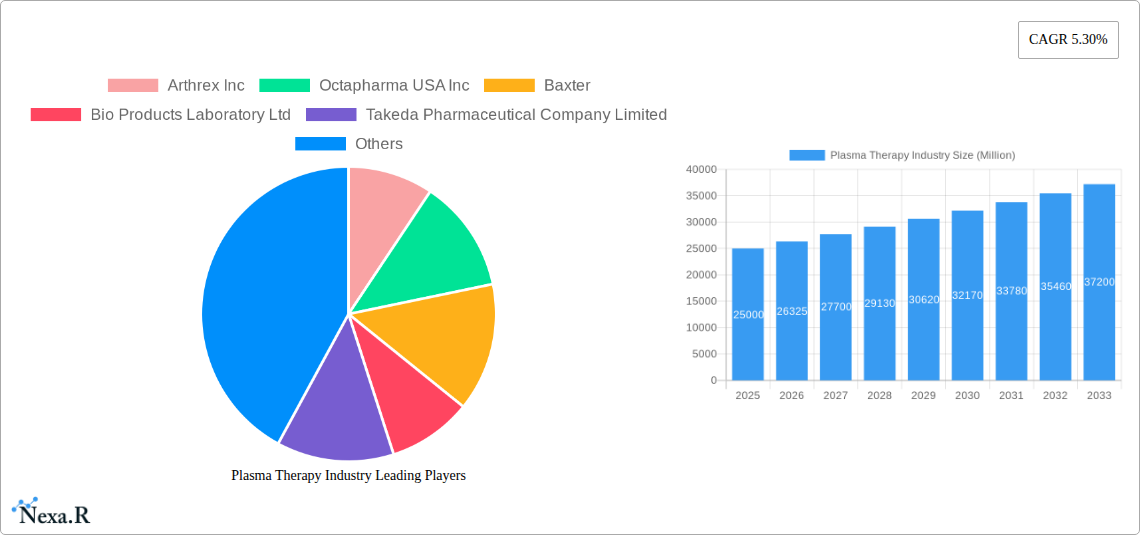
The plasma therapy market, valued at approximately $XX million in 2025, is projected to experience robust growth, driven by a Compound Annual Growth Rate (CAGR) of 5.30% from 2025 to 2033. This expansion is fueled by several key factors. The rising prevalence of bleeding disorders like hemophilia and immune deficiencies, coupled with an aging global population requiring increased plasma-derived therapies, significantly contributes to market growth. Technological advancements in plasma fractionation and purification processes are leading to safer and more effective treatments, further boosting demand. Furthermore, increasing government initiatives to support blood donation drives and the growing awareness of plasma-derived therapies among healthcare professionals are positively influencing market dynamics. Significant investments in research and development by major players are also accelerating the introduction of innovative therapies.
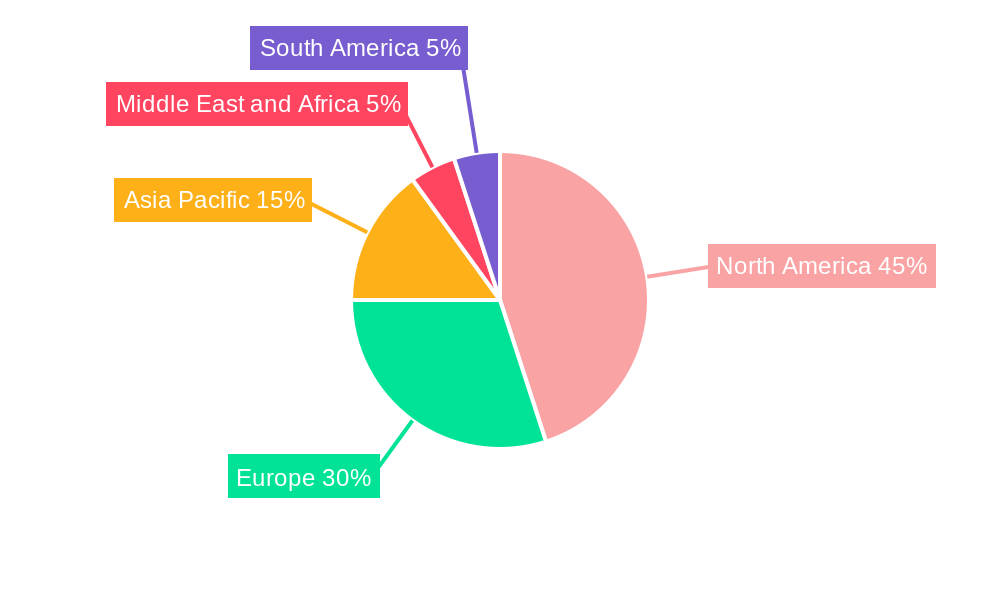
However, market growth is not without its challenges. The high cost of plasma-derived therapies, stringent regulatory approvals, and potential risks associated with blood-borne diseases pose significant restraints. Furthermore, the market is characterized by intense competition among established players, requiring continuous innovation and strategic partnerships to maintain market share. Despite these challenges, the long-term outlook for the plasma therapy market remains positive, with promising growth anticipated across various segments and regions. The North American region, due to its advanced healthcare infrastructure and high prevalence of target diseases, is expected to retain a significant market share, although growth in emerging economies like those in Asia Pacific is also anticipated to be significant, driven by increasing healthcare spending and a growing middle class. The segments showing the most potential are immunoglobulin and albumin, driven by their wide-ranging therapeutic applications.
Plasma Therapy Industry Market Report: 2019-2033
This comprehensive report provides a detailed analysis of the Plasma Therapy industry, encompassing market dynamics, growth trends, regional insights, product landscape, and key players. The study period covers 2019-2033, with a base year of 2025 and a forecast period of 2025-2033. The report utilizes both qualitative and quantitative data to offer a holistic view of this vital sector, targeting industry professionals, investors, and researchers seeking in-depth market intelligence. Market values are presented in Million units.
Plasma Therapy Industry Market Dynamics & Structure
The Plasma Therapy market, a vital segment within the broader Biopharmaceutical industry, is characterized by a moderately concentrated structure, with a few major players holding significant market share. Technological innovation, particularly in plasma fractionation and purification techniques, is a key growth driver. Stringent regulatory frameworks, varying across geographies, significantly influence market access and product approval timelines. Competition arises from both established players and emerging companies, along with potential substitutes like recombinant therapies. End-user demographics, including the aging population and increasing prevalence of chronic diseases, further shape market demand. M&A activity within the sector is notably active, reflecting consolidation and expansion strategies of leading companies.
- Market Concentration: Highly concentrated, with the top 5 players accounting for approximately xx% of the global market in 2024.
- Technological Innovation: Focus on automation, improved purification methods, and the development of novel plasma-derived therapies.
- Regulatory Landscape: Stringent regulations and approval processes vary across regions, impacting market entry and product availability.
- Competitive Substitutes: Recombinant therapies and other alternatives pose competitive pressures.
- End-User Demographics: Aging population and rising incidence of diseases like Hemophilia and Immunodeficiencies are key demand drivers.
- M&A Activity: Significant M&A activity observed over the past 5 years, with xx major deals concluded.
Plasma Therapy Industry Growth Trends & Insights
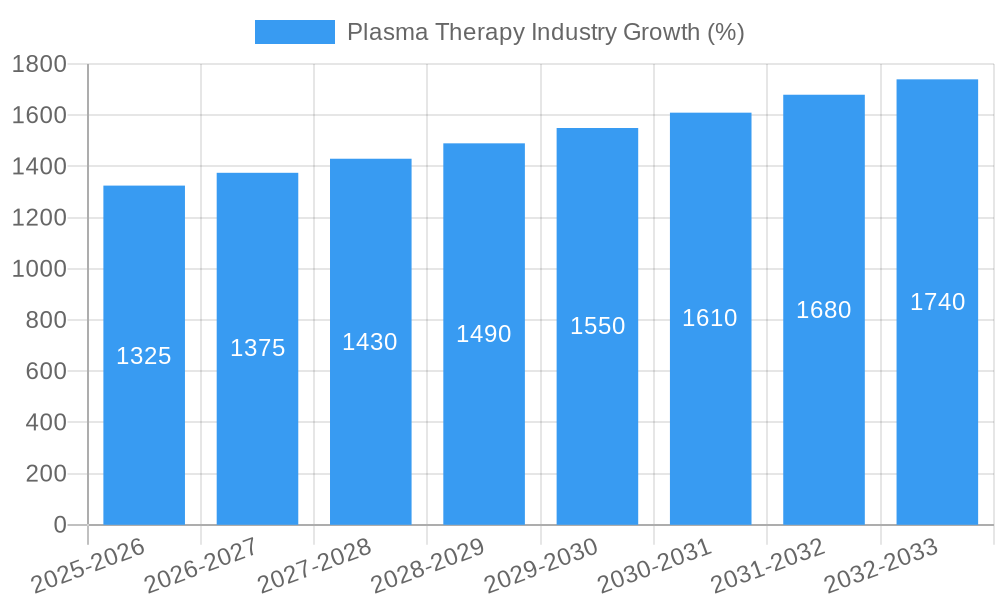
The global plasma therapy market has experienced consistent growth over the past five years (2019-2024), expanding from xx Million units in 2019 to xx Million units in 2024. This growth is primarily fueled by factors such as the increasing prevalence of chronic diseases requiring plasma-derived therapies, technological advancements resulting in improved product efficacy and safety, and growing investment in research and development. The market is projected to continue its upward trajectory, with a Compound Annual Growth Rate (CAGR) of xx% during the forecast period (2025-2033), reaching an estimated xx Million units by 2033. Adoption rates are increasing in both developed and developing nations, driven by enhanced healthcare infrastructure and improved access to plasma-based treatments. The emergence of personalized medicine and tailored therapies further contributes to market expansion. Technological disruptions, such as the introduction of next-generation plasma collection systems, are streamlining the donation process and improving efficiency.
Dominant Regions, Countries, or Segments in Plasma Therapy Industry
North America currently holds the largest market share in the plasma therapy industry, followed by Europe. Within these regions, the United States and Germany are key drivers of growth. High healthcare expenditure, advanced medical infrastructure, and a larger patient pool contribute to the dominance of these regions.
By Product:
- Immunoglobulin: This segment holds the largest market share due to its wide range of applications and high demand.
- Albumin: Strong growth is expected, driven by increasing albumin demand in various medical applications.
- Plasma-Derived Factor VIII: Significant growth is anticipated due to its critical role in treating Hemophilia A.
- Other Products: This segment encompasses various other plasma-derived products, exhibiting steady growth with the development of new applications.
By Application:
- Hemophilia: This application segment dominates due to its large patient population and significant need for Factor VIII and other therapies.
- Idiopathic Thrombocytopenic Purpura (ITP): A steadily growing market segment due to increased awareness and better treatment options.
- Primary Immunodeficiencies: This segment is expected to grow gradually due to the rising prevalence of these conditions.
- Other Applications: A diverse range of applications including burns, liver diseases and others contributes to this segment's growth.
Plasma Therapy Industry Product Landscape
The plasma therapy product landscape features various innovative products, including next-generation immunoglobulin formulations, advanced albumin solutions, and highly purified clotting factors. These products offer enhanced efficacy, reduced side effects, and improved patient outcomes. Technological advancements such as improved fractionation techniques and advanced purification methods lead to higher purity and better safety profiles. Unique selling propositions often focus on convenience, improved efficacy, and reduced adverse reactions.
Key Drivers, Barriers & Challenges in Plasma Therapy Industry
Key Drivers:
- Increasing prevalence of chronic diseases requiring plasma-based therapies.
- Technological advancements resulting in improved product efficacy and safety.
- Growing investment in research and development.
- Favorable regulatory environments in several key markets.
Challenges & Restraints:
- High cost of production and treatment limits accessibility in certain regions.
- Stringent regulatory requirements, varying across countries, impacting product approval timelines and market access.
- Potential safety concerns and adverse reactions, requiring constant monitoring and improvement.
- Dependence on plasma donations, facing fluctuations in supply due to various factors (donor availability, collection processes, etc.)
Emerging Opportunities in Plasma Therapy Industry
Untapped markets in emerging economies present significant growth opportunities. The development of novel plasma-derived therapies to address unmet medical needs is another key opportunity. Moreover, focusing on personalized medicine to cater to individual patient needs presents a significant future prospect for the market.
Growth Accelerators in the Plasma Therapy Industry
Technological breakthroughs in plasma fractionation and purification are key growth accelerators. Strategic partnerships between manufacturers and healthcare providers improve market access and distribution. Expanding into new geographical markets and tapping into emerging economies present promising avenues for growth.
Key Players Shaping the Plasma Therapy Industry Market
- Arthrex Inc
- Octapharma USA Inc
- Baxter
- Bio Products Laboratory Ltd
- Takeda Pharmaceutical Company Limited
- CSL Limited
- ADMA Biologics Inc
- Taibang Biological Group Co Ltd
- Grifols S A
- Johnson and Johnson (DePuy Synthes)
- Biotest UK
- Kedrion S p A
Notable Milestones in Plasma Therapy Industry Sector
- October 2022: Grifols inaugurated a new manufacturing plant in Ireland, tripling its albumin filling capacity.
- March 2022: The FDA cleared Terumo BCT's Rika Plasma Donation System, enhancing plasma collection efficiency.
In-Depth Plasma Therapy Industry Market Outlook
The plasma therapy market is poised for sustained growth, driven by technological innovation, expanding treatment applications, and an increasing patient population. Strategic investments in R&D, coupled with collaborations across the value chain, will further enhance market penetration. Opportunities abound in personalized medicine, developing novel therapies, and expanding into emerging markets. The future outlook is optimistic, suggesting considerable potential for growth and innovation within the plasma therapy industry.
Plasma Therapy Industry Segmentation
-
1. Product
- 1.1. Immunoglobulin
- 1.2. Albumin
- 1.3. Plasma Derived Factor VIII
- 1.4. Other Products
-
2. Application
- 2.1. Hemophilia
- 2.2. Idiopathic Thrombocytopenic Purpura
- 2.3. Primary Immunodeficiencies
- 2.4. Other Applications
Plasma Therapy Industry Segmentation By Geography
-
1. North America
- 1.1. United States
- 1.2. Canada
- 1.3. Mexico
-
2. Europe
- 2.1. Germany
- 2.2. United Kingdom
- 2.3. France
- 2.4. Italy
- 2.5. Spain
- 2.6. Rest of Europe
-
3. Asia Pacific
- 3.1. China
- 3.2. Japan
- 3.3. India
- 3.4. Australia
- 3.5. South Korea
- 3.6. Rest of Asia Pacific
-
4. Middle East and Africa
- 4.1. GCC
- 4.2. South Africa
- 4.3. Rest of Middle East and Africa
-
5. South America
- 5.1. Brazil
- 5.2. Argentina
- 5.3. Rest of South America
Plasma Therapy Industry REPORT HIGHLIGHTS
| Aspects | Details |
|---|---|
| Study Period | 2019-2033 |
| Base Year | 2024 |
| Estimated Year | 2025 |
| Forecast Period | 2025-2033 |
| Historical Period | 2019-2024 |
| Growth Rate | CAGR of 5.30% from 2019-2033 |
| Segmentation |
|
Table of Contents
- 1. Introduction
- 1.1. Research Scope
- 1.2. Market Segmentation
- 1.3. Research Methodology
- 1.4. Definitions and Assumptions
- 2. Executive Summary
- 2.1. Introduction
- 3. Market Dynamics
- 3.1. Introduction
- 3.2. Market Drivers
- 3.2.1. Increasing Incidence of Autoimmune and Neurological Diseases; Rise in Research & Development in Plasma Protein
- 3.3. Market Restrains
- 3.3.1. Strict Regulations for the Handling of Plasma Protein Products
- 3.4. Market Trends
- 3.4.1. Hemophilia Segment is Expected to Witness a Growth in the Plasma Protein Therapeutics Market Over the Forecast Period
- 4. Market Factor Analysis
- 4.1. Porters Five Forces
- 4.2. Supply/Value Chain
- 4.3. PESTEL analysis
- 4.4. Market Entropy
- 4.5. Patent/Trademark Analysis
- 5. Global Plasma Therapy Industry Analysis, Insights and Forecast, 2019-2031
- 5.1. Market Analysis, Insights and Forecast - by Product
- 5.1.1. Immunoglobulin
- 5.1.2. Albumin
- 5.1.3. Plasma Derived Factor VIII
- 5.1.4. Other Products
- 5.2. Market Analysis, Insights and Forecast - by Application
- 5.2.1. Hemophilia
- 5.2.2. Idiopathic Thrombocytopenic Purpura
- 5.2.3. Primary Immunodeficiencies
- 5.2.4. Other Applications
- 5.3. Market Analysis, Insights and Forecast - by Region
- 5.3.1. North America
- 5.3.2. Europe
- 5.3.3. Asia Pacific
- 5.3.4. Middle East and Africa
- 5.3.5. South America
- 5.1. Market Analysis, Insights and Forecast - by Product
- 6. North America Plasma Therapy Industry Analysis, Insights and Forecast, 2019-2031
- 6.1. Market Analysis, Insights and Forecast - by Product
- 6.1.1. Immunoglobulin
- 6.1.2. Albumin
- 6.1.3. Plasma Derived Factor VIII
- 6.1.4. Other Products
- 6.2. Market Analysis, Insights and Forecast - by Application
- 6.2.1. Hemophilia
- 6.2.2. Idiopathic Thrombocytopenic Purpura
- 6.2.3. Primary Immunodeficiencies
- 6.2.4. Other Applications
- 6.1. Market Analysis, Insights and Forecast - by Product
- 7. Europe Plasma Therapy Industry Analysis, Insights and Forecast, 2019-2031
- 7.1. Market Analysis, Insights and Forecast - by Product
- 7.1.1. Immunoglobulin
- 7.1.2. Albumin
- 7.1.3. Plasma Derived Factor VIII
- 7.1.4. Other Products
- 7.2. Market Analysis, Insights and Forecast - by Application
- 7.2.1. Hemophilia
- 7.2.2. Idiopathic Thrombocytopenic Purpura
- 7.2.3. Primary Immunodeficiencies
- 7.2.4. Other Applications
- 7.1. Market Analysis, Insights and Forecast - by Product
- 8. Asia Pacific Plasma Therapy Industry Analysis, Insights and Forecast, 2019-2031
- 8.1. Market Analysis, Insights and Forecast - by Product
- 8.1.1. Immunoglobulin
- 8.1.2. Albumin
- 8.1.3. Plasma Derived Factor VIII
- 8.1.4. Other Products
- 8.2. Market Analysis, Insights and Forecast - by Application
- 8.2.1. Hemophilia
- 8.2.2. Idiopathic Thrombocytopenic Purpura
- 8.2.3. Primary Immunodeficiencies
- 8.2.4. Other Applications
- 8.1. Market Analysis, Insights and Forecast - by Product
- 9. Middle East and Africa Plasma Therapy Industry Analysis, Insights and Forecast, 2019-2031
- 9.1. Market Analysis, Insights and Forecast - by Product
- 9.1.1. Immunoglobulin
- 9.1.2. Albumin
- 9.1.3. Plasma Derived Factor VIII
- 9.1.4. Other Products
- 9.2. Market Analysis, Insights and Forecast - by Application
- 9.2.1. Hemophilia
- 9.2.2. Idiopathic Thrombocytopenic Purpura
- 9.2.3. Primary Immunodeficiencies
- 9.2.4. Other Applications
- 9.1. Market Analysis, Insights and Forecast - by Product
- 10. South America Plasma Therapy Industry Analysis, Insights and Forecast, 2019-2031
- 10.1. Market Analysis, Insights and Forecast - by Product
- 10.1.1. Immunoglobulin
- 10.1.2. Albumin
- 10.1.3. Plasma Derived Factor VIII
- 10.1.4. Other Products
- 10.2. Market Analysis, Insights and Forecast - by Application
- 10.2.1. Hemophilia
- 10.2.2. Idiopathic Thrombocytopenic Purpura
- 10.2.3. Primary Immunodeficiencies
- 10.2.4. Other Applications
- 10.1. Market Analysis, Insights and Forecast - by Product
- 11. North America Plasma Therapy Industry Analysis, Insights and Forecast, 2019-2031
- 11.1. Market Analysis, Insights and Forecast - By Country/Sub-region
- 11.1.1 United States
- 11.1.2 Canada
- 11.1.3 Mexico
- 12. Europe Plasma Therapy Industry Analysis, Insights and Forecast, 2019-2031
- 12.1. Market Analysis, Insights and Forecast - By Country/Sub-region
- 12.1.1 Germany
- 12.1.2 United Kingdom
- 12.1.3 France
- 12.1.4 Italy
- 12.1.5 Spain
- 12.1.6 Rest of Europe
- 13. Asia Pacific Plasma Therapy Industry Analysis, Insights and Forecast, 2019-2031
- 13.1. Market Analysis, Insights and Forecast - By Country/Sub-region
- 13.1.1 China
- 13.1.2 Japan
- 13.1.3 India
- 13.1.4 Australia
- 13.1.5 South Korea
- 13.1.6 Rest of Asia Pacific
- 14. Middle East and Africa Plasma Therapy Industry Analysis, Insights and Forecast, 2019-2031
- 14.1. Market Analysis, Insights and Forecast - By Country/Sub-region
- 14.1.1 GCC
- 14.1.2 South Africa
- 14.1.3 Rest of Middle East and Africa
- 15. South America Plasma Therapy Industry Analysis, Insights and Forecast, 2019-2031
- 15.1. Market Analysis, Insights and Forecast - By Country/Sub-region
- 15.1.1 Brazil
- 15.1.2 Argentina
- 15.1.3 Rest of South America
- 16. Competitive Analysis
- 16.1. Global Market Share Analysis 2024
- 16.2. Company Profiles
- 16.2.1 Arthrex Inc
- 16.2.1.1. Overview
- 16.2.1.2. Products
- 16.2.1.3. SWOT Analysis
- 16.2.1.4. Recent Developments
- 16.2.1.5. Financials (Based on Availability)
- 16.2.2 Octapharma USA Inc
- 16.2.2.1. Overview
- 16.2.2.2. Products
- 16.2.2.3. SWOT Analysis
- 16.2.2.4. Recent Developments
- 16.2.2.5. Financials (Based on Availability)
- 16.2.3 Baxter
- 16.2.3.1. Overview
- 16.2.3.2. Products
- 16.2.3.3. SWOT Analysis
- 16.2.3.4. Recent Developments
- 16.2.3.5. Financials (Based on Availability)
- 16.2.4 Bio Products Laboratory Ltd
- 16.2.4.1. Overview
- 16.2.4.2. Products
- 16.2.4.3. SWOT Analysis
- 16.2.4.4. Recent Developments
- 16.2.4.5. Financials (Based on Availability)
- 16.2.5 Takeda Pharmaceutical Company Limited
- 16.2.5.1. Overview
- 16.2.5.2. Products
- 16.2.5.3. SWOT Analysis
- 16.2.5.4. Recent Developments
- 16.2.5.5. Financials (Based on Availability)
- 16.2.6 CSL Limited
- 16.2.6.1. Overview
- 16.2.6.2. Products
- 16.2.6.3. SWOT Analysis
- 16.2.6.4. Recent Developments
- 16.2.6.5. Financials (Based on Availability)
- 16.2.7 ADMA Biologics Inc
- 16.2.7.1. Overview
- 16.2.7.2. Products
- 16.2.7.3. SWOT Analysis
- 16.2.7.4. Recent Developments
- 16.2.7.5. Financials (Based on Availability)
- 16.2.8 Taibang Biological Group Co Ltd
- 16.2.8.1. Overview
- 16.2.8.2. Products
- 16.2.8.3. SWOT Analysis
- 16.2.8.4. Recent Developments
- 16.2.8.5. Financials (Based on Availability)
- 16.2.9 Grifols S A
- 16.2.9.1. Overview
- 16.2.9.2. Products
- 16.2.9.3. SWOT Analysis
- 16.2.9.4. Recent Developments
- 16.2.9.5. Financials (Based on Availability)
- 16.2.10 Johnson and Johnson (DePuy Synthes)
- 16.2.10.1. Overview
- 16.2.10.2. Products
- 16.2.10.3. SWOT Analysis
- 16.2.10.4. Recent Developments
- 16.2.10.5. Financials (Based on Availability)
- 16.2.11 Biotest UK
- 16.2.11.1. Overview
- 16.2.11.2. Products
- 16.2.11.3. SWOT Analysis
- 16.2.11.4. Recent Developments
- 16.2.11.5. Financials (Based on Availability)
- 16.2.12 Kedrion S p A
- 16.2.12.1. Overview
- 16.2.12.2. Products
- 16.2.12.3. SWOT Analysis
- 16.2.12.4. Recent Developments
- 16.2.12.5. Financials (Based on Availability)
- 16.2.1 Arthrex Inc
List of Figures
- Figure 1: Global Plasma Therapy Industry Revenue Breakdown (Million, %) by Region 2024 & 2032
- Figure 2: Global Plasma Therapy Industry Volume Breakdown (K Unit, %) by Region 2024 & 2032
- Figure 3: North America Plasma Therapy Industry Revenue (Million), by Country 2024 & 2032
- Figure 4: North America Plasma Therapy Industry Volume (K Unit), by Country 2024 & 2032
- Figure 5: North America Plasma Therapy Industry Revenue Share (%), by Country 2024 & 2032
- Figure 6: North America Plasma Therapy Industry Volume Share (%), by Country 2024 & 2032
- Figure 7: Europe Plasma Therapy Industry Revenue (Million), by Country 2024 & 2032
- Figure 8: Europe Plasma Therapy Industry Volume (K Unit), by Country 2024 & 2032
- Figure 9: Europe Plasma Therapy Industry Revenue Share (%), by Country 2024 & 2032
- Figure 10: Europe Plasma Therapy Industry Volume Share (%), by Country 2024 & 2032
- Figure 11: Asia Pacific Plasma Therapy Industry Revenue (Million), by Country 2024 & 2032
- Figure 12: Asia Pacific Plasma Therapy Industry Volume (K Unit), by Country 2024 & 2032
- Figure 13: Asia Pacific Plasma Therapy Industry Revenue Share (%), by Country 2024 & 2032
- Figure 14: Asia Pacific Plasma Therapy Industry Volume Share (%), by Country 2024 & 2032
- Figure 15: Middle East and Africa Plasma Therapy Industry Revenue (Million), by Country 2024 & 2032
- Figure 16: Middle East and Africa Plasma Therapy Industry Volume (K Unit), by Country 2024 & 2032
- Figure 17: Middle East and Africa Plasma Therapy Industry Revenue Share (%), by Country 2024 & 2032
- Figure 18: Middle East and Africa Plasma Therapy Industry Volume Share (%), by Country 2024 & 2032
- Figure 19: South America Plasma Therapy Industry Revenue (Million), by Country 2024 & 2032
- Figure 20: South America Plasma Therapy Industry Volume (K Unit), by Country 2024 & 2032
- Figure 21: South America Plasma Therapy Industry Revenue Share (%), by Country 2024 & 2032
- Figure 22: South America Plasma Therapy Industry Volume Share (%), by Country 2024 & 2032
- Figure 23: North America Plasma Therapy Industry Revenue (Million), by Product 2024 & 2032
- Figure 24: North America Plasma Therapy Industry Volume (K Unit), by Product 2024 & 2032
- Figure 25: North America Plasma Therapy Industry Revenue Share (%), by Product 2024 & 2032
- Figure 26: North America Plasma Therapy Industry Volume Share (%), by Product 2024 & 2032
- Figure 27: North America Plasma Therapy Industry Revenue (Million), by Application 2024 & 2032
- Figure 28: North America Plasma Therapy Industry Volume (K Unit), by Application 2024 & 2032
- Figure 29: North America Plasma Therapy Industry Revenue Share (%), by Application 2024 & 2032
- Figure 30: North America Plasma Therapy Industry Volume Share (%), by Application 2024 & 2032
- Figure 31: North America Plasma Therapy Industry Revenue (Million), by Country 2024 & 2032
- Figure 32: North America Plasma Therapy Industry Volume (K Unit), by Country 2024 & 2032
- Figure 33: North America Plasma Therapy Industry Revenue Share (%), by Country 2024 & 2032
- Figure 34: North America Plasma Therapy Industry Volume Share (%), by Country 2024 & 2032
- Figure 35: Europe Plasma Therapy Industry Revenue (Million), by Product 2024 & 2032
- Figure 36: Europe Plasma Therapy Industry Volume (K Unit), by Product 2024 & 2032
- Figure 37: Europe Plasma Therapy Industry Revenue Share (%), by Product 2024 & 2032
- Figure 38: Europe Plasma Therapy Industry Volume Share (%), by Product 2024 & 2032
- Figure 39: Europe Plasma Therapy Industry Revenue (Million), by Application 2024 & 2032
- Figure 40: Europe Plasma Therapy Industry Volume (K Unit), by Application 2024 & 2032
- Figure 41: Europe Plasma Therapy Industry Revenue Share (%), by Application 2024 & 2032
- Figure 42: Europe Plasma Therapy Industry Volume Share (%), by Application 2024 & 2032
- Figure 43: Europe Plasma Therapy Industry Revenue (Million), by Country 2024 & 2032
- Figure 44: Europe Plasma Therapy Industry Volume (K Unit), by Country 2024 & 2032
- Figure 45: Europe Plasma Therapy Industry Revenue Share (%), by Country 2024 & 2032
- Figure 46: Europe Plasma Therapy Industry Volume Share (%), by Country 2024 & 2032
- Figure 47: Asia Pacific Plasma Therapy Industry Revenue (Million), by Product 2024 & 2032
- Figure 48: Asia Pacific Plasma Therapy Industry Volume (K Unit), by Product 2024 & 2032
- Figure 49: Asia Pacific Plasma Therapy Industry Revenue Share (%), by Product 2024 & 2032
- Figure 50: Asia Pacific Plasma Therapy Industry Volume Share (%), by Product 2024 & 2032
- Figure 51: Asia Pacific Plasma Therapy Industry Revenue (Million), by Application 2024 & 2032
- Figure 52: Asia Pacific Plasma Therapy Industry Volume (K Unit), by Application 2024 & 2032
- Figure 53: Asia Pacific Plasma Therapy Industry Revenue Share (%), by Application 2024 & 2032
- Figure 54: Asia Pacific Plasma Therapy Industry Volume Share (%), by Application 2024 & 2032
- Figure 55: Asia Pacific Plasma Therapy Industry Revenue (Million), by Country 2024 & 2032
- Figure 56: Asia Pacific Plasma Therapy Industry Volume (K Unit), by Country 2024 & 2032
- Figure 57: Asia Pacific Plasma Therapy Industry Revenue Share (%), by Country 2024 & 2032
- Figure 58: Asia Pacific Plasma Therapy Industry Volume Share (%), by Country 2024 & 2032
- Figure 59: Middle East and Africa Plasma Therapy Industry Revenue (Million), by Product 2024 & 2032
- Figure 60: Middle East and Africa Plasma Therapy Industry Volume (K Unit), by Product 2024 & 2032
- Figure 61: Middle East and Africa Plasma Therapy Industry Revenue Share (%), by Product 2024 & 2032
- Figure 62: Middle East and Africa Plasma Therapy Industry Volume Share (%), by Product 2024 & 2032
- Figure 63: Middle East and Africa Plasma Therapy Industry Revenue (Million), by Application 2024 & 2032
- Figure 64: Middle East and Africa Plasma Therapy Industry Volume (K Unit), by Application 2024 & 2032
- Figure 65: Middle East and Africa Plasma Therapy Industry Revenue Share (%), by Application 2024 & 2032
- Figure 66: Middle East and Africa Plasma Therapy Industry Volume Share (%), by Application 2024 & 2032
- Figure 67: Middle East and Africa Plasma Therapy Industry Revenue (Million), by Country 2024 & 2032
- Figure 68: Middle East and Africa Plasma Therapy Industry Volume (K Unit), by Country 2024 & 2032
- Figure 69: Middle East and Africa Plasma Therapy Industry Revenue Share (%), by Country 2024 & 2032
- Figure 70: Middle East and Africa Plasma Therapy Industry Volume Share (%), by Country 2024 & 2032
- Figure 71: South America Plasma Therapy Industry Revenue (Million), by Product 2024 & 2032
- Figure 72: South America Plasma Therapy Industry Volume (K Unit), by Product 2024 & 2032
- Figure 73: South America Plasma Therapy Industry Revenue Share (%), by Product 2024 & 2032
- Figure 74: South America Plasma Therapy Industry Volume Share (%), by Product 2024 & 2032
- Figure 75: South America Plasma Therapy Industry Revenue (Million), by Application 2024 & 2032
- Figure 76: South America Plasma Therapy Industry Volume (K Unit), by Application 2024 & 2032
- Figure 77: South America Plasma Therapy Industry Revenue Share (%), by Application 2024 & 2032
- Figure 78: South America Plasma Therapy Industry Volume Share (%), by Application 2024 & 2032
- Figure 79: South America Plasma Therapy Industry Revenue (Million), by Country 2024 & 2032
- Figure 80: South America Plasma Therapy Industry Volume (K Unit), by Country 2024 & 2032
- Figure 81: South America Plasma Therapy Industry Revenue Share (%), by Country 2024 & 2032
- Figure 82: South America Plasma Therapy Industry Volume Share (%), by Country 2024 & 2032
List of Tables
- Table 1: Global Plasma Therapy Industry Revenue Million Forecast, by Region 2019 & 2032
- Table 2: Global Plasma Therapy Industry Volume K Unit Forecast, by Region 2019 & 2032
- Table 3: Global Plasma Therapy Industry Revenue Million Forecast, by Product 2019 & 2032
- Table 4: Global Plasma Therapy Industry Volume K Unit Forecast, by Product 2019 & 2032
- Table 5: Global Plasma Therapy Industry Revenue Million Forecast, by Application 2019 & 2032
- Table 6: Global Plasma Therapy Industry Volume K Unit Forecast, by Application 2019 & 2032
- Table 7: Global Plasma Therapy Industry Revenue Million Forecast, by Region 2019 & 2032
- Table 8: Global Plasma Therapy Industry Volume K Unit Forecast, by Region 2019 & 2032
- Table 9: Global Plasma Therapy Industry Revenue Million Forecast, by Country 2019 & 2032
- Table 10: Global Plasma Therapy Industry Volume K Unit Forecast, by Country 2019 & 2032
- Table 11: United States Plasma Therapy Industry Revenue (Million) Forecast, by Application 2019 & 2032
- Table 12: United States Plasma Therapy Industry Volume (K Unit) Forecast, by Application 2019 & 2032
- Table 13: Canada Plasma Therapy Industry Revenue (Million) Forecast, by Application 2019 & 2032
- Table 14: Canada Plasma Therapy Industry Volume (K Unit) Forecast, by Application 2019 & 2032
- Table 15: Mexico Plasma Therapy Industry Revenue (Million) Forecast, by Application 2019 & 2032
- Table 16: Mexico Plasma Therapy Industry Volume (K Unit) Forecast, by Application 2019 & 2032
- Table 17: Global Plasma Therapy Industry Revenue Million Forecast, by Country 2019 & 2032
- Table 18: Global Plasma Therapy Industry Volume K Unit Forecast, by Country 2019 & 2032
- Table 19: Germany Plasma Therapy Industry Revenue (Million) Forecast, by Application 2019 & 2032
- Table 20: Germany Plasma Therapy Industry Volume (K Unit) Forecast, by Application 2019 & 2032
- Table 21: United Kingdom Plasma Therapy Industry Revenue (Million) Forecast, by Application 2019 & 2032
- Table 22: United Kingdom Plasma Therapy Industry Volume (K Unit) Forecast, by Application 2019 & 2032
- Table 23: France Plasma Therapy Industry Revenue (Million) Forecast, by Application 2019 & 2032
- Table 24: France Plasma Therapy Industry Volume (K Unit) Forecast, by Application 2019 & 2032
- Table 25: Italy Plasma Therapy Industry Revenue (Million) Forecast, by Application 2019 & 2032
- Table 26: Italy Plasma Therapy Industry Volume (K Unit) Forecast, by Application 2019 & 2032
- Table 27: Spain Plasma Therapy Industry Revenue (Million) Forecast, by Application 2019 & 2032
- Table 28: Spain Plasma Therapy Industry Volume (K Unit) Forecast, by Application 2019 & 2032
- Table 29: Rest of Europe Plasma Therapy Industry Revenue (Million) Forecast, by Application 2019 & 2032
- Table 30: Rest of Europe Plasma Therapy Industry Volume (K Unit) Forecast, by Application 2019 & 2032
- Table 31: Global Plasma Therapy Industry Revenue Million Forecast, by Country 2019 & 2032
- Table 32: Global Plasma Therapy Industry Volume K Unit Forecast, by Country 2019 & 2032
- Table 33: China Plasma Therapy Industry Revenue (Million) Forecast, by Application 2019 & 2032
- Table 34: China Plasma Therapy Industry Volume (K Unit) Forecast, by Application 2019 & 2032
- Table 35: Japan Plasma Therapy Industry Revenue (Million) Forecast, by Application 2019 & 2032
- Table 36: Japan Plasma Therapy Industry Volume (K Unit) Forecast, by Application 2019 & 2032
- Table 37: India Plasma Therapy Industry Revenue (Million) Forecast, by Application 2019 & 2032
- Table 38: India Plasma Therapy Industry Volume (K Unit) Forecast, by Application 2019 & 2032
- Table 39: Australia Plasma Therapy Industry Revenue (Million) Forecast, by Application 2019 & 2032
- Table 40: Australia Plasma Therapy Industry Volume (K Unit) Forecast, by Application 2019 & 2032
- Table 41: South Korea Plasma Therapy Industry Revenue (Million) Forecast, by Application 2019 & 2032
- Table 42: South Korea Plasma Therapy Industry Volume (K Unit) Forecast, by Application 2019 & 2032
- Table 43: Rest of Asia Pacific Plasma Therapy Industry Revenue (Million) Forecast, by Application 2019 & 2032
- Table 44: Rest of Asia Pacific Plasma Therapy Industry Volume (K Unit) Forecast, by Application 2019 & 2032
- Table 45: Global Plasma Therapy Industry Revenue Million Forecast, by Country 2019 & 2032
- Table 46: Global Plasma Therapy Industry Volume K Unit Forecast, by Country 2019 & 2032
- Table 47: GCC Plasma Therapy Industry Revenue (Million) Forecast, by Application 2019 & 2032
- Table 48: GCC Plasma Therapy Industry Volume (K Unit) Forecast, by Application 2019 & 2032
- Table 49: South Africa Plasma Therapy Industry Revenue (Million) Forecast, by Application 2019 & 2032
- Table 50: South Africa Plasma Therapy Industry Volume (K Unit) Forecast, by Application 2019 & 2032
- Table 51: Rest of Middle East and Africa Plasma Therapy Industry Revenue (Million) Forecast, by Application 2019 & 2032
- Table 52: Rest of Middle East and Africa Plasma Therapy Industry Volume (K Unit) Forecast, by Application 2019 & 2032
- Table 53: Global Plasma Therapy Industry Revenue Million Forecast, by Country 2019 & 2032
- Table 54: Global Plasma Therapy Industry Volume K Unit Forecast, by Country 2019 & 2032
- Table 55: Brazil Plasma Therapy Industry Revenue (Million) Forecast, by Application 2019 & 2032
- Table 56: Brazil Plasma Therapy Industry Volume (K Unit) Forecast, by Application 2019 & 2032
- Table 57: Argentina Plasma Therapy Industry Revenue (Million) Forecast, by Application 2019 & 2032
- Table 58: Argentina Plasma Therapy Industry Volume (K Unit) Forecast, by Application 2019 & 2032
- Table 59: Rest of South America Plasma Therapy Industry Revenue (Million) Forecast, by Application 2019 & 2032
- Table 60: Rest of South America Plasma Therapy Industry Volume (K Unit) Forecast, by Application 2019 & 2032
- Table 61: Global Plasma Therapy Industry Revenue Million Forecast, by Product 2019 & 2032
- Table 62: Global Plasma Therapy Industry Volume K Unit Forecast, by Product 2019 & 2032
- Table 63: Global Plasma Therapy Industry Revenue Million Forecast, by Application 2019 & 2032
- Table 64: Global Plasma Therapy Industry Volume K Unit Forecast, by Application 2019 & 2032
- Table 65: Global Plasma Therapy Industry Revenue Million Forecast, by Country 2019 & 2032
- Table 66: Global Plasma Therapy Industry Volume K Unit Forecast, by Country 2019 & 2032
- Table 67: United States Plasma Therapy Industry Revenue (Million) Forecast, by Application 2019 & 2032
- Table 68: United States Plasma Therapy Industry Volume (K Unit) Forecast, by Application 2019 & 2032
- Table 69: Canada Plasma Therapy Industry Revenue (Million) Forecast, by Application 2019 & 2032
- Table 70: Canada Plasma Therapy Industry Volume (K Unit) Forecast, by Application 2019 & 2032
- Table 71: Mexico Plasma Therapy Industry Revenue (Million) Forecast, by Application 2019 & 2032
- Table 72: Mexico Plasma Therapy Industry Volume (K Unit) Forecast, by Application 2019 & 2032
- Table 73: Global Plasma Therapy Industry Revenue Million Forecast, by Product 2019 & 2032
- Table 74: Global Plasma Therapy Industry Volume K Unit Forecast, by Product 2019 & 2032
- Table 75: Global Plasma Therapy Industry Revenue Million Forecast, by Application 2019 & 2032
- Table 76: Global Plasma Therapy Industry Volume K Unit Forecast, by Application 2019 & 2032
- Table 77: Global Plasma Therapy Industry Revenue Million Forecast, by Country 2019 & 2032
- Table 78: Global Plasma Therapy Industry Volume K Unit Forecast, by Country 2019 & 2032
- Table 79: Germany Plasma Therapy Industry Revenue (Million) Forecast, by Application 2019 & 2032
- Table 80: Germany Plasma Therapy Industry Volume (K Unit) Forecast, by Application 2019 & 2032
- Table 81: United Kingdom Plasma Therapy Industry Revenue (Million) Forecast, by Application 2019 & 2032
- Table 82: United Kingdom Plasma Therapy Industry Volume (K Unit) Forecast, by Application 2019 & 2032
- Table 83: France Plasma Therapy Industry Revenue (Million) Forecast, by Application 2019 & 2032
- Table 84: France Plasma Therapy Industry Volume (K Unit) Forecast, by Application 2019 & 2032
- Table 85: Italy Plasma Therapy Industry Revenue (Million) Forecast, by Application 2019 & 2032
- Table 86: Italy Plasma Therapy Industry Volume (K Unit) Forecast, by Application 2019 & 2032
- Table 87: Spain Plasma Therapy Industry Revenue (Million) Forecast, by Application 2019 & 2032
- Table 88: Spain Plasma Therapy Industry Volume (K Unit) Forecast, by Application 2019 & 2032
- Table 89: Rest of Europe Plasma Therapy Industry Revenue (Million) Forecast, by Application 2019 & 2032
- Table 90: Rest of Europe Plasma Therapy Industry Volume (K Unit) Forecast, by Application 2019 & 2032
- Table 91: Global Plasma Therapy Industry Revenue Million Forecast, by Product 2019 & 2032
- Table 92: Global Plasma Therapy Industry Volume K Unit Forecast, by Product 2019 & 2032
- Table 93: Global Plasma Therapy Industry Revenue Million Forecast, by Application 2019 & 2032
- Table 94: Global Plasma Therapy Industry Volume K Unit Forecast, by Application 2019 & 2032
- Table 95: Global Plasma Therapy Industry Revenue Million Forecast, by Country 2019 & 2032
- Table 96: Global Plasma Therapy Industry Volume K Unit Forecast, by Country 2019 & 2032
- Table 97: China Plasma Therapy Industry Revenue (Million) Forecast, by Application 2019 & 2032
- Table 98: China Plasma Therapy Industry Volume (K Unit) Forecast, by Application 2019 & 2032
- Table 99: Japan Plasma Therapy Industry Revenue (Million) Forecast, by Application 2019 & 2032
- Table 100: Japan Plasma Therapy Industry Volume (K Unit) Forecast, by Application 2019 & 2032
- Table 101: India Plasma Therapy Industry Revenue (Million) Forecast, by Application 2019 & 2032
- Table 102: India Plasma Therapy Industry Volume (K Unit) Forecast, by Application 2019 & 2032
- Table 103: Australia Plasma Therapy Industry Revenue (Million) Forecast, by Application 2019 & 2032
- Table 104: Australia Plasma Therapy Industry Volume (K Unit) Forecast, by Application 2019 & 2032
- Table 105: South Korea Plasma Therapy Industry Revenue (Million) Forecast, by Application 2019 & 2032
- Table 106: South Korea Plasma Therapy Industry Volume (K Unit) Forecast, by Application 2019 & 2032
- Table 107: Rest of Asia Pacific Plasma Therapy Industry Revenue (Million) Forecast, by Application 2019 & 2032
- Table 108: Rest of Asia Pacific Plasma Therapy Industry Volume (K Unit) Forecast, by Application 2019 & 2032
- Table 109: Global Plasma Therapy Industry Revenue Million Forecast, by Product 2019 & 2032
- Table 110: Global Plasma Therapy Industry Volume K Unit Forecast, by Product 2019 & 2032
- Table 111: Global Plasma Therapy Industry Revenue Million Forecast, by Application 2019 & 2032
- Table 112: Global Plasma Therapy Industry Volume K Unit Forecast, by Application 2019 & 2032
- Table 113: Global Plasma Therapy Industry Revenue Million Forecast, by Country 2019 & 2032
- Table 114: Global Plasma Therapy Industry Volume K Unit Forecast, by Country 2019 & 2032
- Table 115: GCC Plasma Therapy Industry Revenue (Million) Forecast, by Application 2019 & 2032
- Table 116: GCC Plasma Therapy Industry Volume (K Unit) Forecast, by Application 2019 & 2032
- Table 117: South Africa Plasma Therapy Industry Revenue (Million) Forecast, by Application 2019 & 2032
- Table 118: South Africa Plasma Therapy Industry Volume (K Unit) Forecast, by Application 2019 & 2032
- Table 119: Rest of Middle East and Africa Plasma Therapy Industry Revenue (Million) Forecast, by Application 2019 & 2032
- Table 120: Rest of Middle East and Africa Plasma Therapy Industry Volume (K Unit) Forecast, by Application 2019 & 2032
- Table 121: Global Plasma Therapy Industry Revenue Million Forecast, by Product 2019 & 2032
- Table 122: Global Plasma Therapy Industry Volume K Unit Forecast, by Product 2019 & 2032
- Table 123: Global Plasma Therapy Industry Revenue Million Forecast, by Application 2019 & 2032
- Table 124: Global Plasma Therapy Industry Volume K Unit Forecast, by Application 2019 & 2032
- Table 125: Global Plasma Therapy Industry Revenue Million Forecast, by Country 2019 & 2032
- Table 126: Global Plasma Therapy Industry Volume K Unit Forecast, by Country 2019 & 2032
- Table 127: Brazil Plasma Therapy Industry Revenue (Million) Forecast, by Application 2019 & 2032
- Table 128: Brazil Plasma Therapy Industry Volume (K Unit) Forecast, by Application 2019 & 2032
- Table 129: Argentina Plasma Therapy Industry Revenue (Million) Forecast, by Application 2019 & 2032
- Table 130: Argentina Plasma Therapy Industry Volume (K Unit) Forecast, by Application 2019 & 2032
- Table 131: Rest of South America Plasma Therapy Industry Revenue (Million) Forecast, by Application 2019 & 2032
- Table 132: Rest of South America Plasma Therapy Industry Volume (K Unit) Forecast, by Application 2019 & 2032
Frequently Asked Questions
1. What is the projected Compound Annual Growth Rate (CAGR) of the Plasma Therapy Industry?
The projected CAGR is approximately 5.30%.
2. Which companies are prominent players in the Plasma Therapy Industry?
Key companies in the market include Arthrex Inc, Octapharma USA Inc, Baxter, Bio Products Laboratory Ltd, Takeda Pharmaceutical Company Limited, CSL Limited, ADMA Biologics Inc, Taibang Biological Group Co Ltd, Grifols S A, Johnson and Johnson (DePuy Synthes), Biotest UK, Kedrion S p A.
3. What are the main segments of the Plasma Therapy Industry?
The market segments include Product, Application.
4. Can you provide details about the market size?
The market size is estimated to be USD XX Million as of 2022.
5. What are some drivers contributing to market growth?
Increasing Incidence of Autoimmune and Neurological Diseases; Rise in Research & Development in Plasma Protein.
6. What are the notable trends driving market growth?
Hemophilia Segment is Expected to Witness a Growth in the Plasma Protein Therapeutics Market Over the Forecast Period.
7. Are there any restraints impacting market growth?
Strict Regulations for the Handling of Plasma Protein Products.
8. Can you provide examples of recent developments in the market?
October 2022- Grifols inaugurated its new state-of-the-art manufacturing plant in Ireland to meet the growing global demand for plasma medicines. Grifols' Dublin manufacturing facility triples the annual filling capacity of its innovative, flexible container, ALBUTEIN FlexBag, to meet the rising demand for albumin, the most abundant plasma protein.
9. What pricing options are available for accessing the report?
Pricing options include single-user, multi-user, and enterprise licenses priced at USD 4750, USD 5250, and USD 8750 respectively.
10. Is the market size provided in terms of value or volume?
The market size is provided in terms of value, measured in Million and volume, measured in K Unit.
11. Are there any specific market keywords associated with the report?
Yes, the market keyword associated with the report is "Plasma Therapy Industry," which aids in identifying and referencing the specific market segment covered.
12. How do I determine which pricing option suits my needs best?
The pricing options vary based on user requirements and access needs. Individual users may opt for single-user licenses, while businesses requiring broader access may choose multi-user or enterprise licenses for cost-effective access to the report.
13. Are there any additional resources or data provided in the Plasma Therapy Industry report?
While the report offers comprehensive insights, it's advisable to review the specific contents or supplementary materials provided to ascertain if additional resources or data are available.
14. How can I stay updated on further developments or reports in the Plasma Therapy Industry?
To stay informed about further developments, trends, and reports in the Plasma Therapy Industry, consider subscribing to industry newsletters, following relevant companies and organizations, or regularly checking reputable industry news sources and publications.
Methodology
Step 1 - Identification of Relevant Samples Size from Population Database


Step 2 - Approaches for Defining Global Market Size (Value, Volume* & Price*)

Note*: In applicable scenarios
Step 3 - Data Sources
Primary Research
- Web Analytics
- Survey Reports
- Research Institute
- Latest Research Reports
- Opinion Leaders
Secondary Research
- Annual Reports
- White Paper
- Latest Press Release
- Industry Association
- Paid Database
- Investor Presentations

Step 4 - Data Triangulation
Involves using different sources of information in order to increase the validity of a study
These sources are likely to be stakeholders in a program - participants, other researchers, program staff, other community members, and so on.
Then we put all data in single framework & apply various statistical tools to find out the dynamic on the market.
During the analysis stage, feedback from the stakeholder groups would be compared to determine areas of agreement as well as areas of divergence
