

Key Insights
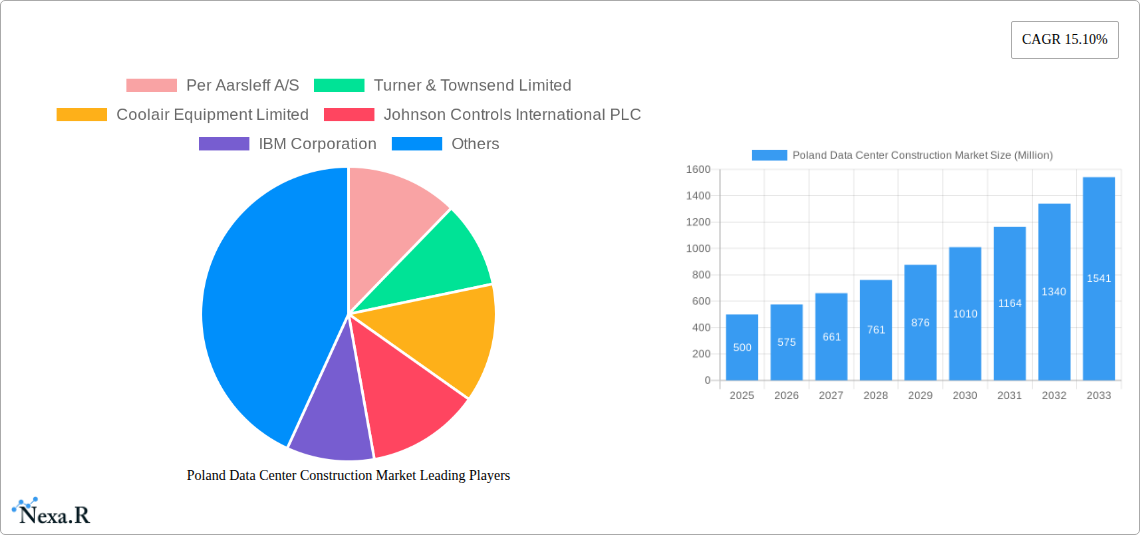
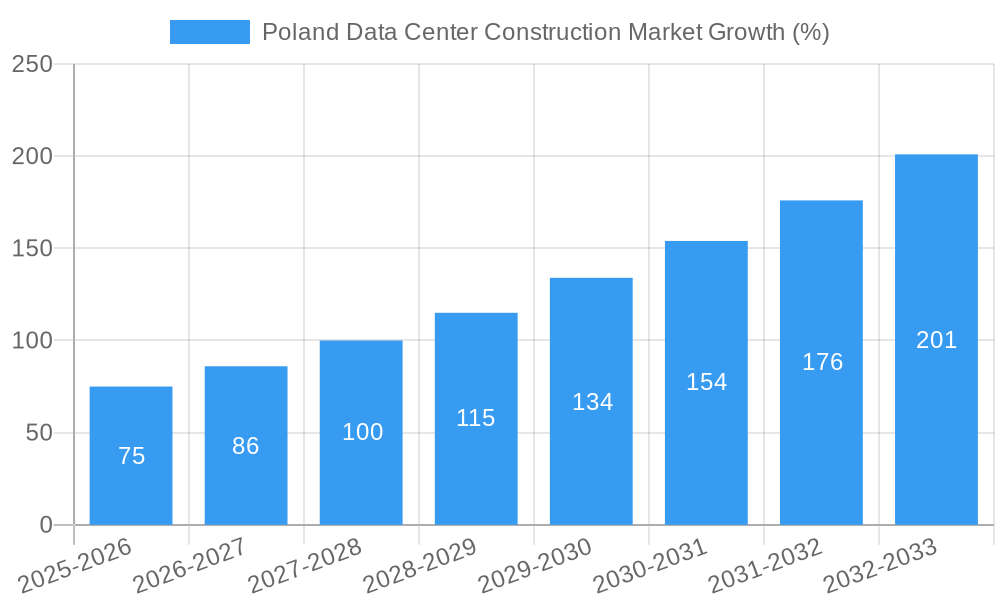
The Poland data center construction market is experiencing robust growth, driven by increasing digitalization, cloud adoption, and the expanding e-commerce sector. With a Compound Annual Growth Rate (CAGR) of 15.10% between 2019 and 2033, the market is projected to reach a substantial size. This expansion is fueled by several key factors. Firstly, the burgeoning IT and telecommunications sector in Poland is demanding more sophisticated and scalable data center infrastructure. Secondly, the financial services, government, and healthcare industries are significantly investing in data center upgrades and expansions to meet rising data storage and processing needs. Furthermore, the strategic location of Poland within Europe enhances its attractiveness as a hub for data centers serving both regional and international clients. The market is segmented by tier type (Tier 1, Tier 2, Tier 3, Tier 4), data center size (small, medium, large, mega, massive), infrastructure components (cooling, power, security, etc.), and end-user sectors. While challenges such as potential regulatory hurdles and skilled labor shortages exist, the overall market outlook remains positive, driven by the continuous rise of data-intensive applications and the government's focus on digital infrastructure development. Key players in this market are leveraging advanced technologies and offering comprehensive solutions to cater to the evolving needs of their clients. The growing demand for energy-efficient and sustainable data center solutions is also shaping the market landscape, fostering innovation and competition.
The significant investments in data center construction in Poland are creating opportunities for a diverse range of companies. International players like IBM, Schneider Electric, and Johnson Controls are competing with local firms for market share, leading to competitive pricing and service offerings. The ongoing expansion of 5G networks and the increasing adoption of edge computing further bolster the demand for data centers in Poland. The market's growth is expected to be particularly strong in the larger data center segments (mega and massive), driven by the requirements of hyperscale cloud providers and large enterprises. The ongoing development of specialized infrastructure components such as advanced cooling systems and high-density power distribution units is further contributing to the overall market growth. While the exact market size for 2025 is not provided, assuming a reasonable starting point based on the CAGR and extrapolated historical data, the projection for the future points to sustained expansion. This positive outlook makes the Polish data center construction market an attractive investment opportunity for both domestic and international companies.
Poland Data Center Construction Market: A Comprehensive Report (2019-2033)
This comprehensive report provides an in-depth analysis of the Poland data center construction market, encompassing market dynamics, growth trends, key players, and future outlook. The report covers the period from 2019 to 2033, with a focus on the base year 2025 and forecast period 2025-2033. It segments the market by Tier Type (Tier 1, Tier 2, Tier 3), Data Center Size (Small, Medium, Large, Mega, Massive), Infrastructure (Cooling, Power, Security, etc.), and End-User (IT & Telecommunication, BFSI, Government, Healthcare, etc.). The report offers invaluable insights for investors, industry professionals, and stakeholders seeking to understand and capitalize on the growth opportunities within this dynamic market. The market is expected to reach XX Million by 2033.
Poland Data Center Construction Market Dynamics & Structure
The Poland data center construction market is experiencing significant growth, driven by increasing digitalization, expanding cloud computing adoption, and government initiatives promoting digital infrastructure. Market concentration is moderate, with several large international players and local companies competing. Technological innovation is a key driver, with advancements in cooling technologies, power infrastructure, and security systems continuously improving efficiency and resilience. Regulatory frameworks, while generally supportive, are subject to change and impact market dynamics. Competitive product substitutes are limited, primarily focused on alternative cloud service models. End-user demographics are diverse, with strong growth from IT & Telecommunication, BFSI, and government sectors. M&A activity has been steadily increasing, with several notable acquisitions in recent years, indicating a consolidation trend within the market.
- Market Concentration: Moderate, with a mix of multinational and local players.
- Technological Innovation: Significant advancements in cooling, power, and security systems driving efficiency.
- Regulatory Framework: Supportive but subject to evolution, impacting market access and investment decisions.
- M&A Activity: Increasing consolidation among market participants, with xx deals recorded between 2019 and 2024. Market share of top 5 players: xx%.
- Innovation Barriers: High capital expenditure requirements and specialized technical expertise.
Poland Data Center Construction Market Growth Trends & Insights
The Poland data center construction market has witnessed consistent growth throughout the historical period (2019-2024), driven by strong demand from various sectors. The market size expanded from XX Million in 2019 to XX Million in 2024, exhibiting a Compound Annual Growth Rate (CAGR) of xx%. This growth is projected to continue in the forecast period (2025-2033), with a projected CAGR of xx%, reaching an estimated XX Million by 2033. The adoption rate of advanced technologies, such as AI-powered cooling systems and modular data center designs, is steadily increasing. Consumer behavior is shifting towards greater reliance on cloud services and digital infrastructure, fueling demand for high-capacity data centers. Technological disruptions, such as the increasing adoption of edge computing, are creating new opportunities within the market. This growth is further propelled by government incentives and the expansion of high-speed internet connectivity across Poland.
Dominant Regions, Countries, or Segments in Poland Data Center Construction Market
The Warsaw metropolitan area dominates the Poland data center construction market, driven by high concentration of IT businesses, established infrastructure, and available skilled workforce. Growth is also being seen in major cities such as Krakow and Wrocław, as businesses expand their operations. The Tier 3 segment holds a significant market share due to cost-effectiveness. In terms of data center size, the Medium and Large segments are currently dominating due to increased adoption by enterprises and cloud providers. Within the infrastructure segment, Cooling Infrastructure and Power Infrastructure are the dominant components because of high initial investment and ongoing maintenance. The IT & Telecommunication sector is the largest end-user, followed by BFSI and the government.
- Key Drivers: Strong government support for digital infrastructure development, increasing investments from multinational corporations, and a growing pool of skilled labor.
- Dominant Regions: Warsaw, Krakow, Wrocław.
- Dominant Segments: Tier 3, Medium and Large Data Centers, Cooling and Power Infrastructure, IT & Telecommunication End-User.
- Growth Potential: High growth potential is expected across all segments, with increased investment in the development of edge computing infrastructure.
Poland Data Center Construction Market Product Landscape
The product landscape is characterized by continuous innovation in areas like energy-efficient cooling systems, advanced power distribution units (PDUs), and highly secure physical infrastructure. New products prioritize sustainability, operational efficiency, and scalability to meet the evolving needs of data center operators. Key innovations include the adoption of liquid cooling technologies, AI-driven power management systems, and advanced security protocols. These advancements are improving the performance metrics such as PUE (Power Usage Effectiveness) and TCO (Total Cost of Ownership). Unique selling propositions often focus on energy efficiency, resilience, and scalability.
Key Drivers, Barriers & Challenges in Poland Data Center Construction Market
Key Drivers: Increasing digitalization across various sectors, rising demand for cloud services, government support for digital infrastructure development, and foreign investments in the Polish IT sector. For example, the government's "Digital Poland" initiative is significantly boosting investment in the sector.
Challenges & Restraints: High initial investment costs for data center construction, limited skilled labor availability in certain areas, potential power grid limitations in some regions, and navigating the regulatory landscape. These factors may hinder the development of data centers in less-developed areas and for smaller enterprises. Supply chain disruptions caused by global events may also cause delays and cost increases (estimated at xx Million annually).
Emerging Opportunities in Poland Data Center Construction Market
Emerging opportunities include the expanding edge computing market, the growing need for hyperscale data centers, and the increasing demand for sustainable and green data center solutions. Untapped markets exist in smaller cities and regions beyond the major metropolitan areas, with supportive government policies paving the way for growth. Innovative applications of AI and machine learning in data center operations are generating new revenue streams.
Growth Accelerators in the Poland Data Center Construction Market Industry
Technological breakthroughs, like advancements in liquid cooling and AI-driven power optimization, will significantly accelerate growth. Strategic partnerships between data center developers, technology providers, and energy companies will enhance efficiency and scalability. Targeted market expansion into secondary cities and regions, coupled with robust government support, will further drive market expansion.
Key Players Shaping the Poland Data Center Construction Market Market
- Per Aarsleff A/S
- Turner & Townsend Limited
- Coolair Equipment Limited
- Johnson Controls International PLC
- IBM Corporation
- Legrand SA
- Bouygues Construction SA
- ALFA LAVAL AB
- Schneider Electric SE
- STULZ GmbH
- DPR CONSTRUCTION INC
- Arup Group Limited
- Kirby Group Engineering
- AECOM
- Coromatic AB Sweden
Notable Milestones in Poland Data Center Construction Market Sector
- December 2022: Atman purchased a 5.5-hectare site in Duchnice to build Atman Data Center Warsaw-3, scheduled to open in Q4 2024 with a 43 MW IT capacity.
- August 2022: Expansion of Atman Data Center Warsaw-1 (F7 building) with 7.2 MW capacity and 2,916 sq. m of new server rooms, commissioning in February 2024.
In-Depth Poland Data Center Construction Market Outlook
The Poland data center construction market is poised for significant growth, driven by a confluence of factors including technological advancements, increasing digitalization, and robust government support. The continued expansion of cloud computing, the rise of edge computing, and the increasing demand for sustainable data center solutions will create numerous opportunities for growth. Strategic partnerships and investment in innovative technologies will be critical to capitalizing on the long-term potential of this thriving market. The market is expected to experience sustained growth throughout the forecast period, with opportunities for both established players and new entrants.
Poland Data Center Construction Market Segmentation
-
1. Infrastructure
-
1.1. Market Segmentation - By Electrical Infrastructure
-
1.1.1. Power Distribution Solution
- 1.1.1.1. PDUs - B
-
1.1.1.2. Transfer Switches
- 1.1.1.2.1. Static
- 1.1.1.2.2. Automatic (ATS)
-
1.1.1.3. Switchgear
- 1.1.1.3.1. Low-voltage
- 1.1.1.3.2. Medium-voltage
- 1.1.1.4. Power Panels and Components
- 1.1.1.5. Others
-
1.1.2. Power Backup Solutions
- 1.1.2.1. UPS
- 1.1.2.2. Generators
- 1.1.3. Service
-
1.1.1. Power Distribution Solution
-
1.2. Market Segmentation - By Mechanical Infrastructure
-
1.2.1. Cooling Systems
- 1.2.1.1. Immersion Cooling
- 1.2.1.2. Direct-to-chip Cooling
- 1.2.1.3. Rear Door Heat Exchanger
- 1.2.1.4. In-row and In-rack Cooling
- 1.2.1.5. Other Mechanical Infrastructures
- 1.2.2. Racks
-
1.2.1. Cooling Systems
-
1.1. Market Segmentation - By Electrical Infrastructure
-
2. Electrical Infrastructure
-
2.1. Power Distribution Solution
- 2.1.1. PDUs - B
-
2.1.2. Transfer Switches
- 2.1.2.1. Static
- 2.1.2.2. Automatic (ATS)
-
2.1.3. Switchgear
- 2.1.3.1. Low-voltage
- 2.1.3.2. Medium-voltage
- 2.1.4. Power Panels and Components
- 2.1.5. Others
-
2.2. Power Backup Solutions
- 2.2.1. UPS
- 2.2.2. Generators
- 2.3. Service
-
2.1. Power Distribution Solution
-
3. Power Distribution Solution
- 3.1. PDUs - B
-
3.2. Transfer Switches
- 3.2.1. Static
- 3.2.2. Automatic (ATS)
-
3.3. Switchgear
- 3.3.1. Low-voltage
- 3.3.2. Medium-voltage
- 3.4. Power Panels and Components
- 3.5. Others
-
4. Power Backup Solutions
- 4.1. UPS
- 4.2. Generators
- 5. Service
-
6. Mechanical Infrastructure
-
6.1. Cooling Systems
- 6.1.1. Immersion Cooling
- 6.1.2. Direct-to-chip Cooling
- 6.1.3. Rear Door Heat Exchanger
- 6.1.4. In-row and In-rack Cooling
- 6.1.5. Other Mechanical Infrastructures
- 6.2. Racks
-
6.1. Cooling Systems
-
7. Cooling Systems
- 7.1. Immersion Cooling
- 7.2. Direct-to-chip Cooling
- 7.3. Rear Door Heat Exchanger
- 7.4. In-row and In-rack Cooling
- 7.5. Other Mechanical Infrastructures
- 8. Racks
- 9. Other Mechanical Infrastructures
-
10. Tier Type
- 10.1. Tier-I and-II
- 10.2. Tier-III
- 10.3. Tier-IV
- 11. Tier-I and-II
- 12. Tier-III
- 13. Tier-IV
-
14. End User
- 14.1. Banking, Financial Services, and Insurance
- 14.2. IT and Telecommunications
- 14.3. Government and Defense
- 14.4. Healthcare
- 14.5. Other End Users
- 15. Banking, Financial Services, and Insurance
- 16. IT and Telecommunications
- 17. Government and Defense
- 18. Healthcare
- 19. Other End Users
Poland Data Center Construction Market Segmentation By Geography
- 1. Poland
Poland Data Center Construction Market REPORT HIGHLIGHTS
| Aspects | Details |
|---|---|
| Study Period | 2019-2033 |
| Base Year | 2024 |
| Estimated Year | 2025 |
| Forecast Period | 2025-2033 |
| Historical Period | 2019-2024 |
| Growth Rate | CAGR of 15.10% from 2019-2033 |
| Segmentation |
|
Table of Contents
- 1. Introduction
- 1.1. Research Scope
- 1.2. Market Segmentation
- 1.3. Research Methodology
- 1.4. Definitions and Assumptions
- 2. Executive Summary
- 2.1. Introduction
- 3. Market Dynamics
- 3.1. Introduction
- 3.2. Market Drivers
- 3.2.1. 5G Developments Fuelling Data Center Investments; Growing Cloud Servce adoption; Green Data Centers rising awarness of Carbon-Neutrality leading to Infrastructure upgrades
- 3.3. Market Restrains
- 3.3.1. Security Challenges Impacting Growth of Data Centers
- 3.4. Market Trends
- 3.4.1. IT and Telecom to have significant market share
- 4. Market Factor Analysis
- 4.1. Porters Five Forces
- 4.2. Supply/Value Chain
- 4.3. PESTEL analysis
- 4.4. Market Entropy
- 4.5. Patent/Trademark Analysis
- 5. Poland Data Center Construction Market Analysis, Insights and Forecast, 2019-2031
- 5.1. Market Analysis, Insights and Forecast - by Infrastructure
- 5.1.1. Market Segmentation - By Electrical Infrastructure
- 5.1.1.1. Power Distribution Solution
- 5.1.1.1.1. PDUs - B
- 5.1.1.1.2. Transfer Switches
- 5.1.1.1.2.1. Static
- 5.1.1.1.2.2. Automatic (ATS)
- 5.1.1.1.3. Switchgear
- 5.1.1.1.3.1. Low-voltage
- 5.1.1.1.3.2. Medium-voltage
- 5.1.1.1.4. Power Panels and Components
- 5.1.1.1.5. Others
- 5.1.1.2. Power Backup Solutions
- 5.1.1.2.1. UPS
- 5.1.1.2.2. Generators
- 5.1.1.3. Service
- 5.1.1.1. Power Distribution Solution
- 5.1.2. Market Segmentation - By Mechanical Infrastructure
- 5.1.2.1. Cooling Systems
- 5.1.2.1.1. Immersion Cooling
- 5.1.2.1.2. Direct-to-chip Cooling
- 5.1.2.1.3. Rear Door Heat Exchanger
- 5.1.2.1.4. In-row and In-rack Cooling
- 5.1.2.1.5. Other Mechanical Infrastructures
- 5.1.2.2. Racks
- 5.1.2.1. Cooling Systems
- 5.1.1. Market Segmentation - By Electrical Infrastructure
- 5.2. Market Analysis, Insights and Forecast - by Electrical Infrastructure
- 5.2.1. Power Distribution Solution
- 5.2.1.1. PDUs - B
- 5.2.1.2. Transfer Switches
- 5.2.1.2.1. Static
- 5.2.1.2.2. Automatic (ATS)
- 5.2.1.3. Switchgear
- 5.2.1.3.1. Low-voltage
- 5.2.1.3.2. Medium-voltage
- 5.2.1.4. Power Panels and Components
- 5.2.1.5. Others
- 5.2.2. Power Backup Solutions
- 5.2.2.1. UPS
- 5.2.2.2. Generators
- 5.2.3. Service
- 5.2.1. Power Distribution Solution
- 5.3. Market Analysis, Insights and Forecast - by Power Distribution Solution
- 5.3.1. PDUs - B
- 5.3.2. Transfer Switches
- 5.3.2.1. Static
- 5.3.2.2. Automatic (ATS)
- 5.3.3. Switchgear
- 5.3.3.1. Low-voltage
- 5.3.3.2. Medium-voltage
- 5.3.4. Power Panels and Components
- 5.3.5. Others
- 5.4. Market Analysis, Insights and Forecast - by Power Backup Solutions
- 5.4.1. UPS
- 5.4.2. Generators
- 5.5. Market Analysis, Insights and Forecast - by Service
- 5.6. Market Analysis, Insights and Forecast - by Mechanical Infrastructure
- 5.6.1. Cooling Systems
- 5.6.1.1. Immersion Cooling
- 5.6.1.2. Direct-to-chip Cooling
- 5.6.1.3. Rear Door Heat Exchanger
- 5.6.1.4. In-row and In-rack Cooling
- 5.6.1.5. Other Mechanical Infrastructures
- 5.6.2. Racks
- 5.6.1. Cooling Systems
- 5.7. Market Analysis, Insights and Forecast - by Cooling Systems
- 5.7.1. Immersion Cooling
- 5.7.2. Direct-to-chip Cooling
- 5.7.3. Rear Door Heat Exchanger
- 5.7.4. In-row and In-rack Cooling
- 5.7.5. Other Mechanical Infrastructures
- 5.8. Market Analysis, Insights and Forecast - by Racks
- 5.9. Market Analysis, Insights and Forecast - by Other Mechanical Infrastructures
- 5.10. Market Analysis, Insights and Forecast - by Tier Type
- 5.10.1. Tier-I and-II
- 5.10.2. Tier-III
- 5.10.3. Tier-IV
- 5.11. Market Analysis, Insights and Forecast - by Tier-I and-II
- 5.12. Market Analysis, Insights and Forecast - by Tier-III
- 5.13. Market Analysis, Insights and Forecast - by Tier-IV
- 5.14. Market Analysis, Insights and Forecast - by End User
- 5.14.1. Banking, Financial Services, and Insurance
- 5.14.2. IT and Telecommunications
- 5.14.3. Government and Defense
- 5.14.4. Healthcare
- 5.14.5. Other End Users
- 5.15. Market Analysis, Insights and Forecast - by Banking, Financial Services, and Insurance
- 5.16. Market Analysis, Insights and Forecast - by IT and Telecommunications
- 5.17. Market Analysis, Insights and Forecast - by Government and Defense
- 5.18. Market Analysis, Insights and Forecast - by Healthcare
- 5.19. Market Analysis, Insights and Forecast - by Other End Users
- 5.20. Market Analysis, Insights and Forecast - by Region
- 5.20.1. Poland
- 5.1. Market Analysis, Insights and Forecast - by Infrastructure
- 6. Competitive Analysis
- 6.1. Market Share Analysis 2024
- 6.2. Company Profiles
- 6.2.1 Per Aarsleff A/S
- 6.2.1.1. Overview
- 6.2.1.2. Products
- 6.2.1.3. SWOT Analysis
- 6.2.1.4. Recent Developments
- 6.2.1.5. Financials (Based on Availability)
- 6.2.2 Turner & Townsend Limited
- 6.2.2.1. Overview
- 6.2.2.2. Products
- 6.2.2.3. SWOT Analysis
- 6.2.2.4. Recent Developments
- 6.2.2.5. Financials (Based on Availability)
- 6.2.3 Coolair Equipment Limited
- 6.2.3.1. Overview
- 6.2.3.2. Products
- 6.2.3.3. SWOT Analysis
- 6.2.3.4. Recent Developments
- 6.2.3.5. Financials (Based on Availability)
- 6.2.4 Johnson Controls International PLC
- 6.2.4.1. Overview
- 6.2.4.2. Products
- 6.2.4.3. SWOT Analysis
- 6.2.4.4. Recent Developments
- 6.2.4.5. Financials (Based on Availability)
- 6.2.5 IBM Corporation
- 6.2.5.1. Overview
- 6.2.5.2. Products
- 6.2.5.3. SWOT Analysis
- 6.2.5.4. Recent Developments
- 6.2.5.5. Financials (Based on Availability)
- 6.2.6 Legrand SA
- 6.2.6.1. Overview
- 6.2.6.2. Products
- 6.2.6.3. SWOT Analysis
- 6.2.6.4. Recent Developments
- 6.2.6.5. Financials (Based on Availability)
- 6.2.7 Bouygues Construction SA
- 6.2.7.1. Overview
- 6.2.7.2. Products
- 6.2.7.3. SWOT Analysis
- 6.2.7.4. Recent Developments
- 6.2.7.5. Financials (Based on Availability)
- 6.2.8 ALFA LAVAL AB
- 6.2.8.1. Overview
- 6.2.8.2. Products
- 6.2.8.3. SWOT Analysis
- 6.2.8.4. Recent Developments
- 6.2.8.5. Financials (Based on Availability)
- 6.2.9 Schneider Electric SE
- 6.2.9.1. Overview
- 6.2.9.2. Products
- 6.2.9.3. SWOT Analysis
- 6.2.9.4. Recent Developments
- 6.2.9.5. Financials (Based on Availability)
- 6.2.10 STULZ GmbH
- 6.2.10.1. Overview
- 6.2.10.2. Products
- 6.2.10.3. SWOT Analysis
- 6.2.10.4. Recent Developments
- 6.2.10.5. Financials (Based on Availability)
- 6.2.11 DPR CONSTRUCTION INC
- 6.2.11.1. Overview
- 6.2.11.2. Products
- 6.2.11.3. SWOT Analysis
- 6.2.11.4. Recent Developments
- 6.2.11.5. Financials (Based on Availability)
- 6.2.12 Arup Group Limited
- 6.2.12.1. Overview
- 6.2.12.2. Products
- 6.2.12.3. SWOT Analysis
- 6.2.12.4. Recent Developments
- 6.2.12.5. Financials (Based on Availability)
- 6.2.13 Kirby Group Engineering
- 6.2.13.1. Overview
- 6.2.13.2. Products
- 6.2.13.3. SWOT Analysis
- 6.2.13.4. Recent Developments
- 6.2.13.5. Financials (Based on Availability)
- 6.2.14 AECOM
- 6.2.14.1. Overview
- 6.2.14.2. Products
- 6.2.14.3. SWOT Analysis
- 6.2.14.4. Recent Developments
- 6.2.14.5. Financials (Based on Availability)
- 6.2.15 Coromatic AB Sweden
- 6.2.15.1. Overview
- 6.2.15.2. Products
- 6.2.15.3. SWOT Analysis
- 6.2.15.4. Recent Developments
- 6.2.15.5. Financials (Based on Availability)
- 6.2.1 Per Aarsleff A/S
List of Figures
- Figure 1: Poland Data Center Construction Market Revenue Breakdown (Million, %) by Product 2024 & 2032
- Figure 2: Poland Data Center Construction Market Share (%) by Company 2024
List of Tables
- Table 1: Poland Data Center Construction Market Revenue Million Forecast, by Region 2019 & 2032
- Table 2: Poland Data Center Construction Market Volume K Unit Forecast, by Region 2019 & 2032
- Table 3: Poland Data Center Construction Market Revenue Million Forecast, by Infrastructure 2019 & 2032
- Table 4: Poland Data Center Construction Market Volume K Unit Forecast, by Infrastructure 2019 & 2032
- Table 5: Poland Data Center Construction Market Revenue Million Forecast, by Electrical Infrastructure 2019 & 2032
- Table 6: Poland Data Center Construction Market Volume K Unit Forecast, by Electrical Infrastructure 2019 & 2032
- Table 7: Poland Data Center Construction Market Revenue Million Forecast, by Power Distribution Solution 2019 & 2032
- Table 8: Poland Data Center Construction Market Volume K Unit Forecast, by Power Distribution Solution 2019 & 2032
- Table 9: Poland Data Center Construction Market Revenue Million Forecast, by Power Backup Solutions 2019 & 2032
- Table 10: Poland Data Center Construction Market Volume K Unit Forecast, by Power Backup Solutions 2019 & 2032
- Table 11: Poland Data Center Construction Market Revenue Million Forecast, by Service 2019 & 2032
- Table 12: Poland Data Center Construction Market Volume K Unit Forecast, by Service 2019 & 2032
- Table 13: Poland Data Center Construction Market Revenue Million Forecast, by Mechanical Infrastructure 2019 & 2032
- Table 14: Poland Data Center Construction Market Volume K Unit Forecast, by Mechanical Infrastructure 2019 & 2032
- Table 15: Poland Data Center Construction Market Revenue Million Forecast, by Cooling Systems 2019 & 2032
- Table 16: Poland Data Center Construction Market Volume K Unit Forecast, by Cooling Systems 2019 & 2032
- Table 17: Poland Data Center Construction Market Revenue Million Forecast, by Racks 2019 & 2032
- Table 18: Poland Data Center Construction Market Volume K Unit Forecast, by Racks 2019 & 2032
- Table 19: Poland Data Center Construction Market Revenue Million Forecast, by Other Mechanical Infrastructures 2019 & 2032
- Table 20: Poland Data Center Construction Market Volume K Unit Forecast, by Other Mechanical Infrastructures 2019 & 2032
- Table 21: Poland Data Center Construction Market Revenue Million Forecast, by Tier Type 2019 & 2032
- Table 22: Poland Data Center Construction Market Volume K Unit Forecast, by Tier Type 2019 & 2032
- Table 23: Poland Data Center Construction Market Revenue Million Forecast, by Tier-I and-II 2019 & 2032
- Table 24: Poland Data Center Construction Market Volume K Unit Forecast, by Tier-I and-II 2019 & 2032
- Table 25: Poland Data Center Construction Market Revenue Million Forecast, by Tier-III 2019 & 2032
- Table 26: Poland Data Center Construction Market Volume K Unit Forecast, by Tier-III 2019 & 2032
- Table 27: Poland Data Center Construction Market Revenue Million Forecast, by Tier-IV 2019 & 2032
- Table 28: Poland Data Center Construction Market Volume K Unit Forecast, by Tier-IV 2019 & 2032
- Table 29: Poland Data Center Construction Market Revenue Million Forecast, by End User 2019 & 2032
- Table 30: Poland Data Center Construction Market Volume K Unit Forecast, by End User 2019 & 2032
- Table 31: Poland Data Center Construction Market Revenue Million Forecast, by Banking, Financial Services, and Insurance 2019 & 2032
- Table 32: Poland Data Center Construction Market Volume K Unit Forecast, by Banking, Financial Services, and Insurance 2019 & 2032
- Table 33: Poland Data Center Construction Market Revenue Million Forecast, by IT and Telecommunications 2019 & 2032
- Table 34: Poland Data Center Construction Market Volume K Unit Forecast, by IT and Telecommunications 2019 & 2032
- Table 35: Poland Data Center Construction Market Revenue Million Forecast, by Government and Defense 2019 & 2032
- Table 36: Poland Data Center Construction Market Volume K Unit Forecast, by Government and Defense 2019 & 2032
- Table 37: Poland Data Center Construction Market Revenue Million Forecast, by Healthcare 2019 & 2032
- Table 38: Poland Data Center Construction Market Volume K Unit Forecast, by Healthcare 2019 & 2032
- Table 39: Poland Data Center Construction Market Revenue Million Forecast, by Other End Users 2019 & 2032
- Table 40: Poland Data Center Construction Market Volume K Unit Forecast, by Other End Users 2019 & 2032
- Table 41: Poland Data Center Construction Market Revenue Million Forecast, by Region 2019 & 2032
- Table 42: Poland Data Center Construction Market Volume K Unit Forecast, by Region 2019 & 2032
- Table 43: Poland Data Center Construction Market Revenue Million Forecast, by Country 2019 & 2032
- Table 44: Poland Data Center Construction Market Volume K Unit Forecast, by Country 2019 & 2032
- Table 45: Poland Data Center Construction Market Revenue Million Forecast, by Infrastructure 2019 & 2032
- Table 46: Poland Data Center Construction Market Volume K Unit Forecast, by Infrastructure 2019 & 2032
- Table 47: Poland Data Center Construction Market Revenue Million Forecast, by Electrical Infrastructure 2019 & 2032
- Table 48: Poland Data Center Construction Market Volume K Unit Forecast, by Electrical Infrastructure 2019 & 2032
- Table 49: Poland Data Center Construction Market Revenue Million Forecast, by Power Distribution Solution 2019 & 2032
- Table 50: Poland Data Center Construction Market Volume K Unit Forecast, by Power Distribution Solution 2019 & 2032
- Table 51: Poland Data Center Construction Market Revenue Million Forecast, by Power Backup Solutions 2019 & 2032
- Table 52: Poland Data Center Construction Market Volume K Unit Forecast, by Power Backup Solutions 2019 & 2032
- Table 53: Poland Data Center Construction Market Revenue Million Forecast, by Service 2019 & 2032
- Table 54: Poland Data Center Construction Market Volume K Unit Forecast, by Service 2019 & 2032
- Table 55: Poland Data Center Construction Market Revenue Million Forecast, by Mechanical Infrastructure 2019 & 2032
- Table 56: Poland Data Center Construction Market Volume K Unit Forecast, by Mechanical Infrastructure 2019 & 2032
- Table 57: Poland Data Center Construction Market Revenue Million Forecast, by Cooling Systems 2019 & 2032
- Table 58: Poland Data Center Construction Market Volume K Unit Forecast, by Cooling Systems 2019 & 2032
- Table 59: Poland Data Center Construction Market Revenue Million Forecast, by Racks 2019 & 2032
- Table 60: Poland Data Center Construction Market Volume K Unit Forecast, by Racks 2019 & 2032
- Table 61: Poland Data Center Construction Market Revenue Million Forecast, by Other Mechanical Infrastructures 2019 & 2032
- Table 62: Poland Data Center Construction Market Volume K Unit Forecast, by Other Mechanical Infrastructures 2019 & 2032
- Table 63: Poland Data Center Construction Market Revenue Million Forecast, by Tier Type 2019 & 2032
- Table 64: Poland Data Center Construction Market Volume K Unit Forecast, by Tier Type 2019 & 2032
- Table 65: Poland Data Center Construction Market Revenue Million Forecast, by Tier-I and-II 2019 & 2032
- Table 66: Poland Data Center Construction Market Volume K Unit Forecast, by Tier-I and-II 2019 & 2032
- Table 67: Poland Data Center Construction Market Revenue Million Forecast, by Tier-III 2019 & 2032
- Table 68: Poland Data Center Construction Market Volume K Unit Forecast, by Tier-III 2019 & 2032
- Table 69: Poland Data Center Construction Market Revenue Million Forecast, by Tier-IV 2019 & 2032
- Table 70: Poland Data Center Construction Market Volume K Unit Forecast, by Tier-IV 2019 & 2032
- Table 71: Poland Data Center Construction Market Revenue Million Forecast, by End User 2019 & 2032
- Table 72: Poland Data Center Construction Market Volume K Unit Forecast, by End User 2019 & 2032
- Table 73: Poland Data Center Construction Market Revenue Million Forecast, by Banking, Financial Services, and Insurance 2019 & 2032
- Table 74: Poland Data Center Construction Market Volume K Unit Forecast, by Banking, Financial Services, and Insurance 2019 & 2032
- Table 75: Poland Data Center Construction Market Revenue Million Forecast, by IT and Telecommunications 2019 & 2032
- Table 76: Poland Data Center Construction Market Volume K Unit Forecast, by IT and Telecommunications 2019 & 2032
- Table 77: Poland Data Center Construction Market Revenue Million Forecast, by Government and Defense 2019 & 2032
- Table 78: Poland Data Center Construction Market Volume K Unit Forecast, by Government and Defense 2019 & 2032
- Table 79: Poland Data Center Construction Market Revenue Million Forecast, by Healthcare 2019 & 2032
- Table 80: Poland Data Center Construction Market Volume K Unit Forecast, by Healthcare 2019 & 2032
- Table 81: Poland Data Center Construction Market Revenue Million Forecast, by Other End Users 2019 & 2032
- Table 82: Poland Data Center Construction Market Volume K Unit Forecast, by Other End Users 2019 & 2032
- Table 83: Poland Data Center Construction Market Revenue Million Forecast, by Country 2019 & 2032
- Table 84: Poland Data Center Construction Market Volume K Unit Forecast, by Country 2019 & 2032
Frequently Asked Questions
1. What is the projected Compound Annual Growth Rate (CAGR) of the Poland Data Center Construction Market?
The projected CAGR is approximately 15.10%.
2. Which companies are prominent players in the Poland Data Center Construction Market?
Key companies in the market include Per Aarsleff A/S, Turner & Townsend Limited, Coolair Equipment Limited, Johnson Controls International PLC, IBM Corporation, Legrand SA, Bouygues Construction SA, ALFA LAVAL AB, Schneider Electric SE, STULZ GmbH, DPR CONSTRUCTION INC, Arup Group Limited, Kirby Group Engineering, AECOM, Coromatic AB Sweden.
3. What are the main segments of the Poland Data Center Construction Market?
The market segments include Infrastructure, Electrical Infrastructure, Power Distribution Solution, Power Backup Solutions, Service , Mechanical Infrastructure, Cooling Systems, Racks, Other Mechanical Infrastructures, Tier Type, Tier-I and-II, Tier-III, Tier-IV, End User, Banking, Financial Services, and Insurance, IT and Telecommunications, Government and Defense, Healthcare, Other End Users.
4. Can you provide details about the market size?
The market size is estimated to be USD XX Million as of 2022.
5. What are some drivers contributing to market growth?
5G Developments Fuelling Data Center Investments; Growing Cloud Servce adoption; Green Data Centers rising awarness of Carbon-Neutrality leading to Infrastructure upgrades.
6. What are the notable trends driving market growth?
IT and Telecom to have significant market share.
7. Are there any restraints impacting market growth?
Security Challenges Impacting Growth of Data Centers.
8. Can you provide examples of recent developments in the market?
December 2022: Atman purchased land, the 5.5-hectare site in Duchnice near Ożarów Mazowiecki, to build another data center. The Atman Data Center Warsaw-3 campus was scheduled to open in Q4 2024 with a target IT capacity of 43 MW.
9. What pricing options are available for accessing the report?
Pricing options include single-user, multi-user, and enterprise licenses priced at USD 3800, USD 4500, and USD 5800 respectively.
10. Is the market size provided in terms of value or volume?
The market size is provided in terms of value, measured in Million and volume, measured in K Unit.
11. Are there any specific market keywords associated with the report?
Yes, the market keyword associated with the report is "Poland Data Center Construction Market," which aids in identifying and referencing the specific market segment covered.
12. How do I determine which pricing option suits my needs best?
The pricing options vary based on user requirements and access needs. Individual users may opt for single-user licenses, while businesses requiring broader access may choose multi-user or enterprise licenses for cost-effective access to the report.
13. Are there any additional resources or data provided in the Poland Data Center Construction Market report?
While the report offers comprehensive insights, it's advisable to review the specific contents or supplementary materials provided to ascertain if additional resources or data are available.
14. How can I stay updated on further developments or reports in the Poland Data Center Construction Market?
To stay informed about further developments, trends, and reports in the Poland Data Center Construction Market, consider subscribing to industry newsletters, following relevant companies and organizations, or regularly checking reputable industry news sources and publications.
Methodology
Step 1 - Identification of Relevant Samples Size from Population Database


Step 2 - Approaches for Defining Global Market Size (Value, Volume* & Price*)

Note*: In applicable scenarios
Step 3 - Data Sources
Primary Research
- Web Analytics
- Survey Reports
- Research Institute
- Latest Research Reports
- Opinion Leaders
Secondary Research
- Annual Reports
- White Paper
- Latest Press Release
- Industry Association
- Paid Database
- Investor Presentations

Step 4 - Data Triangulation
Involves using different sources of information in order to increase the validity of a study
These sources are likely to be stakeholders in a program - participants, other researchers, program staff, other community members, and so on.
Then we put all data in single framework & apply various statistical tools to find out the dynamic on the market.
During the analysis stage, feedback from the stakeholder groups would be compared to determine areas of agreement as well as areas of divergence
