

Key Insights
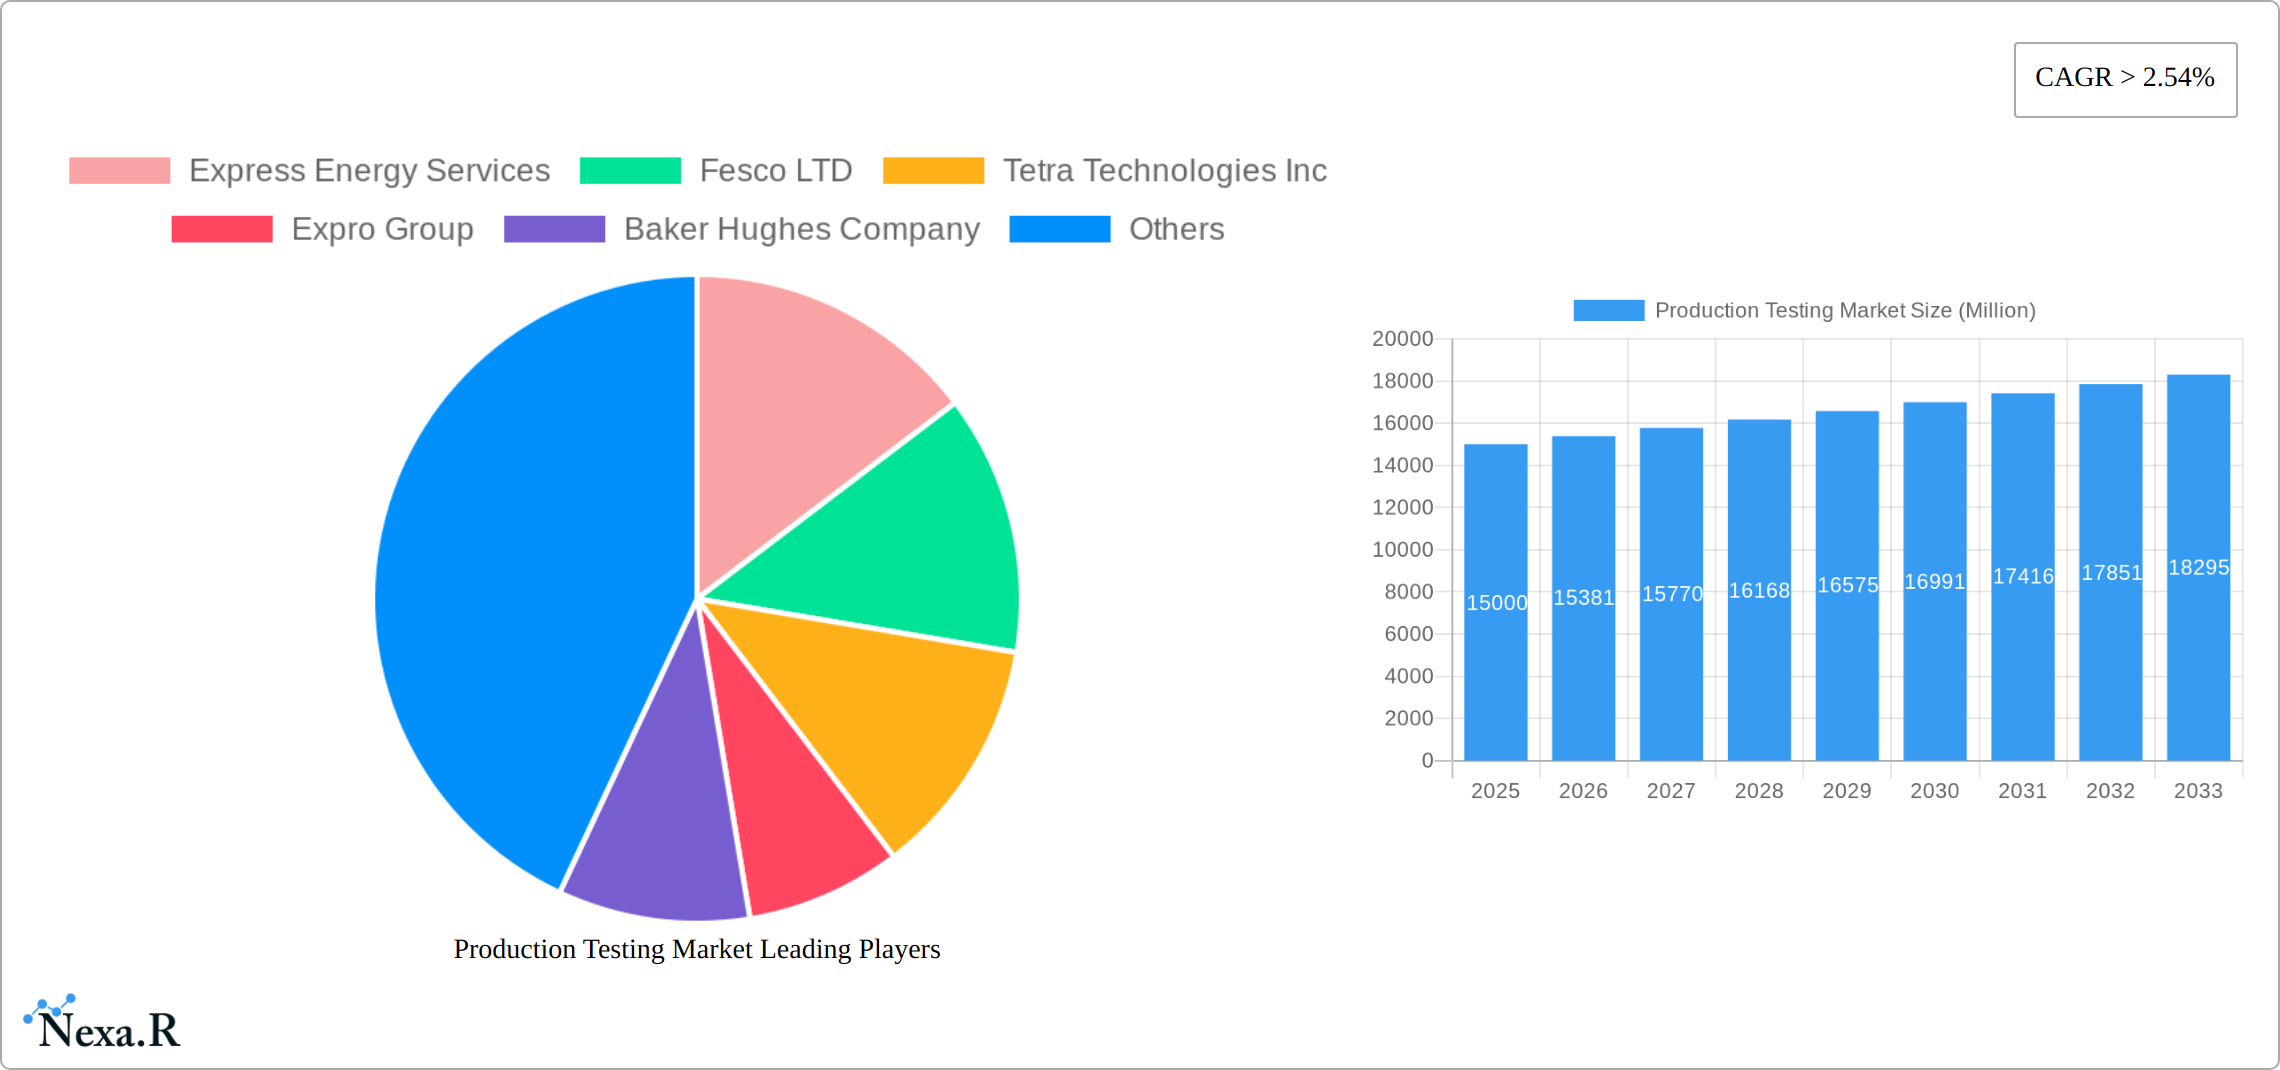
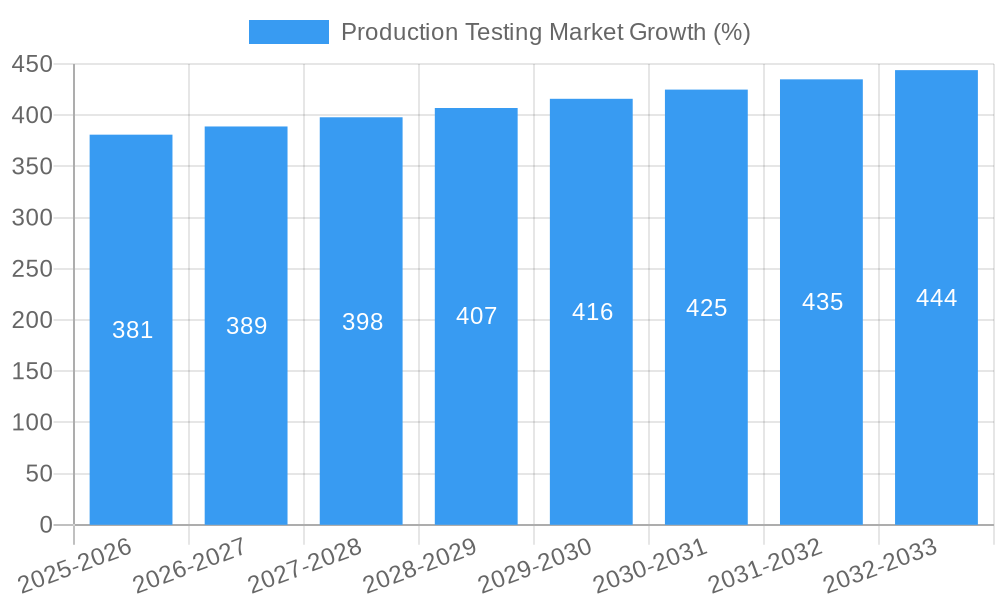
The global production testing market, encompassing well testing, reservoir testing, and fluid analysis services for the oil and gas, mining, and geothermal industries, is experiencing robust growth. Driven by increasing exploration and production activities, particularly in unconventional resources like shale gas and tight oil, the market is projected to maintain a compound annual growth rate (CAGR) exceeding 2.54% from 2025 to 2033. The demand for advanced testing technologies, capable of providing accurate and timely data for optimizing reservoir management and improving production efficiency, is a significant growth driver. Furthermore, stricter environmental regulations are pushing the adoption of sustainable and environmentally friendly testing methodologies, creating new opportunities within the market. North America, particularly the United States, currently holds a substantial market share due to its established oil and gas infrastructure and extensive exploration activities. However, Asia-Pacific is expected to witness significant growth in the coming years, driven by increasing energy demand and investments in oil and gas exploration and production in countries like China and India. Key players such as Express Energy Services, Fesco LTD, Tetra Technologies Inc, Expro Group, Baker Hughes Company, Halliburton Company, and Schlumberger Limited are actively investing in research and development to enhance their technological capabilities and expand their market presence.
The competitive landscape is characterized by both established international players and specialized regional service providers. The market is segmented by testing type (well testing, reservoir testing, fluid analysis) and application industry (oil and gas, mining, geothermal). While the oil and gas industry remains the dominant application segment, the mining and geothermal industries are showing promising growth potential as exploration and development activities intensify in these sectors. The market is likely to face challenges related to fluctuating oil and gas prices, geopolitical uncertainties, and the increasing adoption of digital technologies that could potentially disrupt traditional testing methods. However, the long-term outlook for the production testing market remains positive, driven by the continued need for efficient and reliable testing services throughout the lifecycle of energy and resource extraction projects. The market's success will hinge on the ability of providers to adapt to changing technological landscapes, incorporate sustainable practices, and deliver innovative and cost-effective solutions to their clients.
Production Testing Market: A Comprehensive Report (2019-2033)
This comprehensive report provides an in-depth analysis of the Production Testing Market, encompassing its current state, future trajectory, and key players. With a study period spanning 2019-2033, a base year of 2025, and a forecast period of 2025-2033, this report offers invaluable insights for industry professionals, investors, and stakeholders. The report segments the market by Type (Well testing, Reservoir testing, Fluid analysis) and Application (Oil and gas industry, Mining industry, Geothermal industry), providing a granular understanding of market dynamics across various sectors. The global Production Testing Market size is projected to reach xx Million units by 2033.
Production Testing Market Dynamics & Structure
The Production Testing market is characterized by a moderately concentrated structure, with key players like Baker Hughes Company, Halliburton Company, and Schlumberger Limited holding significant market share. Technological innovation, particularly in data analytics and automation, is a major driver, while stringent regulatory frameworks governing safety and environmental impact influence market growth. Competitive pressures arise from substitute technologies and new entrants. Mergers and acquisitions (M&A) activity has been relatively moderate in recent years, with a total estimated deal volume of xx Million units over the historical period (2019-2024). The ongoing demand for improved operational efficiency and the increasing adoption of advanced production testing techniques are further stimulating market growth.
- Market Concentration: Oligopolistic, with top 5 players holding approximately xx% market share in 2025.
- Technological Innovation: Focus on automation, remote operations, and data analytics to improve efficiency and reduce costs.
- Regulatory Framework: Stringent environmental regulations and safety standards impacting operational costs and strategies.
- Competitive Substitutes: Alternative testing methodologies and technologies are exerting pressure on the market.
- M&A Trends: Consolidation through acquisitions and mergers is expected to continue, driving market concentration.
Production Testing Market Growth Trends & Insights
The Production Testing market has witnessed substantial growth over the historical period (2019-2024), driven primarily by the increasing exploration and production activities in the oil and gas industry, particularly in regions with significant reserves. The market experienced a CAGR of xx% during this period. Technological advancements, such as the adoption of advanced sensors and data analytics, have further propelled market expansion. The rising demand for enhanced oil recovery (EOR) techniques, coupled with growing investments in the renewable energy sector (geothermal), have significantly contributed to the market's growth. Adoption rates are expected to increase further in the forecast period (2025-2033), driven by increasing demand for accurate well testing data and the need for efficient resource management. Market penetration is projected to reach xx% by 2033.
Dominant Regions, Countries, or Segments in Production Testing Market
The Oil and Gas industry segment is the dominant application area for production testing, accounting for xx% of the market in 2025. North America, particularly the United States, holds a leading position due to its robust oil and gas sector and significant investments in EOR technologies. The region’s advanced technological infrastructure and established service providers significantly contribute to its dominance. Asia-Pacific is emerging as a key market, fuelled by rising energy demand and expanding exploration and production activities.
- Key Drivers in North America: Strong oil and gas production, substantial investments in infrastructure, and presence of major market players.
- Key Drivers in Asia-Pacific: Rising energy demand, growing investments in oil and gas exploration, and government support for infrastructure development.
- Market Share: North America holds approximately xx% market share, followed by Europe at xx%, and Asia Pacific at xx% in 2025.
Production Testing Market Product Landscape
Production testing services and equipment are constantly evolving to meet the demands of increased efficiency, reduced downtime, and improved data quality. Advancements in sensor technology, automation, and data analytics are leading to more accurate, reliable, and cost-effective testing solutions. Unique selling propositions include real-time data analysis, reduced environmental impact, and improved safety measures. The integration of cloud-based platforms for data management and remote monitoring is transforming the industry.
Key Drivers, Barriers & Challenges in Production Testing Market
Key Drivers:
- Increasing demand for enhanced oil recovery (EOR) techniques
- Growing investments in unconventional resources such as shale gas and tight oil
- Stringent environmental regulations driving the need for efficient resource management
Challenges and Restraints:
- Fluctuations in oil and gas prices impacting investment decisions.
- High upfront costs associated with advanced testing equipment.
- Skilled labor shortages in certain regions.
Emerging Opportunities in Production Testing Market
- Expansion into emerging markets with significant exploration potential.
- Development of advanced testing solutions for unconventional resources.
- Growing adoption of digital technologies, such as AI and machine learning, for data analysis and predictive maintenance.
Growth Accelerators in the Production Testing Market Industry
Technological breakthroughs in sensor technology, data analytics, and automation are significantly accelerating market growth. Strategic partnerships between service providers and technology companies are enabling the development of innovative solutions. Market expansion into new geographical areas and the development of services tailored to specific industry needs are further driving growth.
Key Players Shaping the Production Testing Market Market
- Express Energy Services
- Fesco LTD
- Tetra Technologies Inc
- Expro Group
- Baker Hughes Company
- Halliburton Company
- Schlumberger Limited
Notable Milestones in Production Testing Market Sector
- 2020: Introduction of a new automated well testing system by Baker Hughes.
- 2022: Merger between two major production testing companies, resulting in increased market share.
- 2023: Launch of a cloud-based platform for data management and remote monitoring by Schlumberger.
In-Depth Production Testing Market Market Outlook
The Production Testing market is poised for significant growth in the coming years, driven by several factors including technological advancements, increasing demand for efficient resource management, and expansion into new geographical regions. Strategic partnerships, technological innovations, and focused investments in research and development will continue to shape the industry's future. The market presents lucrative opportunities for companies that can offer innovative solutions and adapt to evolving industry needs.
Production Testing Market Segmentation
- 1. Production Analysis
- 2. Consumption Analysis
- 3. Import Market Analysis (Value & Volume)
- 4. Export Market Analysis (Value & Volume)
- 5. Price Trend Analysis
Production Testing Market Segmentation By Geography
- 1. North America
- 2. Europe
- 3. Asia Pacific
- 4. South America
- 5. Middle East and Africa

Production Testing Market REPORT HIGHLIGHTS
| Aspects | Details |
|---|---|
| Study Period | 2019-2033 |
| Base Year | 2024 |
| Estimated Year | 2025 |
| Forecast Period | 2025-2033 |
| Historical Period | 2019-2024 |
| Growth Rate | CAGR of > 2.54% from 2019-2033 |
| Segmentation |
|
Table of Contents
- 1. Introduction
- 1.1. Research Scope
- 1.2. Market Segmentation
- 1.3. Research Methodology
- 1.4. Definitions and Assumptions
- 2. Executive Summary
- 2.1. Introduction
- 3. Market Dynamics
- 3.1. Introduction
- 3.2. Market Drivers
- 3.2.1 Increasing Exploration in Offshore Areas4.; The Strengthening of Crude Oil Prices
- 3.2.2 Making the Upstream Activities Economically Feasible
- 3.3. Market Restrains
- 3.3.1. Shifting to Renewable Energy Sources
- 3.4. Market Trends
- 3.4.1. Rising Deepwater Offshore Development Activity
- 4. Market Factor Analysis
- 4.1. Porters Five Forces
- 4.2. Supply/Value Chain
- 4.3. PESTEL analysis
- 4.4. Market Entropy
- 4.5. Patent/Trademark Analysis
- 5. Global Production Testing Market Analysis, Insights and Forecast, 2019-2031
- 5.1. Market Analysis, Insights and Forecast - by Production Analysis
- 5.2. Market Analysis, Insights and Forecast - by Consumption Analysis
- 5.3. Market Analysis, Insights and Forecast - by Import Market Analysis (Value & Volume)
- 5.4. Market Analysis, Insights and Forecast - by Export Market Analysis (Value & Volume)
- 5.5. Market Analysis, Insights and Forecast - by Price Trend Analysis
- 5.6. Market Analysis, Insights and Forecast - by Region
- 5.6.1. North America
- 5.6.2. Europe
- 5.6.3. Asia Pacific
- 5.6.4. South America
- 5.6.5. Middle East and Africa
- 5.1. Market Analysis, Insights and Forecast - by Production Analysis
- 6. North America Production Testing Market Analysis, Insights and Forecast, 2019-2031
- 6.1. Market Analysis, Insights and Forecast - by Production Analysis
- 6.2. Market Analysis, Insights and Forecast - by Consumption Analysis
- 6.3. Market Analysis, Insights and Forecast - by Import Market Analysis (Value & Volume)
- 6.4. Market Analysis, Insights and Forecast - by Export Market Analysis (Value & Volume)
- 6.5. Market Analysis, Insights and Forecast - by Price Trend Analysis
- 6.1. Market Analysis, Insights and Forecast - by Production Analysis
- 7. Europe Production Testing Market Analysis, Insights and Forecast, 2019-2031
- 7.1. Market Analysis, Insights and Forecast - by Production Analysis
- 7.2. Market Analysis, Insights and Forecast - by Consumption Analysis
- 7.3. Market Analysis, Insights and Forecast - by Import Market Analysis (Value & Volume)
- 7.4. Market Analysis, Insights and Forecast - by Export Market Analysis (Value & Volume)
- 7.5. Market Analysis, Insights and Forecast - by Price Trend Analysis
- 7.1. Market Analysis, Insights and Forecast - by Production Analysis
- 8. Asia Pacific Production Testing Market Analysis, Insights and Forecast, 2019-2031
- 8.1. Market Analysis, Insights and Forecast - by Production Analysis
- 8.2. Market Analysis, Insights and Forecast - by Consumption Analysis
- 8.3. Market Analysis, Insights and Forecast - by Import Market Analysis (Value & Volume)
- 8.4. Market Analysis, Insights and Forecast - by Export Market Analysis (Value & Volume)
- 8.5. Market Analysis, Insights and Forecast - by Price Trend Analysis
- 8.1. Market Analysis, Insights and Forecast - by Production Analysis
- 9. South America Production Testing Market Analysis, Insights and Forecast, 2019-2031
- 9.1. Market Analysis, Insights and Forecast - by Production Analysis
- 9.2. Market Analysis, Insights and Forecast - by Consumption Analysis
- 9.3. Market Analysis, Insights and Forecast - by Import Market Analysis (Value & Volume)
- 9.4. Market Analysis, Insights and Forecast - by Export Market Analysis (Value & Volume)
- 9.5. Market Analysis, Insights and Forecast - by Price Trend Analysis
- 9.1. Market Analysis, Insights and Forecast - by Production Analysis
- 10. Middle East and Africa Production Testing Market Analysis, Insights and Forecast, 2019-2031
- 10.1. Market Analysis, Insights and Forecast - by Production Analysis
- 10.2. Market Analysis, Insights and Forecast - by Consumption Analysis
- 10.3. Market Analysis, Insights and Forecast - by Import Market Analysis (Value & Volume)
- 10.4. Market Analysis, Insights and Forecast - by Export Market Analysis (Value & Volume)
- 10.5. Market Analysis, Insights and Forecast - by Price Trend Analysis
- 10.1. Market Analysis, Insights and Forecast - by Production Analysis
- 11. North America Production Testing Market Analysis, Insights and Forecast, 2019-2031
- 11.1. Market Analysis, Insights and Forecast - By Country/Sub-region
- 11.1.1 United States
- 11.1.2 Canada
- 11.1.3 Mexico
- 12. Europe Production Testing Market Analysis, Insights and Forecast, 2019-2031
- 12.1. Market Analysis, Insights and Forecast - By Country/Sub-region
- 12.1.1 Germany
- 12.1.2 United Kingdom
- 12.1.3 France
- 12.1.4 Spain
- 12.1.5 Italy
- 12.1.6 Spain
- 12.1.7 Belgium
- 12.1.8 Netherland
- 12.1.9 Nordics
- 12.1.10 Rest of Europe
- 13. Asia Pacific Production Testing Market Analysis, Insights and Forecast, 2019-2031
- 13.1. Market Analysis, Insights and Forecast - By Country/Sub-region
- 13.1.1 China
- 13.1.2 Japan
- 13.1.3 India
- 13.1.4 South Korea
- 13.1.5 Southeast Asia
- 13.1.6 Australia
- 13.1.7 Indonesia
- 13.1.8 Phillipes
- 13.1.9 Singapore
- 13.1.10 Thailandc
- 13.1.11 Rest of Asia Pacific
- 14. South America Production Testing Market Analysis, Insights and Forecast, 2019-2031
- 14.1. Market Analysis, Insights and Forecast - By Country/Sub-region
- 14.1.1 Brazil
- 14.1.2 Argentina
- 14.1.3 Peru
- 14.1.4 Chile
- 14.1.5 Colombia
- 14.1.6 Ecuador
- 14.1.7 Venezuela
- 14.1.8 Rest of South America
- 15. MEA Production Testing Market Analysis, Insights and Forecast, 2019-2031
- 15.1. Market Analysis, Insights and Forecast - By Country/Sub-region
- 15.1.1 United Arab Emirates
- 15.1.2 Saudi Arabia
- 15.1.3 South Africa
- 15.1.4 Rest of Middle East and Africa
- 16. Competitive Analysis
- 16.1. Global Market Share Analysis 2024
- 16.2. Company Profiles
- 16.2.1 Express Energy Services
- 16.2.1.1. Overview
- 16.2.1.2. Products
- 16.2.1.3. SWOT Analysis
- 16.2.1.4. Recent Developments
- 16.2.1.5. Financials (Based on Availability)
- 16.2.2 Fesco LTD
- 16.2.2.1. Overview
- 16.2.2.2. Products
- 16.2.2.3. SWOT Analysis
- 16.2.2.4. Recent Developments
- 16.2.2.5. Financials (Based on Availability)
- 16.2.3 Tetra Technologies Inc
- 16.2.3.1. Overview
- 16.2.3.2. Products
- 16.2.3.3. SWOT Analysis
- 16.2.3.4. Recent Developments
- 16.2.3.5. Financials (Based on Availability)
- 16.2.4 Expro Group
- 16.2.4.1. Overview
- 16.2.4.2. Products
- 16.2.4.3. SWOT Analysis
- 16.2.4.4. Recent Developments
- 16.2.4.5. Financials (Based on Availability)
- 16.2.5 Baker Hughes Company
- 16.2.5.1. Overview
- 16.2.5.2. Products
- 16.2.5.3. SWOT Analysis
- 16.2.5.4. Recent Developments
- 16.2.5.5. Financials (Based on Availability)
- 16.2.6 Halliburton Company
- 16.2.6.1. Overview
- 16.2.6.2. Products
- 16.2.6.3. SWOT Analysis
- 16.2.6.4. Recent Developments
- 16.2.6.5. Financials (Based on Availability)
- 16.2.7 Schlumberger Limited
- 16.2.7.1. Overview
- 16.2.7.2. Products
- 16.2.7.3. SWOT Analysis
- 16.2.7.4. Recent Developments
- 16.2.7.5. Financials (Based on Availability)
- 16.2.1 Express Energy Services
List of Figures
- Figure 1: Global Production Testing Market Revenue Breakdown (Million, %) by Region 2024 & 2032
- Figure 2: North America Production Testing Market Revenue (Million), by Country 2024 & 2032
- Figure 3: North America Production Testing Market Revenue Share (%), by Country 2024 & 2032
- Figure 4: Europe Production Testing Market Revenue (Million), by Country 2024 & 2032
- Figure 5: Europe Production Testing Market Revenue Share (%), by Country 2024 & 2032
- Figure 6: Asia Pacific Production Testing Market Revenue (Million), by Country 2024 & 2032
- Figure 7: Asia Pacific Production Testing Market Revenue Share (%), by Country 2024 & 2032
- Figure 8: South America Production Testing Market Revenue (Million), by Country 2024 & 2032
- Figure 9: South America Production Testing Market Revenue Share (%), by Country 2024 & 2032
- Figure 10: MEA Production Testing Market Revenue (Million), by Country 2024 & 2032
- Figure 11: MEA Production Testing Market Revenue Share (%), by Country 2024 & 2032
- Figure 12: North America Production Testing Market Revenue (Million), by Production Analysis 2024 & 2032
- Figure 13: North America Production Testing Market Revenue Share (%), by Production Analysis 2024 & 2032
- Figure 14: North America Production Testing Market Revenue (Million), by Consumption Analysis 2024 & 2032
- Figure 15: North America Production Testing Market Revenue Share (%), by Consumption Analysis 2024 & 2032
- Figure 16: North America Production Testing Market Revenue (Million), by Import Market Analysis (Value & Volume) 2024 & 2032
- Figure 17: North America Production Testing Market Revenue Share (%), by Import Market Analysis (Value & Volume) 2024 & 2032
- Figure 18: North America Production Testing Market Revenue (Million), by Export Market Analysis (Value & Volume) 2024 & 2032
- Figure 19: North America Production Testing Market Revenue Share (%), by Export Market Analysis (Value & Volume) 2024 & 2032
- Figure 20: North America Production Testing Market Revenue (Million), by Price Trend Analysis 2024 & 2032
- Figure 21: North America Production Testing Market Revenue Share (%), by Price Trend Analysis 2024 & 2032
- Figure 22: North America Production Testing Market Revenue (Million), by Country 2024 & 2032
- Figure 23: North America Production Testing Market Revenue Share (%), by Country 2024 & 2032
- Figure 24: Europe Production Testing Market Revenue (Million), by Production Analysis 2024 & 2032
- Figure 25: Europe Production Testing Market Revenue Share (%), by Production Analysis 2024 & 2032
- Figure 26: Europe Production Testing Market Revenue (Million), by Consumption Analysis 2024 & 2032
- Figure 27: Europe Production Testing Market Revenue Share (%), by Consumption Analysis 2024 & 2032
- Figure 28: Europe Production Testing Market Revenue (Million), by Import Market Analysis (Value & Volume) 2024 & 2032
- Figure 29: Europe Production Testing Market Revenue Share (%), by Import Market Analysis (Value & Volume) 2024 & 2032
- Figure 30: Europe Production Testing Market Revenue (Million), by Export Market Analysis (Value & Volume) 2024 & 2032
- Figure 31: Europe Production Testing Market Revenue Share (%), by Export Market Analysis (Value & Volume) 2024 & 2032
- Figure 32: Europe Production Testing Market Revenue (Million), by Price Trend Analysis 2024 & 2032
- Figure 33: Europe Production Testing Market Revenue Share (%), by Price Trend Analysis 2024 & 2032
- Figure 34: Europe Production Testing Market Revenue (Million), by Country 2024 & 2032
- Figure 35: Europe Production Testing Market Revenue Share (%), by Country 2024 & 2032
- Figure 36: Asia Pacific Production Testing Market Revenue (Million), by Production Analysis 2024 & 2032
- Figure 37: Asia Pacific Production Testing Market Revenue Share (%), by Production Analysis 2024 & 2032
- Figure 38: Asia Pacific Production Testing Market Revenue (Million), by Consumption Analysis 2024 & 2032
- Figure 39: Asia Pacific Production Testing Market Revenue Share (%), by Consumption Analysis 2024 & 2032
- Figure 40: Asia Pacific Production Testing Market Revenue (Million), by Import Market Analysis (Value & Volume) 2024 & 2032
- Figure 41: Asia Pacific Production Testing Market Revenue Share (%), by Import Market Analysis (Value & Volume) 2024 & 2032
- Figure 42: Asia Pacific Production Testing Market Revenue (Million), by Export Market Analysis (Value & Volume) 2024 & 2032
- Figure 43: Asia Pacific Production Testing Market Revenue Share (%), by Export Market Analysis (Value & Volume) 2024 & 2032
- Figure 44: Asia Pacific Production Testing Market Revenue (Million), by Price Trend Analysis 2024 & 2032
- Figure 45: Asia Pacific Production Testing Market Revenue Share (%), by Price Trend Analysis 2024 & 2032
- Figure 46: Asia Pacific Production Testing Market Revenue (Million), by Country 2024 & 2032
- Figure 47: Asia Pacific Production Testing Market Revenue Share (%), by Country 2024 & 2032
- Figure 48: South America Production Testing Market Revenue (Million), by Production Analysis 2024 & 2032
- Figure 49: South America Production Testing Market Revenue Share (%), by Production Analysis 2024 & 2032
- Figure 50: South America Production Testing Market Revenue (Million), by Consumption Analysis 2024 & 2032
- Figure 51: South America Production Testing Market Revenue Share (%), by Consumption Analysis 2024 & 2032
- Figure 52: South America Production Testing Market Revenue (Million), by Import Market Analysis (Value & Volume) 2024 & 2032
- Figure 53: South America Production Testing Market Revenue Share (%), by Import Market Analysis (Value & Volume) 2024 & 2032
- Figure 54: South America Production Testing Market Revenue (Million), by Export Market Analysis (Value & Volume) 2024 & 2032
- Figure 55: South America Production Testing Market Revenue Share (%), by Export Market Analysis (Value & Volume) 2024 & 2032
- Figure 56: South America Production Testing Market Revenue (Million), by Price Trend Analysis 2024 & 2032
- Figure 57: South America Production Testing Market Revenue Share (%), by Price Trend Analysis 2024 & 2032
- Figure 58: South America Production Testing Market Revenue (Million), by Country 2024 & 2032
- Figure 59: South America Production Testing Market Revenue Share (%), by Country 2024 & 2032
- Figure 60: Middle East and Africa Production Testing Market Revenue (Million), by Production Analysis 2024 & 2032
- Figure 61: Middle East and Africa Production Testing Market Revenue Share (%), by Production Analysis 2024 & 2032
- Figure 62: Middle East and Africa Production Testing Market Revenue (Million), by Consumption Analysis 2024 & 2032
- Figure 63: Middle East and Africa Production Testing Market Revenue Share (%), by Consumption Analysis 2024 & 2032
- Figure 64: Middle East and Africa Production Testing Market Revenue (Million), by Import Market Analysis (Value & Volume) 2024 & 2032
- Figure 65: Middle East and Africa Production Testing Market Revenue Share (%), by Import Market Analysis (Value & Volume) 2024 & 2032
- Figure 66: Middle East and Africa Production Testing Market Revenue (Million), by Export Market Analysis (Value & Volume) 2024 & 2032
- Figure 67: Middle East and Africa Production Testing Market Revenue Share (%), by Export Market Analysis (Value & Volume) 2024 & 2032
- Figure 68: Middle East and Africa Production Testing Market Revenue (Million), by Price Trend Analysis 2024 & 2032
- Figure 69: Middle East and Africa Production Testing Market Revenue Share (%), by Price Trend Analysis 2024 & 2032
- Figure 70: Middle East and Africa Production Testing Market Revenue (Million), by Country 2024 & 2032
- Figure 71: Middle East and Africa Production Testing Market Revenue Share (%), by Country 2024 & 2032
List of Tables
- Table 1: Global Production Testing Market Revenue Million Forecast, by Region 2019 & 2032
- Table 2: Global Production Testing Market Revenue Million Forecast, by Production Analysis 2019 & 2032
- Table 3: Global Production Testing Market Revenue Million Forecast, by Consumption Analysis 2019 & 2032
- Table 4: Global Production Testing Market Revenue Million Forecast, by Import Market Analysis (Value & Volume) 2019 & 2032
- Table 5: Global Production Testing Market Revenue Million Forecast, by Export Market Analysis (Value & Volume) 2019 & 2032
- Table 6: Global Production Testing Market Revenue Million Forecast, by Price Trend Analysis 2019 & 2032
- Table 7: Global Production Testing Market Revenue Million Forecast, by Region 2019 & 2032
- Table 8: Global Production Testing Market Revenue Million Forecast, by Country 2019 & 2032
- Table 9: United States Production Testing Market Revenue (Million) Forecast, by Application 2019 & 2032
- Table 10: Canada Production Testing Market Revenue (Million) Forecast, by Application 2019 & 2032
- Table 11: Mexico Production Testing Market Revenue (Million) Forecast, by Application 2019 & 2032
- Table 12: Global Production Testing Market Revenue Million Forecast, by Country 2019 & 2032
- Table 13: Germany Production Testing Market Revenue (Million) Forecast, by Application 2019 & 2032
- Table 14: United Kingdom Production Testing Market Revenue (Million) Forecast, by Application 2019 & 2032
- Table 15: France Production Testing Market Revenue (Million) Forecast, by Application 2019 & 2032
- Table 16: Spain Production Testing Market Revenue (Million) Forecast, by Application 2019 & 2032
- Table 17: Italy Production Testing Market Revenue (Million) Forecast, by Application 2019 & 2032
- Table 18: Spain Production Testing Market Revenue (Million) Forecast, by Application 2019 & 2032
- Table 19: Belgium Production Testing Market Revenue (Million) Forecast, by Application 2019 & 2032
- Table 20: Netherland Production Testing Market Revenue (Million) Forecast, by Application 2019 & 2032
- Table 21: Nordics Production Testing Market Revenue (Million) Forecast, by Application 2019 & 2032
- Table 22: Rest of Europe Production Testing Market Revenue (Million) Forecast, by Application 2019 & 2032
- Table 23: Global Production Testing Market Revenue Million Forecast, by Country 2019 & 2032
- Table 24: China Production Testing Market Revenue (Million) Forecast, by Application 2019 & 2032
- Table 25: Japan Production Testing Market Revenue (Million) Forecast, by Application 2019 & 2032
- Table 26: India Production Testing Market Revenue (Million) Forecast, by Application 2019 & 2032
- Table 27: South Korea Production Testing Market Revenue (Million) Forecast, by Application 2019 & 2032
- Table 28: Southeast Asia Production Testing Market Revenue (Million) Forecast, by Application 2019 & 2032
- Table 29: Australia Production Testing Market Revenue (Million) Forecast, by Application 2019 & 2032
- Table 30: Indonesia Production Testing Market Revenue (Million) Forecast, by Application 2019 & 2032
- Table 31: Phillipes Production Testing Market Revenue (Million) Forecast, by Application 2019 & 2032
- Table 32: Singapore Production Testing Market Revenue (Million) Forecast, by Application 2019 & 2032
- Table 33: Thailandc Production Testing Market Revenue (Million) Forecast, by Application 2019 & 2032
- Table 34: Rest of Asia Pacific Production Testing Market Revenue (Million) Forecast, by Application 2019 & 2032
- Table 35: Global Production Testing Market Revenue Million Forecast, by Country 2019 & 2032
- Table 36: Brazil Production Testing Market Revenue (Million) Forecast, by Application 2019 & 2032
- Table 37: Argentina Production Testing Market Revenue (Million) Forecast, by Application 2019 & 2032
- Table 38: Peru Production Testing Market Revenue (Million) Forecast, by Application 2019 & 2032
- Table 39: Chile Production Testing Market Revenue (Million) Forecast, by Application 2019 & 2032
- Table 40: Colombia Production Testing Market Revenue (Million) Forecast, by Application 2019 & 2032
- Table 41: Ecuador Production Testing Market Revenue (Million) Forecast, by Application 2019 & 2032
- Table 42: Venezuela Production Testing Market Revenue (Million) Forecast, by Application 2019 & 2032
- Table 43: Rest of South America Production Testing Market Revenue (Million) Forecast, by Application 2019 & 2032
- Table 44: Global Production Testing Market Revenue Million Forecast, by Country 2019 & 2032
- Table 45: United Arab Emirates Production Testing Market Revenue (Million) Forecast, by Application 2019 & 2032
- Table 46: Saudi Arabia Production Testing Market Revenue (Million) Forecast, by Application 2019 & 2032
- Table 47: South Africa Production Testing Market Revenue (Million) Forecast, by Application 2019 & 2032
- Table 48: Rest of Middle East and Africa Production Testing Market Revenue (Million) Forecast, by Application 2019 & 2032
- Table 49: Global Production Testing Market Revenue Million Forecast, by Production Analysis 2019 & 2032
- Table 50: Global Production Testing Market Revenue Million Forecast, by Consumption Analysis 2019 & 2032
- Table 51: Global Production Testing Market Revenue Million Forecast, by Import Market Analysis (Value & Volume) 2019 & 2032
- Table 52: Global Production Testing Market Revenue Million Forecast, by Export Market Analysis (Value & Volume) 2019 & 2032
- Table 53: Global Production Testing Market Revenue Million Forecast, by Price Trend Analysis 2019 & 2032
- Table 54: Global Production Testing Market Revenue Million Forecast, by Country 2019 & 2032
- Table 55: Global Production Testing Market Revenue Million Forecast, by Production Analysis 2019 & 2032
- Table 56: Global Production Testing Market Revenue Million Forecast, by Consumption Analysis 2019 & 2032
- Table 57: Global Production Testing Market Revenue Million Forecast, by Import Market Analysis (Value & Volume) 2019 & 2032
- Table 58: Global Production Testing Market Revenue Million Forecast, by Export Market Analysis (Value & Volume) 2019 & 2032
- Table 59: Global Production Testing Market Revenue Million Forecast, by Price Trend Analysis 2019 & 2032
- Table 60: Global Production Testing Market Revenue Million Forecast, by Country 2019 & 2032
- Table 61: Global Production Testing Market Revenue Million Forecast, by Production Analysis 2019 & 2032
- Table 62: Global Production Testing Market Revenue Million Forecast, by Consumption Analysis 2019 & 2032
- Table 63: Global Production Testing Market Revenue Million Forecast, by Import Market Analysis (Value & Volume) 2019 & 2032
- Table 64: Global Production Testing Market Revenue Million Forecast, by Export Market Analysis (Value & Volume) 2019 & 2032
- Table 65: Global Production Testing Market Revenue Million Forecast, by Price Trend Analysis 2019 & 2032
- Table 66: Global Production Testing Market Revenue Million Forecast, by Country 2019 & 2032
- Table 67: Global Production Testing Market Revenue Million Forecast, by Production Analysis 2019 & 2032
- Table 68: Global Production Testing Market Revenue Million Forecast, by Consumption Analysis 2019 & 2032
- Table 69: Global Production Testing Market Revenue Million Forecast, by Import Market Analysis (Value & Volume) 2019 & 2032
- Table 70: Global Production Testing Market Revenue Million Forecast, by Export Market Analysis (Value & Volume) 2019 & 2032
- Table 71: Global Production Testing Market Revenue Million Forecast, by Price Trend Analysis 2019 & 2032
- Table 72: Global Production Testing Market Revenue Million Forecast, by Country 2019 & 2032
- Table 73: Global Production Testing Market Revenue Million Forecast, by Production Analysis 2019 & 2032
- Table 74: Global Production Testing Market Revenue Million Forecast, by Consumption Analysis 2019 & 2032
- Table 75: Global Production Testing Market Revenue Million Forecast, by Import Market Analysis (Value & Volume) 2019 & 2032
- Table 76: Global Production Testing Market Revenue Million Forecast, by Export Market Analysis (Value & Volume) 2019 & 2032
- Table 77: Global Production Testing Market Revenue Million Forecast, by Price Trend Analysis 2019 & 2032
- Table 78: Global Production Testing Market Revenue Million Forecast, by Country 2019 & 2032
Frequently Asked Questions
1. What is the projected Compound Annual Growth Rate (CAGR) of the Production Testing Market?
The projected CAGR is approximately > 2.54%.
2. Which companies are prominent players in the Production Testing Market?
Key companies in the market include Express Energy Services, Fesco LTD, Tetra Technologies Inc, Expro Group, Baker Hughes Company, Halliburton Company, Schlumberger Limited.
3. What are the main segments of the Production Testing Market?
The market segments include Production Analysis, Consumption Analysis, Import Market Analysis (Value & Volume), Export Market Analysis (Value & Volume), Price Trend Analysis.
4. Can you provide details about the market size?
The market size is estimated to be USD XX Million as of 2022.
5. What are some drivers contributing to market growth?
Increasing Exploration in Offshore Areas4.; The Strengthening of Crude Oil Prices. Making the Upstream Activities Economically Feasible.
6. What are the notable trends driving market growth?
Rising Deepwater Offshore Development Activity.
7. Are there any restraints impacting market growth?
Shifting to Renewable Energy Sources.
8. Can you provide examples of recent developments in the market?
N/A
9. What pricing options are available for accessing the report?
Pricing options include single-user, multi-user, and enterprise licenses priced at USD 4750, USD 5250, and USD 8750 respectively.
10. Is the market size provided in terms of value or volume?
The market size is provided in terms of value, measured in Million.
11. Are there any specific market keywords associated with the report?
Yes, the market keyword associated with the report is "Production Testing Market," which aids in identifying and referencing the specific market segment covered.
12. How do I determine which pricing option suits my needs best?
The pricing options vary based on user requirements and access needs. Individual users may opt for single-user licenses, while businesses requiring broader access may choose multi-user or enterprise licenses for cost-effective access to the report.
13. Are there any additional resources or data provided in the Production Testing Market report?
While the report offers comprehensive insights, it's advisable to review the specific contents or supplementary materials provided to ascertain if additional resources or data are available.
14. How can I stay updated on further developments or reports in the Production Testing Market?
To stay informed about further developments, trends, and reports in the Production Testing Market, consider subscribing to industry newsletters, following relevant companies and organizations, or regularly checking reputable industry news sources and publications.
Methodology
Step 1 - Identification of Relevant Samples Size from Population Database


Step 2 - Approaches for Defining Global Market Size (Value, Volume* & Price*)

Note*: In applicable scenarios
Step 3 - Data Sources
Primary Research
- Web Analytics
- Survey Reports
- Research Institute
- Latest Research Reports
- Opinion Leaders
Secondary Research
- Annual Reports
- White Paper
- Latest Press Release
- Industry Association
- Paid Database
- Investor Presentations

Step 4 - Data Triangulation
Involves using different sources of information in order to increase the validity of a study
These sources are likely to be stakeholders in a program - participants, other researchers, program staff, other community members, and so on.
Then we put all data in single framework & apply various statistical tools to find out the dynamic on the market.
During the analysis stage, feedback from the stakeholder groups would be compared to determine areas of agreement as well as areas of divergence
