

Key Insights
The global Protein Characterization and Quantification market is poised for significant expansion, propelled by the escalating demand for sophisticated proteomics technologies across various industries. Key growth drivers include advancements in analytical techniques like mass spectrometry and chromatography, enabling precise high-throughput protein analysis crucial for drug discovery and development. Furthermore, the rising incidence of chronic diseases is fueling the adoption of protein characterization methods for enhanced diagnostic capabilities in clinical settings. The robust investment in research and development by the biotechnology and pharmaceutical sectors also significantly contributes to market growth. The market is segmented into consumables, instruments, and services. Consumables currently lead in market share due to high reagent and kit usage, while the instruments segment is anticipated to grow substantially, driven by technological innovations and the adoption of advanced equipment such as mass spectrometers. North America and Europe lead the market due to strong research infrastructure and a high concentration of pharmaceutical and biotechnology firms. Asia Pacific is emerging as a rapidly expanding region, attributed to increasing R&D activities and rising healthcare expenditure in key economies.
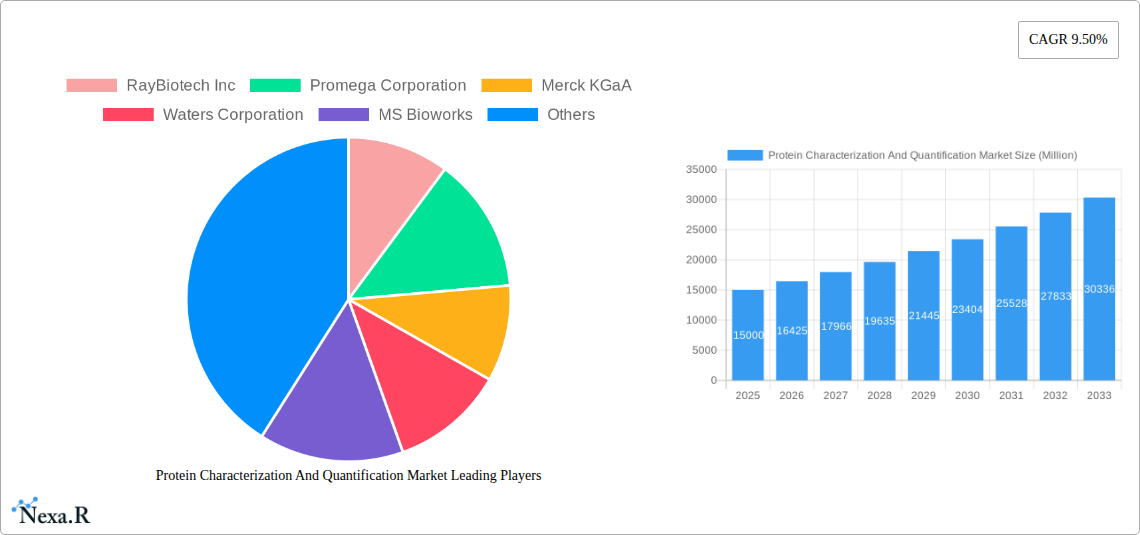
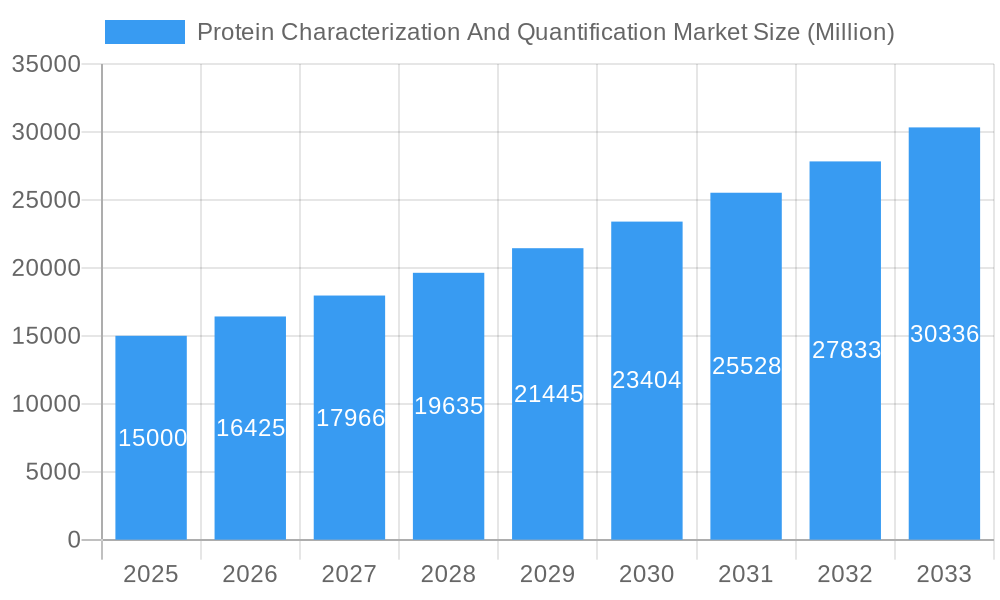
Protein Characterization And Quantification Market Market Size (In Billion)
The competitive environment features a mix of multinational corporations and specialized firms actively investing in R&D to innovate product portfolios and expand global presence. While competitive pricing and technological progress are market catalysts, high-cost instrumentation and the requirement for skilled personnel pose potential challenges. Despite these hurdles, the market exhibits a positive outlook with a projected Compound Annual Growth Rate (CAGR) of 9% from 2025 to 2033. This growth is anticipated to be sustained by ongoing technological advancements, increased government research funding, and the broadening applications of protein characterization in fields such as personalized medicine and biomarker discovery. The market size is estimated at $2.49 billion in the base year 2025. This optimistic forecast indicates a promising trajectory for the Protein Characterization and Quantification market.
Protein Characterization And Quantification Market Company Market Share
Protein Characterization and Quantification Market: A Comprehensive Report (2019-2033)
This comprehensive report provides a detailed analysis of the Protein Characterization and Quantification market, encompassing market dynamics, growth trends, regional segmentation, product landscape, key players, and future outlook. The study period covers 2019-2033, with 2025 as the base and estimated year. The report is invaluable for industry professionals, investors, and researchers seeking to understand and capitalize on opportunities within this rapidly evolving sector. The parent market is the broader Life Sciences Research Tools and Services market, while the child market is specifically focused on protein analysis techniques.
Market Size: The global Protein Characterization and Quantification market is estimated at XXX Million in 2025 and is projected to reach XXX Million by 2033, exhibiting a CAGR of xx% during the forecast period (2025-2033).
Protein Characterization And Quantification Market Market Dynamics & Structure
The Protein Characterization and Quantification market is characterized by a moderately consolidated structure, with several key players holding significant market share. Technological innovation, particularly in mass spectrometry and chromatography, is a major driver of market growth. Stringent regulatory frameworks, particularly in the pharmaceutical and clinical diagnostic sectors, influence product development and adoption. The market also faces competition from alternative analytical techniques and the emergence of novel technologies. Mergers and acquisitions (M&A) activity has been moderate, with larger companies acquiring smaller specialized firms to expand their product portfolios and technological capabilities.
- Market Concentration: The top 5 players account for approximately xx% of the market share in 2025.
- Technological Innovation: Advancements in mass spectrometry, chromatography, and ELISA technologies are key drivers.
- Regulatory Landscape: Stringent regulatory compliance requirements, especially in clinical diagnostics, impact market growth.
- Competitive Landscape: Competition from alternative techniques, such as electrophoresis and immunoblotting, exerts pressure on market growth.
- M&A Activity: xx M&A deals were recorded in the period 2019-2024, primarily focused on technological expansion.
Protein Characterization And Quantification Market Growth Trends & Insights
The Protein Characterization and Quantification market is experiencing robust growth driven by several factors. The increasing prevalence of chronic diseases and the rising demand for personalized medicine are fueling growth in clinical diagnostics. Simultaneously, the booming biopharmaceutical industry, with its focus on drug discovery and development, necessitates sophisticated protein characterization tools. Technological advancements, such as high-throughput screening platforms and improved analytical techniques, are enhancing efficiency and accuracy. The market is witnessing a shift towards automation and integrated solutions, optimizing workflows and reducing costs. The adoption of advanced analytical techniques, coupled with increasing investments in R&D, further fuels market growth.
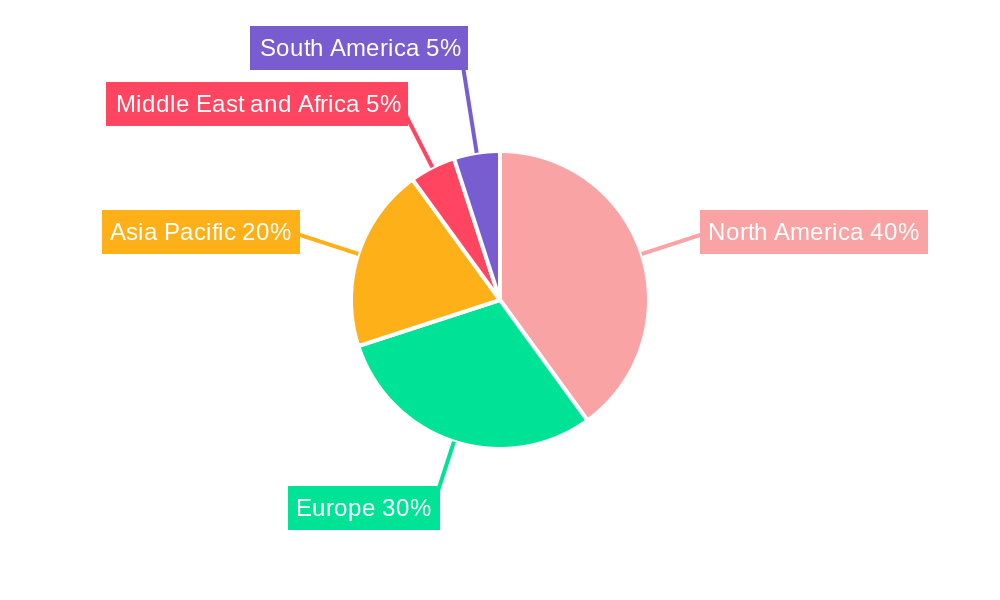
Dominant Regions, Countries, or Segments in Protein Characterization And Quantification Market
North America holds the largest market share, followed by Europe. The dominance of these regions is attributed to strong regulatory support, robust healthcare infrastructure, and a high concentration of biotechnology and pharmaceutical companies. The Drug Discovery & Development application segment holds the largest share, driven by the need for precise protein analysis during drug development. Within the product segment, Instruments contribute the most to the market revenue due to their essential role in advanced protein analysis techniques.
- North America: Strong presence of key players, significant investments in R&D, and stringent regulatory frameworks drive market growth.
- Europe: Well-established healthcare systems, substantial funding for life sciences research, and growing demand for advanced diagnostic tools contribute to high market share.
- Asia Pacific: Rapidly expanding pharmaceutical and biotechnology sectors, coupled with rising healthcare expenditure, contribute to significant growth potential.
- Drug Discovery & Development: The highest demand stems from the extensive use of protein characterization in drug development and formulation.
- Instruments: High capital expenditure associated with advanced instruments contributes to a significant revenue share.
- Biotechnology & Pharmaceutical Companies: These end-users represent the major segment owing to their extensive reliance on protein characterization for drug development and quality control.
Protein Characterization And Quantification Market Product Landscape
The market offers a wide array of products, including consumables (e.g., reagents, kits), instruments (e.g., mass spectrometers, chromatographs), and services (e.g., sample preparation, data analysis). Recent innovations focus on improved sensitivity, speed, automation, and integration with other analytical platforms. Unique selling propositions include high throughput capabilities, ease of use, and enhanced data analysis tools. Technological advancements include miniaturization, advanced detectors, and software-driven automation.
Key Drivers, Barriers & Challenges in Protein Characterization And Quantification Market
Key Drivers:
- Rising prevalence of chronic diseases boosting demand for clinical diagnostics.
- Increasing biopharmaceutical R&D investments requiring advanced protein analysis.
- Technological advancements enhancing sensitivity and throughput of analytical techniques.
Challenges:
- High cost of advanced instruments limiting accessibility, especially in developing nations.
- Stringent regulatory approvals for diagnostic tools hindering market entry.
- Intense competition from established players creating a challenging environment for new entrants. The market experienced approximately xx% price erosion from 2021 to 2024 due to this competition.
Emerging Opportunities in Protein Characterization And Quantification Market
- Growing demand for point-of-care diagnostics in remote areas presents significant opportunities for portable, user-friendly devices.
- Development of novel assays for biomarker discovery and personalized medicine holds immense potential.
- Expansion into emerging markets in Asia and Latin America offers untapped growth potential.
Growth Accelerators in the Protein Characterization And Quantification Market Industry
Strategic partnerships and collaborations between instrument manufacturers and service providers are driving market growth. The integration of AI and machine learning in data analysis tools is significantly improving the accuracy and efficiency of protein characterization workflows. Expansion into new applications, such as food safety and environmental monitoring, opens up new avenues for growth.
Key Players Shaping the Protein Characterization And Quantification Market Market
- RayBiotech Inc
- Promega Corporation
- Merck KGaA
- Waters Corporation
- MS Bioworks
- Sartorius AG
- QIAGEN N V
- Shimadzu Corporation
- VProteomics
- Creative Proteomics
- Thermo Fisher Scientific
- Agilent Technologies
- HORIBA Ltd
Notable Milestones in Protein Characterization And Quantification Sector
- April 2022: PerkinElmer, Inc. launched two ready-to-use HTRF and AlphaLISA no-wash assay kits for detecting and quantifying CHO HCP impurities in biopharmaceutical manufacturing. This significantly improved efficiency in quality control processes.
- February 2023: Charles River Laboratories International, Inc. launched its first ELISA Kit for detecting and quantifying residual host cell proteins (HCP) in CHO-based biotherapeutics. This expands the available options for HCP detection and enhances biopharmaceutical quality control.
In-Depth Protein Characterization And Quantification Market Market Outlook
The Protein Characterization and Quantification market is poised for continued robust growth, driven by technological innovations, increasing demand from the biopharmaceutical and clinical diagnostics sectors, and expansion into new application areas. Strategic partnerships, acquisitions, and the development of integrated solutions will further shape market dynamics. The focus on high-throughput, automated, and user-friendly systems will drive market expansion in the coming years. The market is expected to witness continued innovation in areas such as improved sensitivity, faster analysis times, and more comprehensive data analysis capabilities.
Protein Characterization And Quantification Market Segmentation
-
1. Product and Services
- 1.1. Consumables
-
1.2. Instruments
- 1.2.1. Mass Spectrometry Instruments
- 1.2.2. Chromatography Instruments
- 1.2.3. Electrophoresis Instruments
- 1.2.4. Label-free Detection Instruments
- 1.2.5. Spectroscopy Instruments
- 1.2.6. Other Instruments
-
2. Application
- 2.1. Drug Discovery & Development
- 2.2. Clinical Diagnosis
- 2.3. Other Applications
-
3. End User
- 3.1. Biotechnology & Pharmaceutical Companies
- 3.2. Contract Research Organization
- 3.3. Other End Users
Protein Characterization And Quantification Market Segmentation By Geography
-
1. North America
- 1.1. United States
- 1.2. Canada
- 1.3. Mexico
-
2. Europe
- 2.1. Germany
- 2.2. United Kingdom
- 2.3. France
- 2.4. Italy
- 2.5. Spain
- 2.6. Rest of Europe
-
3. Asia Pacific
- 3.1. China
- 3.2. Japan
- 3.3. India
- 3.4. Australia
- 3.5. South Korea
- 3.6. Rest of Asia Pacific
-
4. Middle East and Africa
- 4.1. GCC
- 4.2. South Africa
- 4.3. Rest of Middle East and Africa
-
5. South America
- 5.1. Brazil
- 5.2. Argentina
- 5.3. Rest of South America
Protein Characterization And Quantification Market Regional Market Share
Geographic Coverage of Protein Characterization And Quantification Market
Protein Characterization And Quantification Market REPORT HIGHLIGHTS
| Aspects | Details |
|---|---|
| Study Period | 2020-2034 |
| Base Year | 2025 |
| Estimated Year | 2026 |
| Forecast Period | 2026-2034 |
| Historical Period | 2020-2025 |
| Growth Rate | CAGR of 9% from 2020-2034 |
| Segmentation |
|
Table of Contents
- 1. Introduction
- 1.1. Research Scope
- 1.2. Market Segmentation
- 1.3. Research Objective
- 1.4. Definitions and Assumptions
- 2. Executive Summary
- 2.1. Market Snapshot
- 3. Market Dynamics
- 3.1. Market Drivers
- 3.2. Market Restrains
- 3.3. Market Trends
- 3.4. Market Opportunities
- 4. Market Factor Analysis
- 4.1. Porters Five Forces
- 4.1.1. Bargaining Power of Suppliers
- 4.1.2. Bargaining Power of Buyers
- 4.1.3. Threat of New Entrants
- 4.1.4. Threat of Substitutes
- 4.1.5. Competitive Rivalry
- 4.2. PESTEL analysis
- 4.3. BCG Analysis
- 4.3.1. Stars (High Growth, High Market Share)
- 4.3.2. Cash Cows (Low Growth, High Market Share)
- 4.3.3. Question Mark (High Growth, Low Market Share)
- 4.3.4. Dogs (Low Growth, Low Market Share)
- 4.4. Ansoff Matrix Analysis
- 4.5. Supply Chain Analysis
- 4.6. Regulatory Landscape
- 4.7. Current Market Potential and Opportunity Assessment (TAM–SAM–SOM Framework)
- 4.8. NRP Analyst Note
- 4.1. Porters Five Forces
- 5. Market Analysis, Insights and Forecast 2021-2033
- 5.1. Market Analysis, Insights and Forecast - by Product and Services
- 5.1.1. Consumables
- 5.1.2. Instruments
- 5.1.2.1. Mass Spectrometry Instruments
- 5.1.2.2. Chromatography Instruments
- 5.1.2.3. Electrophoresis Instruments
- 5.1.2.4. Label-free Detection Instruments
- 5.1.2.5. Spectroscopy Instruments
- 5.1.2.6. Other Instruments
- 5.2. Market Analysis, Insights and Forecast - by Application
- 5.2.1. Drug Discovery & Development
- 5.2.2. Clinical Diagnosis
- 5.2.3. Other Applications
- 5.3. Market Analysis, Insights and Forecast - by End User
- 5.3.1. Biotechnology & Pharmaceutical Companies
- 5.3.2. Contract Research Organization
- 5.3.3. Other End Users
- 5.4. Market Analysis, Insights and Forecast - by Region
- 5.4.1. North America
- 5.4.2. Europe
- 5.4.3. Asia Pacific
- 5.4.4. Middle East and Africa
- 5.4.5. South America
- 5.1. Market Analysis, Insights and Forecast - by Product and Services
- 6. Global Protein Characterization And Quantification Market Analysis, Insights and Forecast, 2021-2033
- 6.1. Market Analysis, Insights and Forecast - by Product and Services
- 6.1.1. Consumables
- 6.1.2. Instruments
- 6.1.2.1. Mass Spectrometry Instruments
- 6.1.2.2. Chromatography Instruments
- 6.1.2.3. Electrophoresis Instruments
- 6.1.2.4. Label-free Detection Instruments
- 6.1.2.5. Spectroscopy Instruments
- 6.1.2.6. Other Instruments
- 6.2. Market Analysis, Insights and Forecast - by Application
- 6.2.1. Drug Discovery & Development
- 6.2.2. Clinical Diagnosis
- 6.2.3. Other Applications
- 6.3. Market Analysis, Insights and Forecast - by End User
- 6.3.1. Biotechnology & Pharmaceutical Companies
- 6.3.2. Contract Research Organization
- 6.3.3. Other End Users
- 6.1. Market Analysis, Insights and Forecast - by Product and Services
- 7. North America Protein Characterization And Quantification Market Analysis, Insights and Forecast, 2020-2032
- 7.1. Market Analysis, Insights and Forecast - by Product and Services
- 7.1.1. Consumables
- 7.1.2. Instruments
- 7.1.2.1. Mass Spectrometry Instruments
- 7.1.2.2. Chromatography Instruments
- 7.1.2.3. Electrophoresis Instruments
- 7.1.2.4. Label-free Detection Instruments
- 7.1.2.5. Spectroscopy Instruments
- 7.1.2.6. Other Instruments
- 7.2. Market Analysis, Insights and Forecast - by Application
- 7.2.1. Drug Discovery & Development
- 7.2.2. Clinical Diagnosis
- 7.2.3. Other Applications
- 7.3. Market Analysis, Insights and Forecast - by End User
- 7.3.1. Biotechnology & Pharmaceutical Companies
- 7.3.2. Contract Research Organization
- 7.3.3. Other End Users
- 7.1. Market Analysis, Insights and Forecast - by Product and Services
- 8. Europe Protein Characterization And Quantification Market Analysis, Insights and Forecast, 2020-2032
- 8.1. Market Analysis, Insights and Forecast - by Product and Services
- 8.1.1. Consumables
- 8.1.2. Instruments
- 8.1.2.1. Mass Spectrometry Instruments
- 8.1.2.2. Chromatography Instruments
- 8.1.2.3. Electrophoresis Instruments
- 8.1.2.4. Label-free Detection Instruments
- 8.1.2.5. Spectroscopy Instruments
- 8.1.2.6. Other Instruments
- 8.2. Market Analysis, Insights and Forecast - by Application
- 8.2.1. Drug Discovery & Development
- 8.2.2. Clinical Diagnosis
- 8.2.3. Other Applications
- 8.3. Market Analysis, Insights and Forecast - by End User
- 8.3.1. Biotechnology & Pharmaceutical Companies
- 8.3.2. Contract Research Organization
- 8.3.3. Other End Users
- 8.1. Market Analysis, Insights and Forecast - by Product and Services
- 9. Asia Pacific Protein Characterization And Quantification Market Analysis, Insights and Forecast, 2020-2032
- 9.1. Market Analysis, Insights and Forecast - by Product and Services
- 9.1.1. Consumables
- 9.1.2. Instruments
- 9.1.2.1. Mass Spectrometry Instruments
- 9.1.2.2. Chromatography Instruments
- 9.1.2.3. Electrophoresis Instruments
- 9.1.2.4. Label-free Detection Instruments
- 9.1.2.5. Spectroscopy Instruments
- 9.1.2.6. Other Instruments
- 9.2. Market Analysis, Insights and Forecast - by Application
- 9.2.1. Drug Discovery & Development
- 9.2.2. Clinical Diagnosis
- 9.2.3. Other Applications
- 9.3. Market Analysis, Insights and Forecast - by End User
- 9.3.1. Biotechnology & Pharmaceutical Companies
- 9.3.2. Contract Research Organization
- 9.3.3. Other End Users
- 9.1. Market Analysis, Insights and Forecast - by Product and Services
- 10. Middle East and Africa Protein Characterization And Quantification Market Analysis, Insights and Forecast, 2020-2032
- 10.1. Market Analysis, Insights and Forecast - by Product and Services
- 10.1.1. Consumables
- 10.1.2. Instruments
- 10.1.2.1. Mass Spectrometry Instruments
- 10.1.2.2. Chromatography Instruments
- 10.1.2.3. Electrophoresis Instruments
- 10.1.2.4. Label-free Detection Instruments
- 10.1.2.5. Spectroscopy Instruments
- 10.1.2.6. Other Instruments
- 10.2. Market Analysis, Insights and Forecast - by Application
- 10.2.1. Drug Discovery & Development
- 10.2.2. Clinical Diagnosis
- 10.2.3. Other Applications
- 10.3. Market Analysis, Insights and Forecast - by End User
- 10.3.1. Biotechnology & Pharmaceutical Companies
- 10.3.2. Contract Research Organization
- 10.3.3. Other End Users
- 10.1. Market Analysis, Insights and Forecast - by Product and Services
- 11. South America Protein Characterization And Quantification Market Analysis, Insights and Forecast, 2020-2032
- 11.1. Market Analysis, Insights and Forecast - by Product and Services
- 11.1.1. Consumables
- 11.1.2. Instruments
- 11.1.2.1. Mass Spectrometry Instruments
- 11.1.2.2. Chromatography Instruments
- 11.1.2.3. Electrophoresis Instruments
- 11.1.2.4. Label-free Detection Instruments
- 11.1.2.5. Spectroscopy Instruments
- 11.1.2.6. Other Instruments
- 11.2. Market Analysis, Insights and Forecast - by Application
- 11.2.1. Drug Discovery & Development
- 11.2.2. Clinical Diagnosis
- 11.2.3. Other Applications
- 11.3. Market Analysis, Insights and Forecast - by End User
- 11.3.1. Biotechnology & Pharmaceutical Companies
- 11.3.2. Contract Research Organization
- 11.3.3. Other End Users
- 11.1. Market Analysis, Insights and Forecast - by Product and Services
- 12. Competitive Analysis
- 12.1. Company Profiles
- 12.1.1 RayBiotech Inc
- 12.1.1.1. Company Overview
- 12.1.1.2. Products
- 12.1.1.3. Company Financials
- 12.1.1.4. SWOT Analysis
- 12.1.2 Promega Corporation
- 12.1.2.1. Company Overview
- 12.1.2.2. Products
- 12.1.2.3. Company Financials
- 12.1.2.4. SWOT Analysis
- 12.1.3 Merck KGaA
- 12.1.3.1. Company Overview
- 12.1.3.2. Products
- 12.1.3.3. Company Financials
- 12.1.3.4. SWOT Analysis
- 12.1.4 Waters Corporation
- 12.1.4.1. Company Overview
- 12.1.4.2. Products
- 12.1.4.3. Company Financials
- 12.1.4.4. SWOT Analysis
- 12.1.5 MS Bioworks
- 12.1.5.1. Company Overview
- 12.1.5.2. Products
- 12.1.5.3. Company Financials
- 12.1.5.4. SWOT Analysis
- 12.1.6 Sartorius AG
- 12.1.6.1. Company Overview
- 12.1.6.2. Products
- 12.1.6.3. Company Financials
- 12.1.6.4. SWOT Analysis
- 12.1.7 QIAGEN N V
- 12.1.7.1. Company Overview
- 12.1.7.2. Products
- 12.1.7.3. Company Financials
- 12.1.7.4. SWOT Analysis
- 12.1.8 Shimadzu Corporation
- 12.1.8.1. Company Overview
- 12.1.8.2. Products
- 12.1.8.3. Company Financials
- 12.1.8.4. SWOT Analysis
- 12.1.9 VProteomics
- 12.1.9.1. Company Overview
- 12.1.9.2. Products
- 12.1.9.3. Company Financials
- 12.1.9.4. SWOT Analysis
- 12.1.10 Creative Proteomics
- 12.1.10.1. Company Overview
- 12.1.10.2. Products
- 12.1.10.3. Company Financials
- 12.1.10.4. SWOT Analysis
- 12.1.11 Thermo Fisher Scientific
- 12.1.11.1. Company Overview
- 12.1.11.2. Products
- 12.1.11.3. Company Financials
- 12.1.11.4. SWOT Analysis
- 12.1.12 Agilent Technologies
- 12.1.12.1. Company Overview
- 12.1.12.2. Products
- 12.1.12.3. Company Financials
- 12.1.12.4. SWOT Analysis
- 12.1.13 HORIBA Ltd
- 12.1.13.1. Company Overview
- 12.1.13.2. Products
- 12.1.13.3. Company Financials
- 12.1.13.4. SWOT Analysis
- 12.1.1 RayBiotech Inc
- 12.2. Market Entropy
- 12.2.1 Company's Key Areas Served
- 12.2.2 Recent Developments
- 12.3. Company Market Share Analysis 2025
- 12.3.1 Top 5 Companies Market Share Analysis
- 12.3.2 Top 3 Companies Market Share Analysis
- 12.4. List of Potential Customers
- 13. Research Methodology
List of Figures
- Figure 1: Global Protein Characterization And Quantification Market Revenue Breakdown (billion, %) by Region 2025 & 2033
- Figure 2: Global Protein Characterization And Quantification Market Volume Breakdown (K Unit, %) by Region 2025 & 2033
- Figure 3: North America Protein Characterization And Quantification Market Revenue (billion), by Product and Services 2025 & 2033
- Figure 4: North America Protein Characterization And Quantification Market Volume (K Unit), by Product and Services 2025 & 2033
- Figure 5: North America Protein Characterization And Quantification Market Revenue Share (%), by Product and Services 2025 & 2033
- Figure 6: North America Protein Characterization And Quantification Market Volume Share (%), by Product and Services 2025 & 2033
- Figure 7: North America Protein Characterization And Quantification Market Revenue (billion), by Application 2025 & 2033
- Figure 8: North America Protein Characterization And Quantification Market Volume (K Unit), by Application 2025 & 2033
- Figure 9: North America Protein Characterization And Quantification Market Revenue Share (%), by Application 2025 & 2033
- Figure 10: North America Protein Characterization And Quantification Market Volume Share (%), by Application 2025 & 2033
- Figure 11: North America Protein Characterization And Quantification Market Revenue (billion), by End User 2025 & 2033
- Figure 12: North America Protein Characterization And Quantification Market Volume (K Unit), by End User 2025 & 2033
- Figure 13: North America Protein Characterization And Quantification Market Revenue Share (%), by End User 2025 & 2033
- Figure 14: North America Protein Characterization And Quantification Market Volume Share (%), by End User 2025 & 2033
- Figure 15: North America Protein Characterization And Quantification Market Revenue (billion), by Country 2025 & 2033
- Figure 16: North America Protein Characterization And Quantification Market Volume (K Unit), by Country 2025 & 2033
- Figure 17: North America Protein Characterization And Quantification Market Revenue Share (%), by Country 2025 & 2033
- Figure 18: North America Protein Characterization And Quantification Market Volume Share (%), by Country 2025 & 2033
- Figure 19: Europe Protein Characterization And Quantification Market Revenue (billion), by Product and Services 2025 & 2033
- Figure 20: Europe Protein Characterization And Quantification Market Volume (K Unit), by Product and Services 2025 & 2033
- Figure 21: Europe Protein Characterization And Quantification Market Revenue Share (%), by Product and Services 2025 & 2033
- Figure 22: Europe Protein Characterization And Quantification Market Volume Share (%), by Product and Services 2025 & 2033
- Figure 23: Europe Protein Characterization And Quantification Market Revenue (billion), by Application 2025 & 2033
- Figure 24: Europe Protein Characterization And Quantification Market Volume (K Unit), by Application 2025 & 2033
- Figure 25: Europe Protein Characterization And Quantification Market Revenue Share (%), by Application 2025 & 2033
- Figure 26: Europe Protein Characterization And Quantification Market Volume Share (%), by Application 2025 & 2033
- Figure 27: Europe Protein Characterization And Quantification Market Revenue (billion), by End User 2025 & 2033
- Figure 28: Europe Protein Characterization And Quantification Market Volume (K Unit), by End User 2025 & 2033
- Figure 29: Europe Protein Characterization And Quantification Market Revenue Share (%), by End User 2025 & 2033
- Figure 30: Europe Protein Characterization And Quantification Market Volume Share (%), by End User 2025 & 2033
- Figure 31: Europe Protein Characterization And Quantification Market Revenue (billion), by Country 2025 & 2033
- Figure 32: Europe Protein Characterization And Quantification Market Volume (K Unit), by Country 2025 & 2033
- Figure 33: Europe Protein Characterization And Quantification Market Revenue Share (%), by Country 2025 & 2033
- Figure 34: Europe Protein Characterization And Quantification Market Volume Share (%), by Country 2025 & 2033
- Figure 35: Asia Pacific Protein Characterization And Quantification Market Revenue (billion), by Product and Services 2025 & 2033
- Figure 36: Asia Pacific Protein Characterization And Quantification Market Volume (K Unit), by Product and Services 2025 & 2033
- Figure 37: Asia Pacific Protein Characterization And Quantification Market Revenue Share (%), by Product and Services 2025 & 2033
- Figure 38: Asia Pacific Protein Characterization And Quantification Market Volume Share (%), by Product and Services 2025 & 2033
- Figure 39: Asia Pacific Protein Characterization And Quantification Market Revenue (billion), by Application 2025 & 2033
- Figure 40: Asia Pacific Protein Characterization And Quantification Market Volume (K Unit), by Application 2025 & 2033
- Figure 41: Asia Pacific Protein Characterization And Quantification Market Revenue Share (%), by Application 2025 & 2033
- Figure 42: Asia Pacific Protein Characterization And Quantification Market Volume Share (%), by Application 2025 & 2033
- Figure 43: Asia Pacific Protein Characterization And Quantification Market Revenue (billion), by End User 2025 & 2033
- Figure 44: Asia Pacific Protein Characterization And Quantification Market Volume (K Unit), by End User 2025 & 2033
- Figure 45: Asia Pacific Protein Characterization And Quantification Market Revenue Share (%), by End User 2025 & 2033
- Figure 46: Asia Pacific Protein Characterization And Quantification Market Volume Share (%), by End User 2025 & 2033
- Figure 47: Asia Pacific Protein Characterization And Quantification Market Revenue (billion), by Country 2025 & 2033
- Figure 48: Asia Pacific Protein Characterization And Quantification Market Volume (K Unit), by Country 2025 & 2033
- Figure 49: Asia Pacific Protein Characterization And Quantification Market Revenue Share (%), by Country 2025 & 2033
- Figure 50: Asia Pacific Protein Characterization And Quantification Market Volume Share (%), by Country 2025 & 2033
- Figure 51: Middle East and Africa Protein Characterization And Quantification Market Revenue (billion), by Product and Services 2025 & 2033
- Figure 52: Middle East and Africa Protein Characterization And Quantification Market Volume (K Unit), by Product and Services 2025 & 2033
- Figure 53: Middle East and Africa Protein Characterization And Quantification Market Revenue Share (%), by Product and Services 2025 & 2033
- Figure 54: Middle East and Africa Protein Characterization And Quantification Market Volume Share (%), by Product and Services 2025 & 2033
- Figure 55: Middle East and Africa Protein Characterization And Quantification Market Revenue (billion), by Application 2025 & 2033
- Figure 56: Middle East and Africa Protein Characterization And Quantification Market Volume (K Unit), by Application 2025 & 2033
- Figure 57: Middle East and Africa Protein Characterization And Quantification Market Revenue Share (%), by Application 2025 & 2033
- Figure 58: Middle East and Africa Protein Characterization And Quantification Market Volume Share (%), by Application 2025 & 2033
- Figure 59: Middle East and Africa Protein Characterization And Quantification Market Revenue (billion), by End User 2025 & 2033
- Figure 60: Middle East and Africa Protein Characterization And Quantification Market Volume (K Unit), by End User 2025 & 2033
- Figure 61: Middle East and Africa Protein Characterization And Quantification Market Revenue Share (%), by End User 2025 & 2033
- Figure 62: Middle East and Africa Protein Characterization And Quantification Market Volume Share (%), by End User 2025 & 2033
- Figure 63: Middle East and Africa Protein Characterization And Quantification Market Revenue (billion), by Country 2025 & 2033
- Figure 64: Middle East and Africa Protein Characterization And Quantification Market Volume (K Unit), by Country 2025 & 2033
- Figure 65: Middle East and Africa Protein Characterization And Quantification Market Revenue Share (%), by Country 2025 & 2033
- Figure 66: Middle East and Africa Protein Characterization And Quantification Market Volume Share (%), by Country 2025 & 2033
- Figure 67: South America Protein Characterization And Quantification Market Revenue (billion), by Product and Services 2025 & 2033
- Figure 68: South America Protein Characterization And Quantification Market Volume (K Unit), by Product and Services 2025 & 2033
- Figure 69: South America Protein Characterization And Quantification Market Revenue Share (%), by Product and Services 2025 & 2033
- Figure 70: South America Protein Characterization And Quantification Market Volume Share (%), by Product and Services 2025 & 2033
- Figure 71: South America Protein Characterization And Quantification Market Revenue (billion), by Application 2025 & 2033
- Figure 72: South America Protein Characterization And Quantification Market Volume (K Unit), by Application 2025 & 2033
- Figure 73: South America Protein Characterization And Quantification Market Revenue Share (%), by Application 2025 & 2033
- Figure 74: South America Protein Characterization And Quantification Market Volume Share (%), by Application 2025 & 2033
- Figure 75: South America Protein Characterization And Quantification Market Revenue (billion), by End User 2025 & 2033
- Figure 76: South America Protein Characterization And Quantification Market Volume (K Unit), by End User 2025 & 2033
- Figure 77: South America Protein Characterization And Quantification Market Revenue Share (%), by End User 2025 & 2033
- Figure 78: South America Protein Characterization And Quantification Market Volume Share (%), by End User 2025 & 2033
- Figure 79: South America Protein Characterization And Quantification Market Revenue (billion), by Country 2025 & 2033
- Figure 80: South America Protein Characterization And Quantification Market Volume (K Unit), by Country 2025 & 2033
- Figure 81: South America Protein Characterization And Quantification Market Revenue Share (%), by Country 2025 & 2033
- Figure 82: South America Protein Characterization And Quantification Market Volume Share (%), by Country 2025 & 2033
List of Tables
- Table 1: Global Protein Characterization And Quantification Market Revenue billion Forecast, by Product and Services 2020 & 2033
- Table 2: Global Protein Characterization And Quantification Market Volume K Unit Forecast, by Product and Services 2020 & 2033
- Table 3: Global Protein Characterization And Quantification Market Revenue billion Forecast, by Application 2020 & 2033
- Table 4: Global Protein Characterization And Quantification Market Volume K Unit Forecast, by Application 2020 & 2033
- Table 5: Global Protein Characterization And Quantification Market Revenue billion Forecast, by End User 2020 & 2033
- Table 6: Global Protein Characterization And Quantification Market Volume K Unit Forecast, by End User 2020 & 2033
- Table 7: Global Protein Characterization And Quantification Market Revenue billion Forecast, by Region 2020 & 2033
- Table 8: Global Protein Characterization And Quantification Market Volume K Unit Forecast, by Region 2020 & 2033
- Table 9: Global Protein Characterization And Quantification Market Revenue billion Forecast, by Product and Services 2020 & 2033
- Table 10: Global Protein Characterization And Quantification Market Volume K Unit Forecast, by Product and Services 2020 & 2033
- Table 11: Global Protein Characterization And Quantification Market Revenue billion Forecast, by Application 2020 & 2033
- Table 12: Global Protein Characterization And Quantification Market Volume K Unit Forecast, by Application 2020 & 2033
- Table 13: Global Protein Characterization And Quantification Market Revenue billion Forecast, by End User 2020 & 2033
- Table 14: Global Protein Characterization And Quantification Market Volume K Unit Forecast, by End User 2020 & 2033
- Table 15: Global Protein Characterization And Quantification Market Revenue billion Forecast, by Country 2020 & 2033
- Table 16: Global Protein Characterization And Quantification Market Volume K Unit Forecast, by Country 2020 & 2033
- Table 17: United States Protein Characterization And Quantification Market Revenue (billion) Forecast, by Application 2020 & 2033
- Table 18: United States Protein Characterization And Quantification Market Volume (K Unit) Forecast, by Application 2020 & 2033
- Table 19: Canada Protein Characterization And Quantification Market Revenue (billion) Forecast, by Application 2020 & 2033
- Table 20: Canada Protein Characterization And Quantification Market Volume (K Unit) Forecast, by Application 2020 & 2033
- Table 21: Mexico Protein Characterization And Quantification Market Revenue (billion) Forecast, by Application 2020 & 2033
- Table 22: Mexico Protein Characterization And Quantification Market Volume (K Unit) Forecast, by Application 2020 & 2033
- Table 23: Global Protein Characterization And Quantification Market Revenue billion Forecast, by Product and Services 2020 & 2033
- Table 24: Global Protein Characterization And Quantification Market Volume K Unit Forecast, by Product and Services 2020 & 2033
- Table 25: Global Protein Characterization And Quantification Market Revenue billion Forecast, by Application 2020 & 2033
- Table 26: Global Protein Characterization And Quantification Market Volume K Unit Forecast, by Application 2020 & 2033
- Table 27: Global Protein Characterization And Quantification Market Revenue billion Forecast, by End User 2020 & 2033
- Table 28: Global Protein Characterization And Quantification Market Volume K Unit Forecast, by End User 2020 & 2033
- Table 29: Global Protein Characterization And Quantification Market Revenue billion Forecast, by Country 2020 & 2033
- Table 30: Global Protein Characterization And Quantification Market Volume K Unit Forecast, by Country 2020 & 2033
- Table 31: Germany Protein Characterization And Quantification Market Revenue (billion) Forecast, by Application 2020 & 2033
- Table 32: Germany Protein Characterization And Quantification Market Volume (K Unit) Forecast, by Application 2020 & 2033
- Table 33: United Kingdom Protein Characterization And Quantification Market Revenue (billion) Forecast, by Application 2020 & 2033
- Table 34: United Kingdom Protein Characterization And Quantification Market Volume (K Unit) Forecast, by Application 2020 & 2033
- Table 35: France Protein Characterization And Quantification Market Revenue (billion) Forecast, by Application 2020 & 2033
- Table 36: France Protein Characterization And Quantification Market Volume (K Unit) Forecast, by Application 2020 & 2033
- Table 37: Italy Protein Characterization And Quantification Market Revenue (billion) Forecast, by Application 2020 & 2033
- Table 38: Italy Protein Characterization And Quantification Market Volume (K Unit) Forecast, by Application 2020 & 2033
- Table 39: Spain Protein Characterization And Quantification Market Revenue (billion) Forecast, by Application 2020 & 2033
- Table 40: Spain Protein Characterization And Quantification Market Volume (K Unit) Forecast, by Application 2020 & 2033
- Table 41: Rest of Europe Protein Characterization And Quantification Market Revenue (billion) Forecast, by Application 2020 & 2033
- Table 42: Rest of Europe Protein Characterization And Quantification Market Volume (K Unit) Forecast, by Application 2020 & 2033
- Table 43: Global Protein Characterization And Quantification Market Revenue billion Forecast, by Product and Services 2020 & 2033
- Table 44: Global Protein Characterization And Quantification Market Volume K Unit Forecast, by Product and Services 2020 & 2033
- Table 45: Global Protein Characterization And Quantification Market Revenue billion Forecast, by Application 2020 & 2033
- Table 46: Global Protein Characterization And Quantification Market Volume K Unit Forecast, by Application 2020 & 2033
- Table 47: Global Protein Characterization And Quantification Market Revenue billion Forecast, by End User 2020 & 2033
- Table 48: Global Protein Characterization And Quantification Market Volume K Unit Forecast, by End User 2020 & 2033
- Table 49: Global Protein Characterization And Quantification Market Revenue billion Forecast, by Country 2020 & 2033
- Table 50: Global Protein Characterization And Quantification Market Volume K Unit Forecast, by Country 2020 & 2033
- Table 51: China Protein Characterization And Quantification Market Revenue (billion) Forecast, by Application 2020 & 2033
- Table 52: China Protein Characterization And Quantification Market Volume (K Unit) Forecast, by Application 2020 & 2033
- Table 53: Japan Protein Characterization And Quantification Market Revenue (billion) Forecast, by Application 2020 & 2033
- Table 54: Japan Protein Characterization And Quantification Market Volume (K Unit) Forecast, by Application 2020 & 2033
- Table 55: India Protein Characterization And Quantification Market Revenue (billion) Forecast, by Application 2020 & 2033
- Table 56: India Protein Characterization And Quantification Market Volume (K Unit) Forecast, by Application 2020 & 2033
- Table 57: Australia Protein Characterization And Quantification Market Revenue (billion) Forecast, by Application 2020 & 2033
- Table 58: Australia Protein Characterization And Quantification Market Volume (K Unit) Forecast, by Application 2020 & 2033
- Table 59: South Korea Protein Characterization And Quantification Market Revenue (billion) Forecast, by Application 2020 & 2033
- Table 60: South Korea Protein Characterization And Quantification Market Volume (K Unit) Forecast, by Application 2020 & 2033
- Table 61: Rest of Asia Pacific Protein Characterization And Quantification Market Revenue (billion) Forecast, by Application 2020 & 2033
- Table 62: Rest of Asia Pacific Protein Characterization And Quantification Market Volume (K Unit) Forecast, by Application 2020 & 2033
- Table 63: Global Protein Characterization And Quantification Market Revenue billion Forecast, by Product and Services 2020 & 2033
- Table 64: Global Protein Characterization And Quantification Market Volume K Unit Forecast, by Product and Services 2020 & 2033
- Table 65: Global Protein Characterization And Quantification Market Revenue billion Forecast, by Application 2020 & 2033
- Table 66: Global Protein Characterization And Quantification Market Volume K Unit Forecast, by Application 2020 & 2033
- Table 67: Global Protein Characterization And Quantification Market Revenue billion Forecast, by End User 2020 & 2033
- Table 68: Global Protein Characterization And Quantification Market Volume K Unit Forecast, by End User 2020 & 2033
- Table 69: Global Protein Characterization And Quantification Market Revenue billion Forecast, by Country 2020 & 2033
- Table 70: Global Protein Characterization And Quantification Market Volume K Unit Forecast, by Country 2020 & 2033
- Table 71: GCC Protein Characterization And Quantification Market Revenue (billion) Forecast, by Application 2020 & 2033
- Table 72: GCC Protein Characterization And Quantification Market Volume (K Unit) Forecast, by Application 2020 & 2033
- Table 73: South Africa Protein Characterization And Quantification Market Revenue (billion) Forecast, by Application 2020 & 2033
- Table 74: South Africa Protein Characterization And Quantification Market Volume (K Unit) Forecast, by Application 2020 & 2033
- Table 75: Rest of Middle East and Africa Protein Characterization And Quantification Market Revenue (billion) Forecast, by Application 2020 & 2033
- Table 76: Rest of Middle East and Africa Protein Characterization And Quantification Market Volume (K Unit) Forecast, by Application 2020 & 2033
- Table 77: Global Protein Characterization And Quantification Market Revenue billion Forecast, by Product and Services 2020 & 2033
- Table 78: Global Protein Characterization And Quantification Market Volume K Unit Forecast, by Product and Services 2020 & 2033
- Table 79: Global Protein Characterization And Quantification Market Revenue billion Forecast, by Application 2020 & 2033
- Table 80: Global Protein Characterization And Quantification Market Volume K Unit Forecast, by Application 2020 & 2033
- Table 81: Global Protein Characterization And Quantification Market Revenue billion Forecast, by End User 2020 & 2033
- Table 82: Global Protein Characterization And Quantification Market Volume K Unit Forecast, by End User 2020 & 2033
- Table 83: Global Protein Characterization And Quantification Market Revenue billion Forecast, by Country 2020 & 2033
- Table 84: Global Protein Characterization And Quantification Market Volume K Unit Forecast, by Country 2020 & 2033
- Table 85: Brazil Protein Characterization And Quantification Market Revenue (billion) Forecast, by Application 2020 & 2033
- Table 86: Brazil Protein Characterization And Quantification Market Volume (K Unit) Forecast, by Application 2020 & 2033
- Table 87: Argentina Protein Characterization And Quantification Market Revenue (billion) Forecast, by Application 2020 & 2033
- Table 88: Argentina Protein Characterization And Quantification Market Volume (K Unit) Forecast, by Application 2020 & 2033
- Table 89: Rest of South America Protein Characterization And Quantification Market Revenue (billion) Forecast, by Application 2020 & 2033
- Table 90: Rest of South America Protein Characterization And Quantification Market Volume (K Unit) Forecast, by Application 2020 & 2033
Frequently Asked Questions
1. What is the projected Compound Annual Growth Rate (CAGR) of the Protein Characterization And Quantification Market?
The projected CAGR is approximately 9%.
2. Which companies are prominent players in the Protein Characterization And Quantification Market?
Key companies in the market include RayBiotech Inc, Promega Corporation, Merck KGaA, Waters Corporation, MS Bioworks, Sartorius AG, QIAGEN N V, Shimadzu Corporation, VProteomics, Creative Proteomics, Thermo Fisher Scientific, Agilent Technologies, HORIBA Ltd.
3. What are the main segments of the Protein Characterization And Quantification Market?
The market segments include Product and Services, Application, End User.
4. Can you provide details about the market size?
The market size is estimated to be USD 2.49 billion as of 2022.
5. What are some drivers contributing to market growth?
Increasing Adoption of Biologics; Increasing R&D Expenditure and Government Funding for Proteomics; Technological Advancements in Protein Characterization and Quantitation.
6. What are the notable trends driving market growth?
Mass Spectrometry Instruments Segment is Expected to Witness Significant Growth Over the Forecast Period.
7. Are there any restraints impacting market growth?
High Cost Associated with Instrumentation.
8. Can you provide examples of recent developments in the market?
February 2023: Charles River Laboratories International, Inc. launched its first Enzyme-Linked Immunosorbent Assay (ELISA) Kit. It is to detect and quantify residual host cell proteins (HCP) in CHO-based biotherapeutics.
9. What pricing options are available for accessing the report?
Pricing options include single-user, multi-user, and enterprise licenses priced at USD 4750, USD 5250, and USD 8750 respectively.
10. Is the market size provided in terms of value or volume?
The market size is provided in terms of value, measured in billion and volume, measured in K Unit.
11. Are there any specific market keywords associated with the report?
Yes, the market keyword associated with the report is "Protein Characterization And Quantification Market," which aids in identifying and referencing the specific market segment covered.
12. How do I determine which pricing option suits my needs best?
The pricing options vary based on user requirements and access needs. Individual users may opt for single-user licenses, while businesses requiring broader access may choose multi-user or enterprise licenses for cost-effective access to the report.
13. Are there any additional resources or data provided in the Protein Characterization And Quantification Market report?
While the report offers comprehensive insights, it's advisable to review the specific contents or supplementary materials provided to ascertain if additional resources or data are available.
14. How can I stay updated on further developments or reports in the Protein Characterization And Quantification Market?
To stay informed about further developments, trends, and reports in the Protein Characterization And Quantification Market, consider subscribing to industry newsletters, following relevant companies and organizations, or regularly checking reputable industry news sources and publications.
Methodology
Step 1 - Identification of Relevant Samples Size from Population Database


Step 2 - Approaches for Defining Global Market Size (Value, Volume* & Price*)

Note*: In applicable scenarios
Step 3 - Data Sources
Primary Research
- Web Analytics
- Survey Reports
- Research Institute
- Latest Research Reports
- Opinion Leaders
Secondary Research
- Annual Reports
- White Paper
- Latest Press Release
- Industry Association
- Paid Database
- Investor Presentations

Step 4 - Data Triangulation
Involves using different sources of information in order to increase the validity of a study
These sources are likely to be stakeholders in a program - participants, other researchers, program staff, other community members, and so on.
Then we put all data in single framework & apply various statistical tools to find out the dynamic on the market.
During the analysis stage, feedback from the stakeholder groups would be compared to determine areas of agreement as well as areas of divergence